Project - Data Handling and Interpolation
AIM:
Data handling and interpolation.
OBJECTIVES :
- Finding missing data and save it in text.
- interpolate the data set
- save your programe and attach the same
- creating text file and upload in attachment
PROJECT CODES :
clc
clear all
VI=xlsread('VI.xlsx')  %reading deta from XL file
Voltage=VI(:,1);  %saving data as first column voltage
Amps=VI(:,2);     %saving data as second column amps
x=[-17.3:0.1:0.9]; %applying range
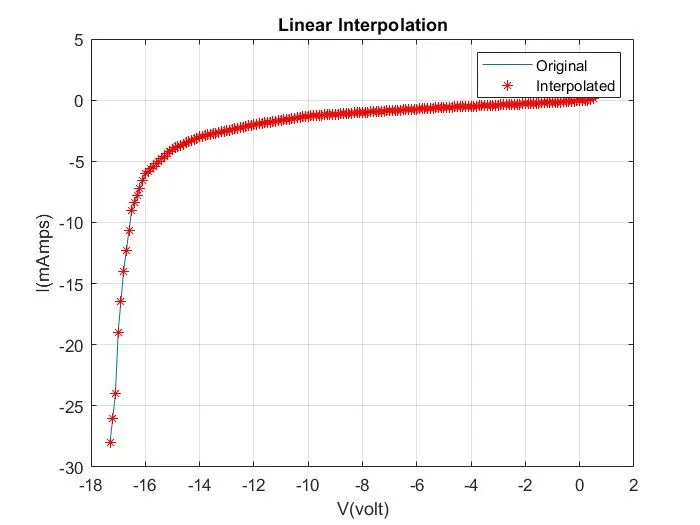
y=interp1(Voltage,Amps,x,'linear');  %applying interpolation to get 2D image
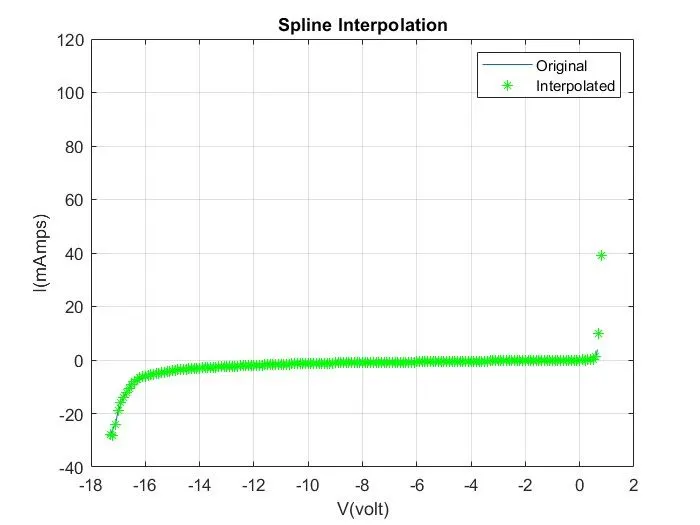
y2=interp1(Voltage,Amps,x,'spline');
figure(1);  %ploting VI graph and applying values
plot(Voltage,Amps,x,y,'r*');
grid;
title('Linear Interpolation');
ylabel('I(mAmps)');
xlabel('V(volt)');
legend('Original','Interpolated')
figure(2);  %ploting VI graph and applying values
plot(Voltage,Amps,x,y2,'g*');
grid;
title('Spline Interpolation');
ylabel('I(mAmps)');
xlabel('V(volt)');
legend('Original','Interpolated')
VV=[-17.3 -17.1 -17 -16.8 -16.5 -16 -15 -14 -12 -10 -8 -5 -2 0.2 0.09 0.19 0.27 0.39 0.43 0.5 0.55 0.6 0.62 0.65];
II=interp1(Voltage,Amps,VV);
z=[VV' II']
writematrix(z,'InterpolationData.txt')
RESULTS: