Week 6 - Data analysis
DATA VISUALIZER
Code:
import matplotlib.pyplot as plt
import numpy as np
import math

#ACCEPTING THE FILE WITH EXTENSION .OUT ONLY
try:
    var1 = input("Please enter the file name with .out extension: ")
    print("Input received from the user:",var1)

except FileNotFoundError:
    print("File not recognized. Please provide a valid CONVERGE output file")

#READING THE DATA FROM THE DATAFILE
file_object = open(var1,'r')

name=[]
units=[]
crank=[]
line_count = 1
#TO PRINT THE PARAMETERS PRESENT INSIDE THE DATAFILE
for i in file_object:
    crank.append(i)
    if len(crank)==5:
        a=crank[2]
        b=crank[3]
        a=a.split()
        b=b.split()
        c=0
        a.pop(0)
        for i in a:
            c=c+1
            name.append(i)
            units.append(b[c])
            print(str(c)+"     "+i+"             "+b[c])

def value(var2,var3):
    x_data = []
    y_data = []

    file_object = open(var1,'r')

    for line in file_object:
        if '#' not in line:
            x_data.append(float(line.split()[var2-1])) #STORING THE VALUES OF DIFFERENT PARAMETERS
            y_data.append(float(line.split()[var3-1]))

    #PLOTTING THE GRAPHS
    ax=plt.axes()
    ax.set_facecolor('lightgrey')
    plt.figure(1)
    plt.xlabel(name[var2-1]+units[var2-1],color='green',fontsize='large',fontweight='bold')
    plt.ylabel(name[var3-1]+units[var3-1],color='purple',fontsize='large',fontweight='bold')
    plt.title(name[var2-1]+units[var2-1] + ' V/S '+ name[var3-1]+units[var3-1])
    plt.plot(x_data,y_data)
    plt.show()

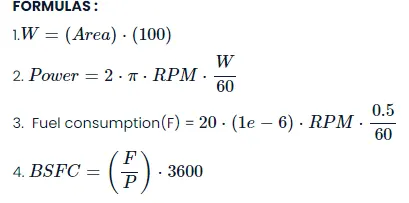
    #BASIC PERFORMANCE CALCULATIONS
    if (var2==8 and var3==2):
        rpm=1500
        area=np.trapz(y_data,x_data)   #IN MJ
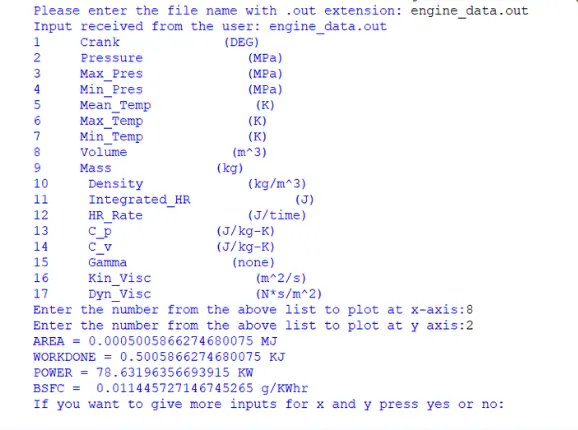
        print("AREA =",area,"MJ")
        Workdone=area*1000             #IN KJ
        print("WORKDONE =",Workdone,"KJ")
        Power = 2*math.pi*rpm*Workdone/60   #IN KW
        print("POWER =",Power,"KW")
        Fuelconsumption = (20*(1e-6))*rpm*(0.5/60) #IN GRAMS PER HOUR
        BSFC = ((Fuelconsumption)/(Power))*3600    #IN G/KW HR
        print("BSFC = ",BSFC,"g/KWhr")


loop='yes'
while loop=='yes':
    g = int(input("Enter the number from the above list to plot at x-axis:"))  #TAKING THE INPUT FROM THE USER WHAT VALUES TO TAKE AT X AXIS
    u = int(input("Enter the number from the above list to plot at y axis:"))  #TAKING THE INPUT FROM THE USER WHAT VALUES TO TAKE AT Y AXIS
    value(g,u)         #FUNCTION CALL
    loop=input('If you want to give more inputs for x and y press yes or no:  ')
Output:
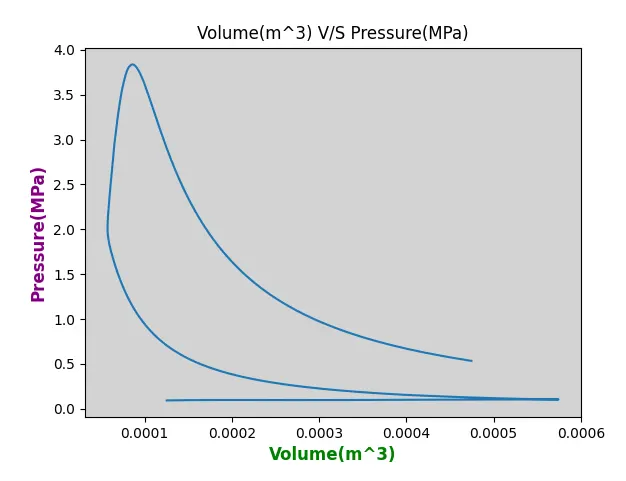
GRAPHS has been plotted:
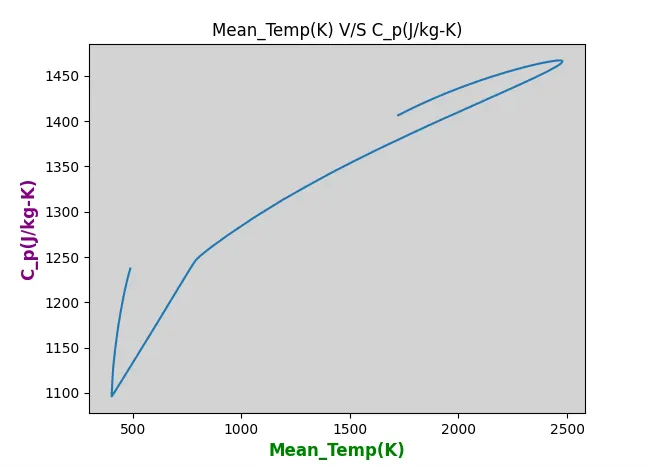
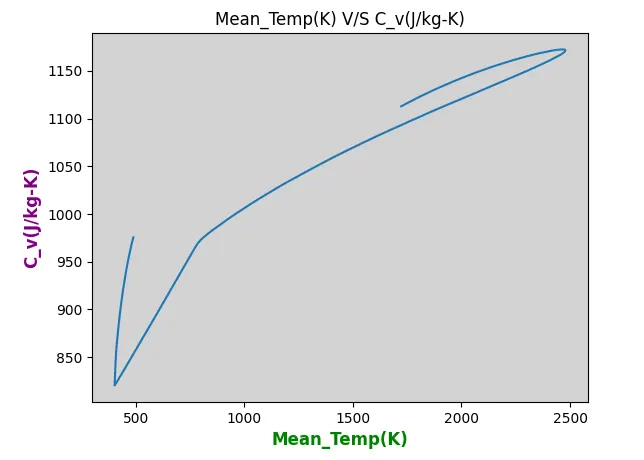
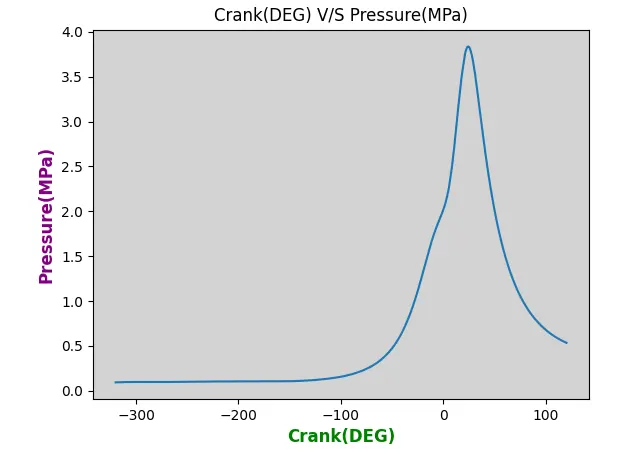
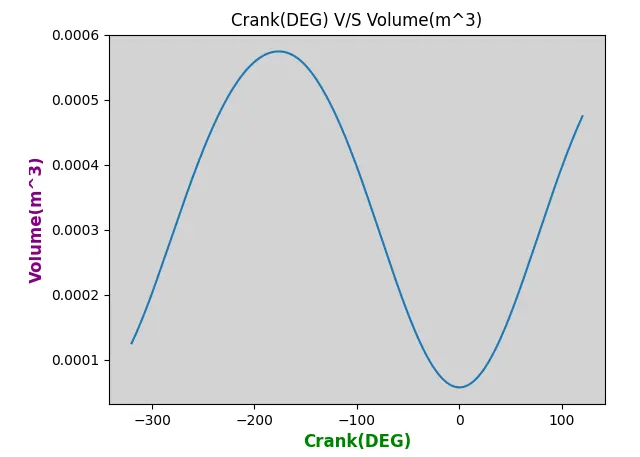
Basic performance calculation:
Engine RPM is taken as 1500 and from the above output the BSFC has been calculated to be 0.011445727146745265 g/kWhr