Week 6 - Data analysis
Aim :
To write a Python code that extracts the data from a data file and performs data analysis, visualization, compatibility check and basic performance calculation.
Theory:
Parsing means breaking it down into component parts so that its syntax can be analyzed, categorized, and understood. By doing this we are going to a string into parts and then recognise the parts to convert it into something simpler than a string. File parsing is to resolve things into component or subpart form and describe the syntactic file. That is, reading in the data stream and building a memory model of it.
In order to perform the parsing operation a simulation file named ‘engine_data.out’ is provided. The file consists of 17 columns of various engine performance characteristic data. The data given in the file are as follows,
1: Crank [deg], 2: Pressure [MPa], 3: Max Pressure [MPa], 4: Min Pressure [MPa], 5: Mean Temperature [K], 6: Max Temperature [K], 7: Min Temperature [K], 8: Volume [m^3], 9: Mass [kg], 10: Density [kg/m^3], 11: Integrated HR [J], 12: HR Rate [J/time], 13: C_p [J/kg-K], 14: C_v [J/kg-K], 15: gamma, 16: Kinematic Viscosity [m^2/s], and 17: Dynamic Viscosity [N.s/m^2].
The program can be divided into several sub-divisions,
- File compatibility check
The program first takes the file name as input from the user and checks whether it is a file which can be operated upon. If it is a valid file name the program continues else the program exits. A logical equal to operator is used to check whether the input string and the file name are matching.
- Data visualisation
The program is made to take in two inputs namely the x-axis column number and y-axis column number and then uses the matplot.lib library to plot and subsequently save the generated plot with an appropriate name.
All this is automated. All the required data from the file are obtained by looping through the data sheet and taking the required data using the line.split() command.
- Engine performance calculation
In case the user asks the program to make a P-V plot, the program also runs another set of codes to calculate the area under the P-V plot, Power Output and the specific fuel consumption as per the following equations,
Work done per cycle = Area under P-V plot in MJ
Power Output = `A.n.10^6 [W]`
n = Number of cycles per second
`n = N/2.60`; for 4-stroke engine
N = Rotations per minute
Specific Fuel Consumption, SFC = (Fuel consumed in kg/hr)/(Power Output in kW)
Main Program
#importing modules
import matplotlib.pyplot as plt
import numpy as np
import math
from numpy import trapz


#importing a validating the input file

file_name = input('Enter the file name with .dot extension: ')


try :
	data = open(file_name, 'r')
	print('File successfully recognized')
except FileNotFoundError:
	print('Sorry. This file cannot be used/does not exist')
	exit()


#reading columns as input

column_1 = int(input('Enter 1st column parameter (x axis): '))
column_2 = int(input('Enter 2nd column parameter (y axis): '))


#Basic initialization
column_1_data = []
column_2_data = []
line_count = 1
#x_label = []
#y_label = []

#File parsing starts here
for line in open(file_name):
	if '#' not in line:
		column_1_data.append(float(line.split()[column_1-1]))
		column_2_data.append(float(line.split()[column_2-1]))


#Code for getting the column title from line 3
for line in open(file_name):
	if line_count == 3:
		x_label = ((line.split()[column_1]))
		y_label = ((line.split()[column_2]))
	line_count = line_count + 1


line_count = 1 #resetting line number

#Code for getting the column title unit from line 4
for line in open('engine_data.out'):
	if line_count == 4:
		x_label_unit = ((line.split()[column_1]))
		y_label_unit = ((line.split()[column_2]))
	line_count = line_count + 1


#code for calculating area under the PV plot, Work done and specific fuel consumption


if column_1 == 8 and column_2 == 2:		#for PV diagram for the power and work calculation
	Area = np.trapz(column_2_data, column_1_data)
	Work = (Area/1000)*pow(10,6)	# pow for MPa to Pa conversion and 1000 for J to KJ

	RPM = 1500
	Power = Work*0.5*(RPM/60)			# in kW: 4-stroke


	# Assumption: Fuel consumption = 20 micro grams per one stroke cycle
	FC = 20*pow(10,-6)	#fuel consumption in grams per stroke
	FCH = FC*1500*60	#Fuel consumption per hour
	SFC = FCH/Power		#Specific fuel consumption [g/kW-hr]

	# Displaying
	print('Additional Calculations from PV Diagram')
	print('Area under PV diagram is ',Work,' kJ')
	print('Power output of Engine at 1500rpm is ',Power,' kW (as 4-Stroke)')
	print('Specific Fuel Consumption of Engine is ', SFC, ' g/kW-hr')


'''
for line in open('engine_data.out'):
	if '#' not in line:
		print(line)
		print(line.split())
		print(type(line.split()[1]))

		print((line.split()[1]))
		print(len(line.split()[1]))

		break

'''


'''
print(x_label_unit)
print(type(x_label_unit))
print(y_label_unit)
'''


#plotting code
figure_name = y_label + ' ' + x_label + '.png' #setting figure name
plt.plot(column_1_data, column_2_data, linewidth=3)
plt.xlabel(x_label + ' ' + x_label_unit)
plt.ylabel(y_label + ' ' + y_label_unit)
plt.savefig(figure_name)
plt.show()
Outputs of the program:
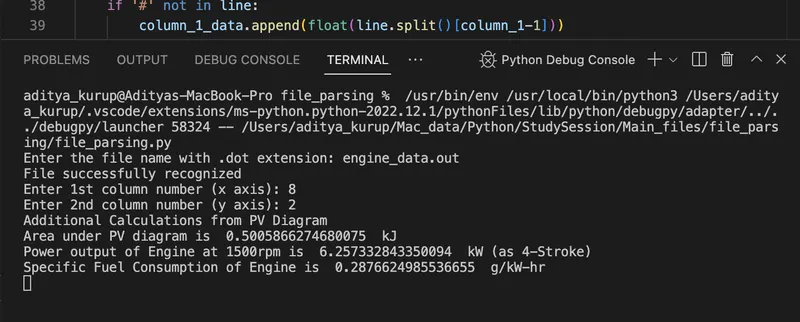
Figure 1: REPL showing file compatibility check, data input and power calculations
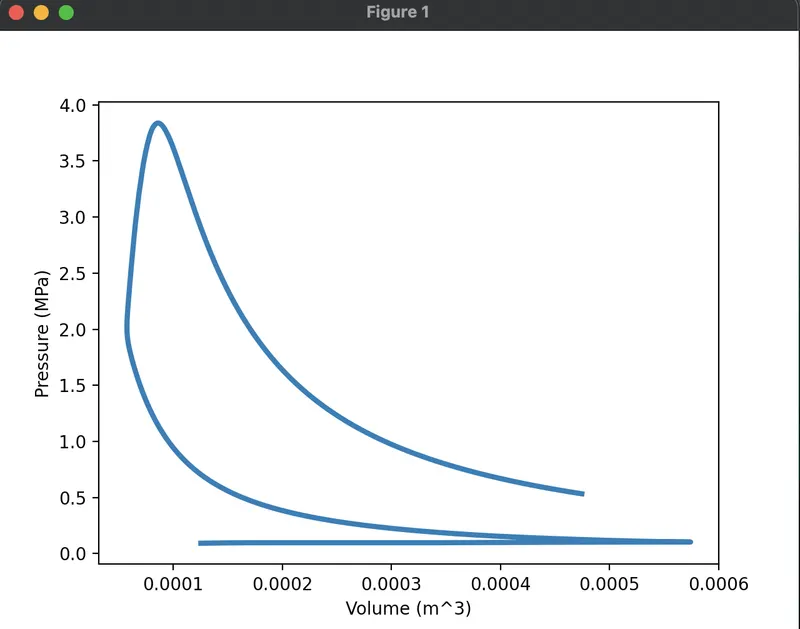
Figure 2: Generated P-V plot in python as per given data sheet
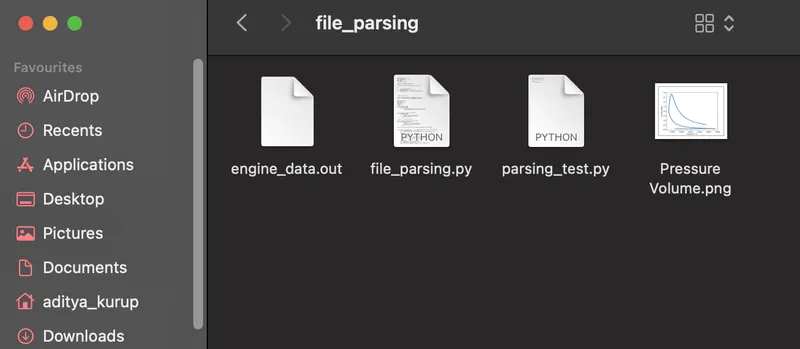
Figure 3: Data visualisation file automatically saved in directory
Conclusion:
The theoretical concepts of engine parameters and file parsing has been understood. A program in PYTHON has been created for file parsing. File parsing was done successfully for the Engine Parameter data, and their plots were created for comparison according to the chosen parameters. These plotted images were stored separately according to their parameter names automatically. The Engine performance parameters such as Work done, Power and Specific fuel consumption were calculated.