Week 6 - Data analysis
Aim :
The aim is to analyse the given data file,
Objective:
- Calculate the area under the P-V diagram. P is in column 2 and V is in column 8.
- Calculate the power output of this engine. Assume that RPM is 1500
- This engine consumed 20 micro grams of fuel (per 1 stroke cycle). Calculate its specific fuel consumption.
Procedure:
Initially we are going to import the "matplotlib.pyplot" and "numpy libraries to plot the graph and calculate the values.
First we save the program and then data file and program file is in the same folder.
The "try and except command used to check the data file is in the same folder or it has name mistake. Then we are going to open the file using the "for loop" command and then we read the data line by line. And using some counting line, if and else commands to separate the heading and numerical data.
Using "line.split command to split all the data present in the data file.
For easy to calculate we creating some input commands to plot the graphs. The data input in the x-axis and y axis.
Then we calculate the power output the engine and Specific Fuel Consumption and then we print the values.
After that we calculate the area under the curve of a PV diagram and we know that the area under the curve is work done.
We create the plot command for the x and y input arrays and then we make all the labels and the title of the graph
Then we create two empty arrays for the x input and the y input and then we read the data again. The data created then using the float, the values float and append all the values for the x and y input arrays.
Code :
import matplotlib.pyplot as plt

import math

import numpy as np

try:

	file = open('engine_data.out')

	print('data is found successfully! Now you can proceed to the next Calculations')

except:

		print('unfortunately the data is not found. Please check the file or filenamen')

file.close()

print('Information about input parameters')

pressure = []

temperature=[]

volume=[]

column_units=[]

column_name=[]

count_data=1

for line in open('engine_data.out'):

	if '#' not in line:

		count_data=count_data+1

else:

	count_data=count_data+1

	if count_data == 4:

		column_name=line.split()

		print(column_name)

	elif count_data==5:
		coulumn_units=line.split()


nx=int(input("Please enter the x-axis data of column (1 - 17) 1.Crank to 17.Dynamic viscosity"))

print(nx-1)

ny=int(input("Please enter the y-axis data of column(1-17) 1.Crank to 17.Dynamic Viscosity"))

print(ny-1)

print('the plot is',column_name[ny],"vs", column_name[nx])

data_array_x=[]

data_array_y=[]

for line in open('engine_data.out'):

	if '#' not in line:

			data_array_x.append(float (line.split()[nx-1]))


for line in open('engine_data.out'):

	if '#' not in line:

			data_array_y.append(float (line.split()[ny-1]))

plt.plot(data_array_x,data_array_y)

plt.xlabel(column_name[nx]+coulumn_units[nx])

plt.ylabel(column_name[ny]+coulumn_units[ny])

plt.title(column_name[nx]+column_name[ny] + 'Diagram')

plt.savefig(column_name[nx]+'VS'+ column_name[ny] +'.png')

plt.show()

for line in open('engine_data.out'):

	if '#' not in line:

		pressure.append(float(line.split()[1]))

		volume.append(float(line.split()[7]))

work=[]

for i in range (0,8664):

	work.append((volume[i+1]-volume[i])*(pressure[i+1]+pressure[i])*0.5)

work_done-0

for j in range (0, len(work)) :

	work_done = work_done+work[j]

	work_done1=work_done*1*1e6

print('workdone is',work_done1, 'j')

area=np.trapz(pressure, volume)

rpm=1500

power=area*1e+06*rpm/9550

print('the power output of engine is',power,'KW')

fps =20 * 1e-06

mass_flow_rate=2.99*1e-10

SFC= mass_flow_rate*36000/power

print('The specific Fuel Consumption is', SFC, 'g/KW hr')

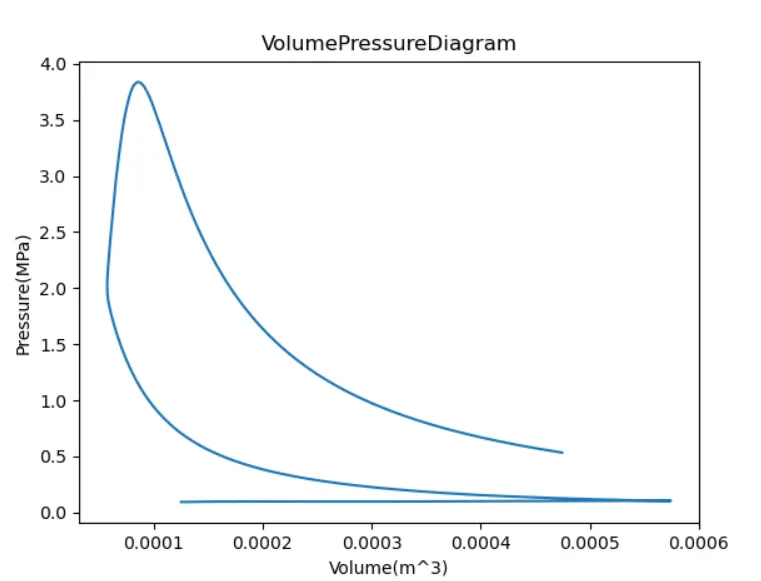
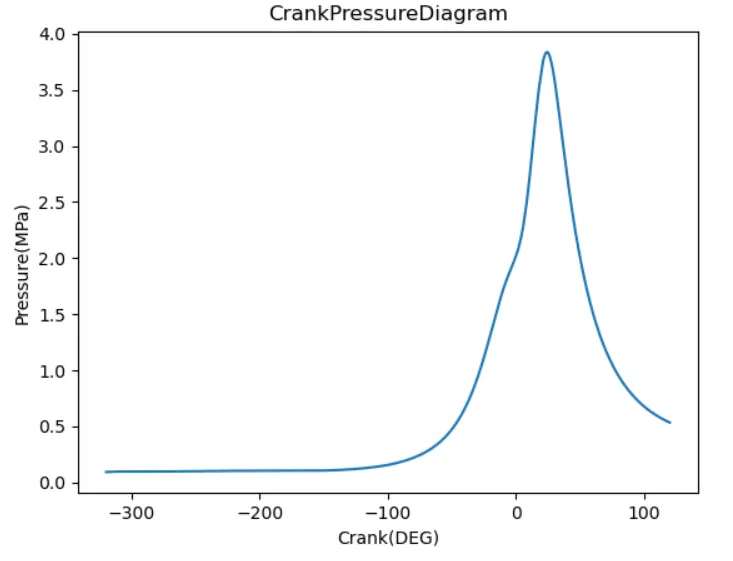
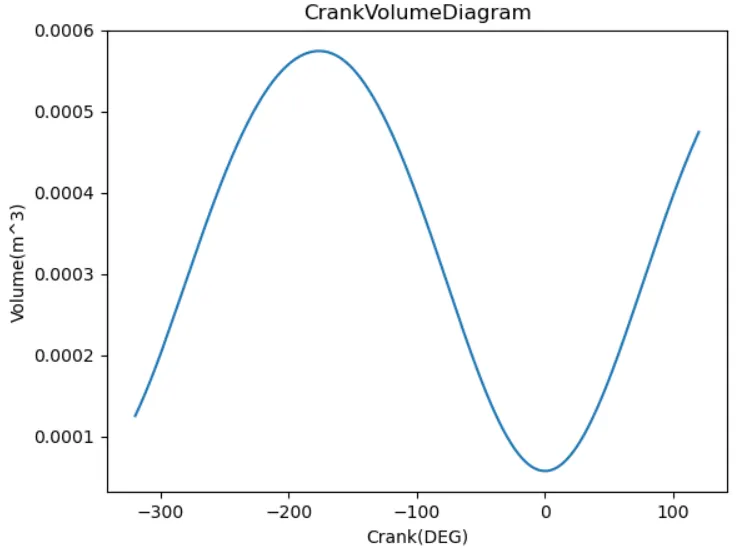
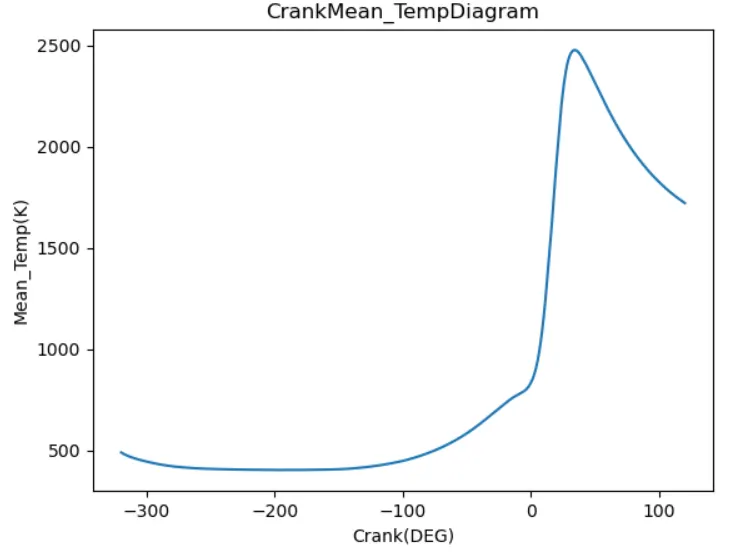
The errors that are faced are typo and indendation and are corrected,
Result :
Thus the given data has been analysed and outputs are shown.