Project 1 - Parsing NASA thermodynamic data
The aim is to write a function that extracts the 14 co-efficients and calculates the enthalpy, entropy and specific heats for all the species in the data file of NASA,
code as follows,
f1 - fopen('THERMO.dat', 'r');
open the thermo file and read,
% header of f1
h1 =fgetl(f1);
h2 =fgetl(f1);
fgetl to read 1st 2 lines,
% removing lines from 3 to 5, since the next line after header is 3rd line,
% indexing from 1 to 3 will give lines 3 to 5
for i = 1: 3
fgetl(f1);
end
removing 1st 5 lines, and starting a loop to read the datas,
% 1: 53 loop since there are 53 species
for i - 1: 53
16 = fgetl(f1);
S - strsplit(16,' ');
sp = s(1);
d = findstr(16 ,'.');
temprange = 16((d(1)-3): (d(1)+23));
temp = strsplit (temprange,' ');
locallowtemp = str2num (temp {1});
templ = locallowtemp;
localhightemp = str2num(temp{2});
temp2 = localhightemp;
localmidtemp = str2num(temp{3});
temp3=localhightemp;
the datas in line 7,8,9 contains the coeff anf can read all those values,
%coefficients from line 7
coeff_line1-fgetl(f1);
coeff_line2=fgetl(f1);
coeff_line3=fgetl(f1);
A=strfind(coeff_line1, 'E');
B=strfind(coeff_line2, 'E');
C-strfind(coeff line3, 'E');
a1=coeff_line1(1:A(1)+3);
a1=str2double(a1);
a2=coeff_line1(A(1)+4:A(2)+3);
a2=str2double(a2);
a3=coeff_line1(A(2)+4:A(3)+3);
a3=str2double(a3);
a4=coeff_line1(A(3) +4:A(4)+3);
a4=str2double(4);
a5=coeff_line1(A(4)+4:A(5)+3);
a5=str2double(a5);
a6=coeff_line2(1:B(1)+3);
a6=str2double(a6);
a7=coeff_line2(B(1)+4:B(2)+3);
a7=str2double(a7);
b1=coeff_line2(B(2)+4:B(3)+3);
b1=str2double(b1);
b2=coeff_line2(B(3)+4:B(4)+3);
b2=str2double(b2);
b3=coeff_line3(B(4)+4:B(5)+3);
b3=str2double(63);
b4=coeff_line3(1:C(1)+3);
b4=str2double(b4);
b5=coeff_line3(C(1)+4:C(2)+3);
b5=str2double(b5);
b6=coeff_line3(C(2)+4:C(3)+3);
b6=str2double(b6);
b7=coeff_line3(C(3)+4:C(4)+3);
b7=str2double(b7);
molecule_name=char(sp);
here are the values of a1 - a6 and b1 - b7 are high temperature coefficients
mkdir(['D:fileparsemolecule', molecule_name]);
it create specific files for each one,
% solve for Cp, H, and s
M - linspace (temp1, temp2, 20);
T = int16(M(1:20));
R = 8.314;
k =1: length (T);
for j=1: length (k)
if (k) <= 1000
Cp = R*(b1 + (b2 * T(K)) + (b3*T (k).^2)+(b4*T (k).^3) + (65*T(k).^4));
H= (R*T (k)).*( b1+(b2.*T(k)./2)+(b3. *T (k).^2 /3)+(b4.*T (k).^3/4) + (65.*T(k).^4/5)+ (b6 /T(k))) ;
S=R*(b1.*log(double(T (k)) +(b2 .T (k)+(b3.*T(k).^2/2)+(b4.* T (K).^3/3) + (b5.*T (k).^4/4) +b7));
else
Cp = R* (a1+(a2* T(k))+(a3*T(k).^2)+(a4 *T(k).^3)+(a5* T(k). 4));
H= (R* T (k)). *( a1+(a2*T(k))./ 2)+((a3*T(k).^2)./ 3) + (a4*T (k).^3./4) + ((a5*T(k).^4)./5) +(a6./T(k));
S=R*(a1.*log(double(T(K))+double((a2 .*T(K))+(a3.*T(k).^2./2)+(a4.*T(k).^3./3) +(a5.*T(k).^4./4)+a7)));
end
end
the calculations are done
%plots
figure (1)
plot (M ,H,'-*');
title (molecule_name);
xlabel ('temperature')
ylabel (' enthalpy' )
figure (2)
plot (M, Cp, 'o')
title (molecule_name);
xlabel (' temperature )
ylabel (' specific heat ')
figure (3)
plot (M, S, '-')
title (molecule_name);
xlabel (' temperature )
ylabel (' entropy )
directory =(['D:fileparsemolecule', molecule_name]);
cd (directory );
saveas (1, 'Enthalpy.jpg');
% saving the plots in respective folder for each molecular species
saveas (2, 'Specificheat .jpg');
saveas (3,' Entropy.jpg' );
cd ('D:fileparse' );
weight (i) = molecular_mass (molecule_name);
end
plotting and saving has been done,
f1 - fopen('THERMO.dat', 'r');
% header of f1
h1 =fgetl(f1);
h2 =fgetl(f1);
 % removing lines from 3 to 5, since the next line after header is 3rd line,
% indexing from 1 to 3 will give lines 3 to 5
for i = 1: 3
fgetl(f1);
 end
% 1: 53 loop since there are 53 species
 for i - 1: 53
16 = fgetl(f1);
 S - strsplit(16,' ');
sp = s(1);
d = findstr(16 ,'.');
 temprange = 16((d(1)-3): (d(1)+23));
 temp = strsplit (temprange,' ');
locallowtemp = str2num (temp {1});
 templ = locallowtemp;
 localhightemp = str2num(temp{2});
 temp2 = localhightemp;
 localmidtemp = str2num(temp{3});
 temp3=localhightemp;
 %coefficients from line 7
coeff_line1-fgetl(f1);
coeff_line2=fgetl(f1);
 coeff_line3=fgetl(f1);
 A=strfind(coeff_line1, 'E');
 B=strfind(coeff_line2, 'E');
 C-strfind(coeff line3, 'E');
 a1=coeff_line1(1:A(1)+3);
 a1=str2double(a1);
a2=coeff_line1(A(1)+4:A(2)+3);
a2=str2double(a2);
a3=coeff_line1(A(2)+4:A(3)+3);
a3=str2double(a3);
a4=coeff_line1(A(3) +4:A(4)+3);
a4=str2double(4);
a5=coeff_line1(A(4)+4:A(5)+3);
a5=str2double(a5);
a6=coeff_line2(1:B(1)+3);
a6=str2double(a6);
a7=coeff_line2(B(1)+4:B(2)+3);
a7=str2double(a7);
b1=coeff_line2(B(2)+4:B(3)+3);
b1=str2double(b1);
b2=coeff_line2(B(3)+4:B(4)+3);
b2=str2double(b2);
b3=coeff_line3(B(4)+4:B(5)+3);
b3=str2double(63);
b4=coeff_line3(1:C(1)+3);
b4=str2double(b4);
b5=coeff_line3(C(1)+4:C(2)+3);
b5=str2double(b5);
b6=coeff_line3(C(2)+4:C(3)+3);
b6=str2double(b6);
b7=coeff_line3(C(3)+4:C(4)+3);
b7=str2double(b7);
molecule_name=char(sp);
mkdir(['D:fileparsemolecule', molecule_name]);
% solve for Cp, H, and s
M - linspace (temp1, temp2, 20);
T = int16(M(1:20));
R = 8.314;
k =1: length (T);
for j=1: length (k)
    if (k) <= 1000
    Cp = R*(b1 + (b2 * T(K)) + (b3*T (k).^2)+(b4*T (k).^3) + (65*T(k).^4));
    H= (R*T (k)).*( b1+(b2.*T(k)./2)+(b3. *T (k).^2 /3)+(b4.*T (k).^3/4) + (65.*T(k).^4/5)+ (b6 /T(k))) ;
    S=R*(b1.*log(double(T (k)) +(b2 .T (k)+(b3.*T(k).^2/2)+(b4.* T (K).^3/3) + (b5.*T (k).^4/4) +b7));
    else
    Cp = R* (a1+(a2* T(k))+(a3*T(k).^2)+(a4 *T(k).^3)+(a5* T(k). 4));
    H= (R* T (k)). *( a1+(a2*T(k))./ 2)+((a3*T(k).^2)./ 3) + (a4*T (k).^3./4) + ((a5*T(k).^4)./5) +(a6./T(k));
    S=R*(a1.*log(double(T(K))+double((a2 .*T(K))+(a3.*T(k).^2./2)+(a4.*T(k).^3./3) +(a5.*T(k).^4./4)+a7)));
    end
end
%plots
figure (1)
plot (M ,H,'-*');
title (molecule_name);
xlabel ('temperature')
ylabel (' enthalpy' )
figure (2)
plot (M, Cp, 'o')
title (molecule_name);
xlabel (' temperature )
ylabel (' specific heat ')
figure (3)
plot (M, S, '-')
title (molecule_name);
xlabel (' temperature )
ylabel (' entropy )
directory =(['D:fileparsemolecule', molecule_name]);
cd (directory );
saveas (1, 'Enthalpy.jpg');
% saving the plots in respective folder for each molecular species
 saveas (2, 'Specificheat .jpg');
 saveas (3,' Entropy.jpg' );
 cd ('D:fileparse' );
weight (i) = molecular_mass (molecule_name);
end
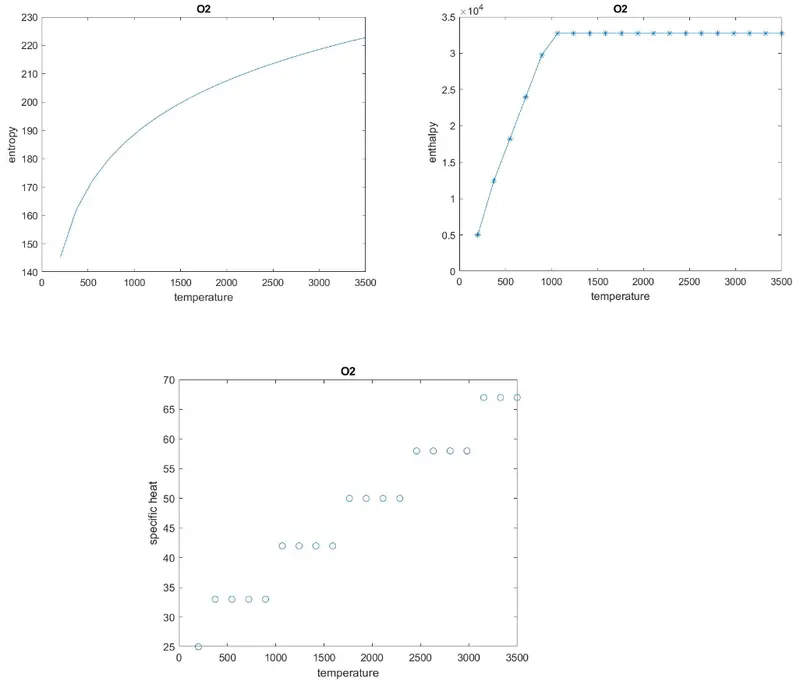
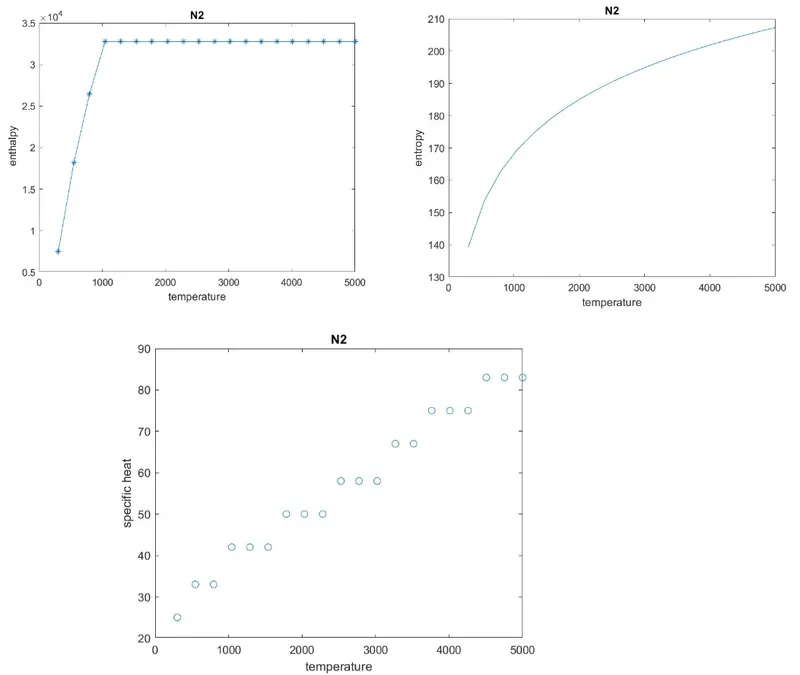
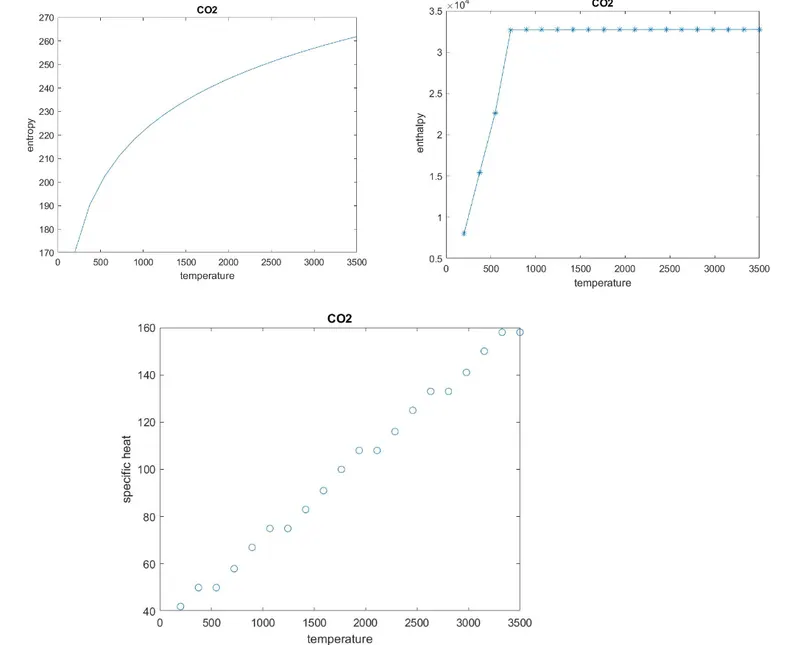
screen shots of results are attached,
O2
N2
CO2
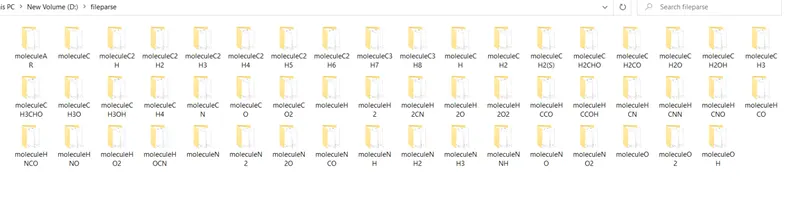
file created
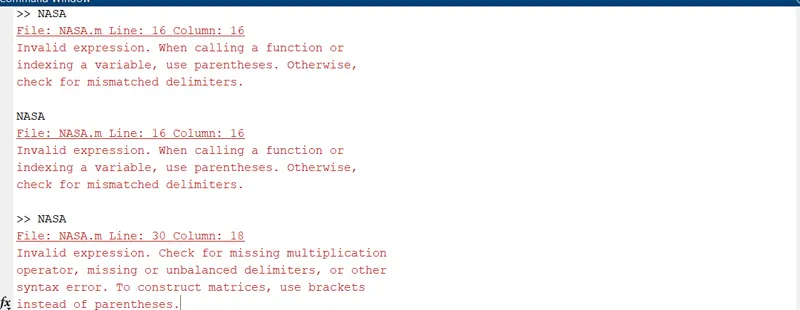
errors faced
all typo errors and paranthesis error, taking time and check clearly gives the code run properly,