Week 6 - Data analysis
Aim:
To write the code using python programm to manipulate the data within the file to perform the operations like mathametical evaluation, ploting the graphs, recogninzing the data and organizing the data as you desire.
Objective:
1. Data visualizer - to read the file and data manipulation
2. Compatability check - to recognize the assigned data file in the path folder
3. Calculate the area under the P-V diagram. P is in column 2 and V is in column 8. Calculate the power output of this engine. Assume that RPM is 1500. This engine consumed 20 micro grams of fuel (per 1 stroke cycle). Calculate its specific fuel consumption.
Body of the Objective:
Code procedure explanation:
1. All the important module have to be imported to analyse the data of scientifc, mathamatical equations or data.
2.The location of the file must be in path folder assigned.
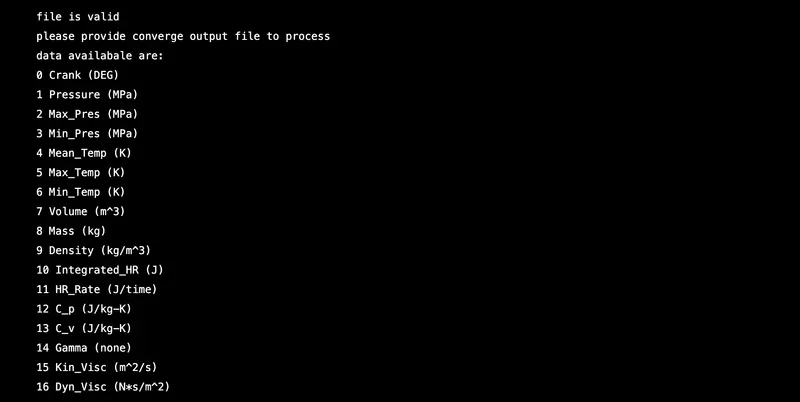
3. The file should be compatabile and the given code should be excuted for the type of the file. Then, a pop window can ask to enter the file name to check the compatability as shown in the figure in conclusions.
4.To manipulate the data in the file, the variables should be known. Using the indexing method the variables, values and units were assigned to data_visualize array
5. By calling the variables and using append method the values were gathered. Based on the inputs, the plots were analysed.
6. Based on the equation basic of power, area and specific fuel consumption the output was obtained.
#Import modules
import math
import matplotlib.pyplot as plt
import numpy as np
from numpy import trapz # to integrate the given axis using the composite trapezoidal rule

# By using input, a pop window will ask to enter the name of the file which can b assigned to varaible name called 'fname'
fname = input('Enter the filename')

#From the user input, the file path and folder can be verified if it is true
if fname == 'engine_data.out':
    print('file is valid')
else:
    print('file is invalid')
    exit()

# definig the function to check the compatability of the file
def compatability_check(a):

    if 'converge' not in a:
        print('please provide converge output file to process')
        exit()
    else:
        print('compatability check is successful')
        pass

#Assigning an empty array for saving the desired variables of output.
data_visualizer = []

for line in open(fname):
    if '#' in line:
        data_visualizer.append(line.split())

compatability_check(data_visualizer[0])

noc = len(data_visualizer[1]) # no.of columns, using the length () function means calling the entire column
head = len(data_visualizer[2]) # the values present in second row with variables
col_no = []# Assigning an empty array for columns
col_val = []# Assigning an empty array for variable values
col_units = [] # Assigning an empty array for units of respective values

#to represent the indexs and to read the data in the matrix
z = data_visualizer[1].index('column')
for i in range (z,noc-1):

    col_no.append(i)

for j in data_visualizer[2]:
    if j is not '#':
        col_val.append(j)

for k in data_visualizer[3]:

    if k is not '#':
        col_units.append(k)

print('data availabale are:')

for a in range(0,len(col_no)): # in python the indexing can be start from '0...n'

    print(a, col_val[a],col_units[a])

#To read the data in file and maniulation

line_count = 1 # considering the lines variable
crank = [] # Assigning the empty arrays
pressure = []
temperature = []
volume = []

#File parsing starts here
for line in open('engine_data.out'): # to read the content of line by line and saving the data called in 'line'
    if '#' not in line: # except the line contains '#' read the other data which is numerical only
        #Using append () function to add the data in an empty assigned array
        # Split commnand used to split the data and the result can be seen in an array
        # In python the minmum index stats with '0'
        # to convert the default numnerical value into a float, sometimes it might be a string
        crank.append(float(line.split()[0]))
        pressure.append(float(line.split()[1]))
        temperature.append(float(line.split()[4]))
        volume.append(float(line.split()[7]))

        line_count = line_count + 1 # Line count can be increase to keep tracking all the lines available in file

#print(crank) # to print the desired result
#to plot the results in graphical chart using matplotlib function
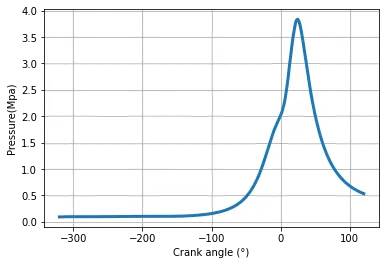
plt.figure(1)
plt.plot(crank,pressure, linewidth=3)
plt.xlabel('Crank angle (°)')
plt.ylabel('Pressure(Mpa)')
plt.grid()
plt.show()

#plotting P-V digram
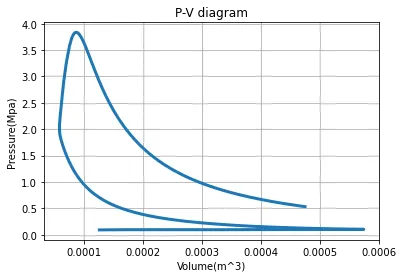
plt.figure(2)
plt.plot(volume, pressure, linewidth=3)
plt.title('P-V diagram')
plt.xlabel('Volume(m^3)')
plt.ylabel('Pressure(Mpa)')
plt.grid()
plt.show()


# Program to calculate the area under the P-V diagram
p = pow(10,6)*np.array(pressure)# units conversion
v = np.array(volume)
Area = np.trapz(p,v)
print('workdone area under P-V diagram =',Area,'Joules')

#calculating power
Power = (Area*2*math.pi*(1500/60))/1000
print('Power=',Power,'KW')

#Calculating specific fuel consumnption
SFC = 20 *pow(10,-6)*3600/Power
print('Specific fuel Consumption=',SFC,'g/kw.h')
Conclusions:
Finding pathe of the file in the folder:

Data Visualzation and compatability check:
Plots for the crank angle Vs pressure and P-V diagram:
Calculations for the given parameters of power, area and specfic fuel consumption:
