Python Project- Data analysis
Data Analysis
Aim: To write a Python Program which reads the engine output parameter file and performs the required objectives
Data visualizer
- Your script should take column numbers as the input and plot the respective columns as separate images
- Each file should be saved by the name of the column
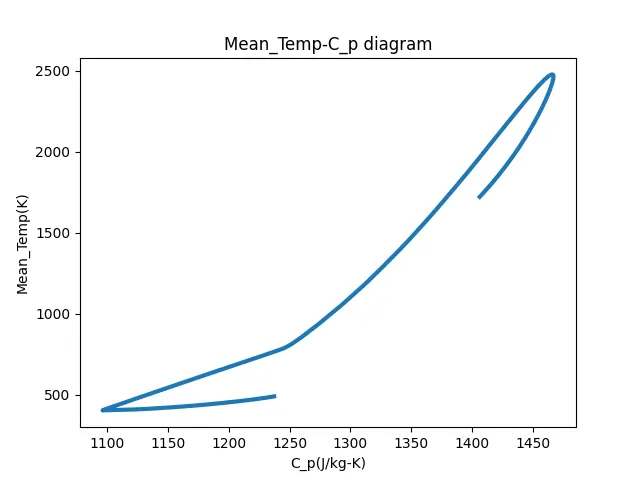
- The plot labels should be extracted from the file. If I request for a plot between column 1 (crank angle) and column 8(volume), then the label information should automatically be extracted and must appear as labels in the plots. THIS SHOULD NOT BE DONE MANUALLY
Compatibility check
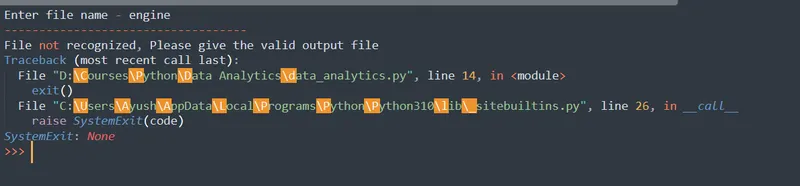
- Your code should exit gracefully if a non-compatible file is provided as an input. It should say something like "File not recognized. Please provide a valid CONVERGE output file"
Basic performance calculation
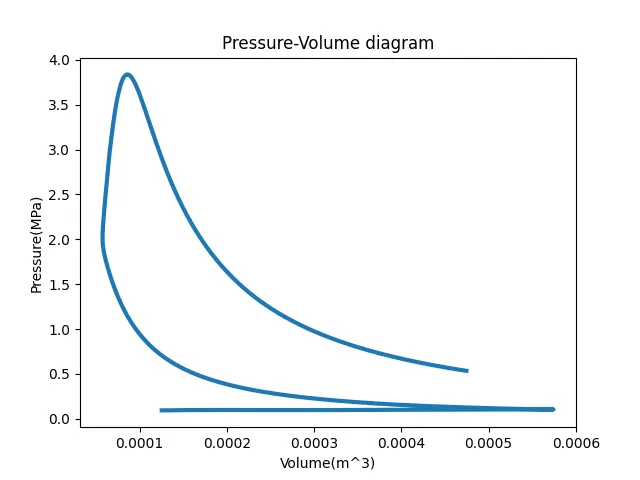
- Calculate the area under the P-V diagram. P is in column 2 and V is in column 8.
- Calculate the power output of this engine. Assume that RPM is 1500
- This engine consumed 20 micrograms of fuel (per 1 stroke cycle). Calculate its specific fuel consumption.
Procedure:
- By Using a python program the name of the data file is taken as an input from the user and checked whether the file is correct or not if the input file is given by the user then the program is terminated.
- Then, the file is opened and data is read line by line and stored.
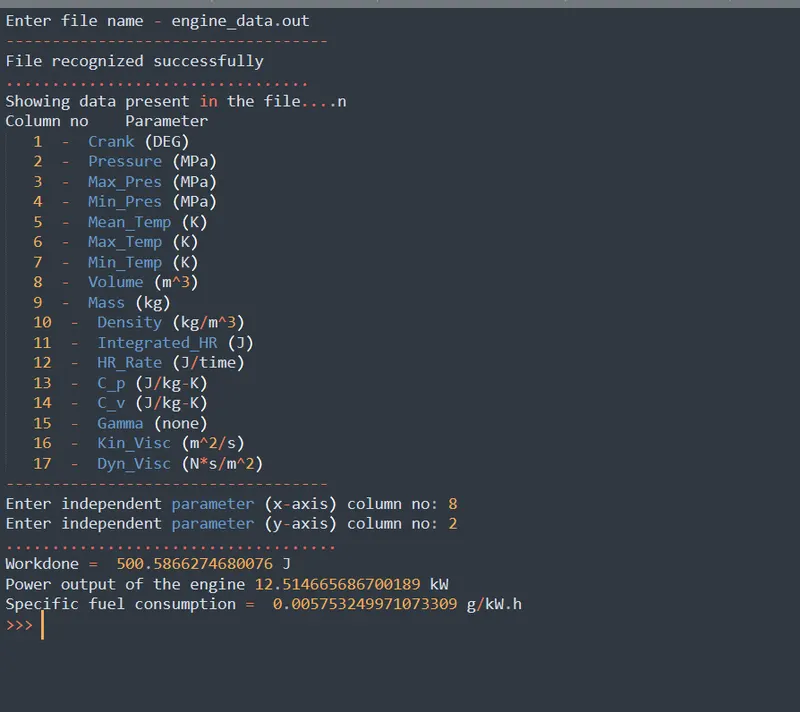
- Then we have to display the name of the parameters with units and their column number in the form of a table for the user to select the required columns and give the following input.
- Then the column number for the independent parameter x-axis and dependent parameter y-axis is taken from the user and the values according to the input given are extracted from the data file and plotted.
- Then we have to calculate the area under the PV diagram which gives the work done, and further, we have to calculate the power output of the engine and specific fuel consumption.
- Power = Work*Speed
- Specific fuel consumption = Mass of fuel consumption per hour/Power developed in kW
Code:
import math
import matplotlib.pyplot as plt
import numpy as np

#Taking inputs from user
file_name = input("Enter file name - ")
print('-----------------------------------')

#Checking the file
if file_name == 'engine_data.out':
	print("File recognized successfully")
else:
	print("File not recognized, Please give the valid output file")
	exit()
print('.................................')

data = []

for line in open(file_name):
	if '#' in line:
		data.append(line.split())

#No of columns
n_col = len(data[1])

#column numbers
cn = []

#column name
cv = []

#column units
cu = []

a = data[1].index('column')
for i in range(a,n_col-1):
	cn.append(i)

for i in data[2]:
	if i != '#':
		cv.append(i)

for i in data[3]:
	if i != '#':
		cu.append(i)

#Showing available data
print('Showing data present in the file....n')
print('Column no','  ','Parameter')

for i in range(0,len(cn)):
	print('  ',cn[i],' - ',cv[i],cu[i])

print('-----------------------------------')

#Taking user input fot plot
xaxis = int(input('Enter independent parameter (x-axis) column no: '))
yaxis = int(input('Enter independent parameter (y-axis) column no: '))

#reducing value by1 for program to pick correct value
xaxis = xaxis-1
yaxis = yaxis-1

print('....................................')

x = []
y = []

for line in open(file_name):
	if '#' not in line:
		x.append(float(line.split()[xaxis]))
		y.append(float(line.split()[yaxis]))

#Plotting
plt.plot(x,y,linewidth=3)
plt.xlabel(cv[xaxis]+cu[xaxis])
plt.ylabel(cv[yaxis]+cu[yaxis])
plt.title(cv[yaxis]+'-'+cv[xaxis]+' diagram')
plt.show()

#Basic performance calculation

pressure = []
volume = []

for line in open(file_name):
	if '#' not in line:
		pressure.append(float(line.split()[1]))
		volume.append(float(line.split()[7]))

P = 1000000*np.array(pressure) #coverting to pascal
V = np.array(volume)

#Calculating area under PV diagram
area=np.trapz(P,V)

print('Workdone = ',area,'J')

#Calculating Power
power = (area*(1500/60))/1000
print("Power output of the engine",power,'kW')

#Calculating Specific fuel consumption
sfc = 20*pow(10,-6)*3600/power
print('Specific fuel consumption = ',sfc, 'g/kW.h')
Explanation of the code:
- Initially, the required modules are imported.
- Then the filename is taken as input and checked whether the file name is correct or not by using the ‘if’ command.
- By using for loop every line is read line by line and lines with ‘#’ are appended to an array named ‘data’.
- Then the column number and column name are separated and stored in data (parameter name and unit of the parameter).
- By using a for loop the extracted column number and names are displayed for the user to select 2 columns to make a plot.
- Then the values of the column selected by the user are extracted and stored in an array and further plotted.
- For basic performance calculation, the values of pressure and volume are extracted using np.trapz(P, V) command and the area under the PV diagram are calculated.
- Converting the speed of 1500RPM into RPS the power output of the engine is calculated and further the specific fuel consumption of the engine is calculated.
Compatibility Test:
If the user gives wrong file name
Results:
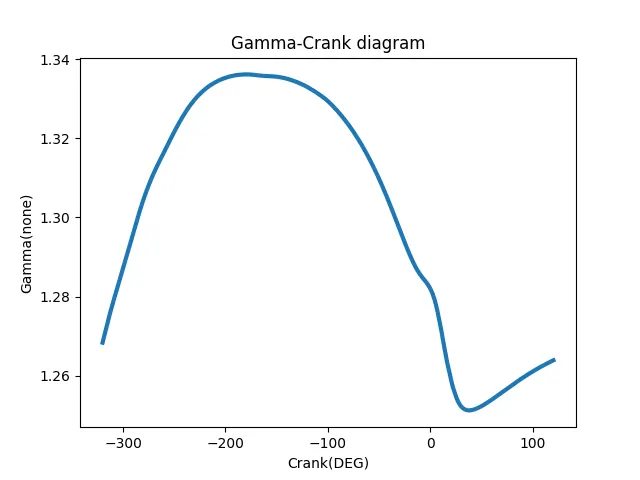
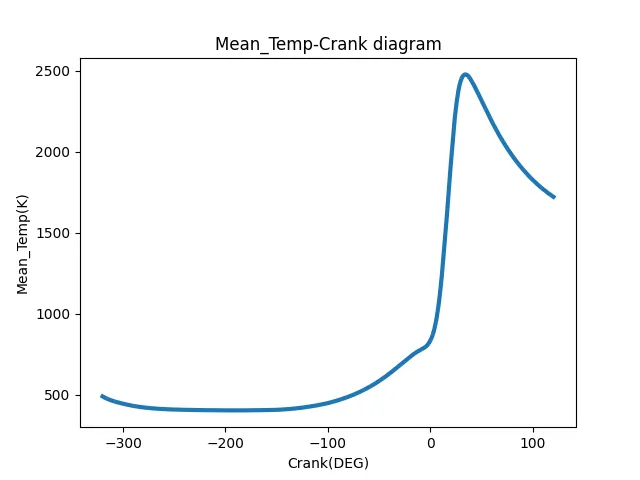
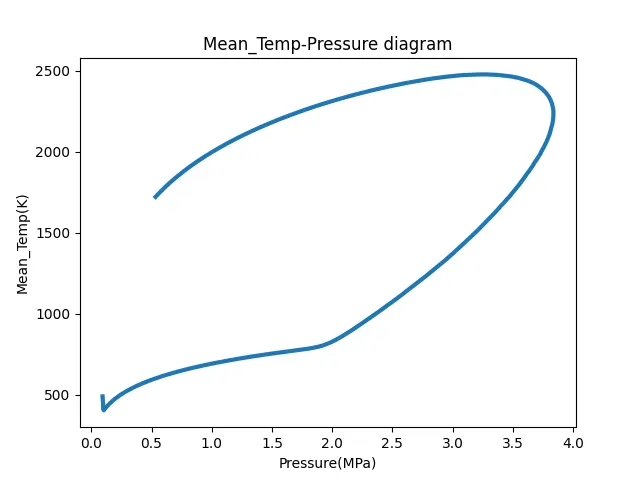
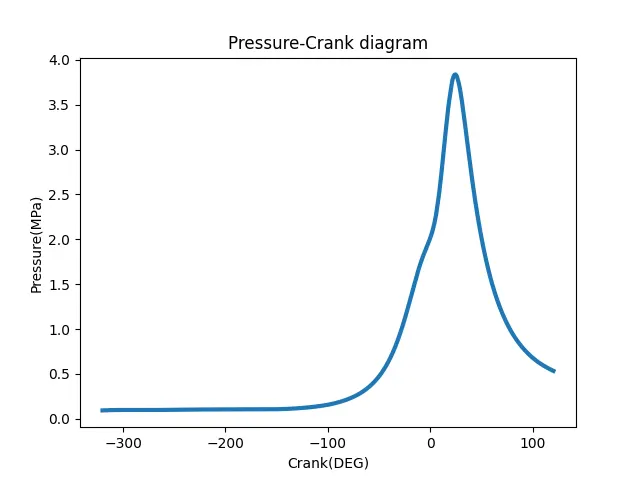
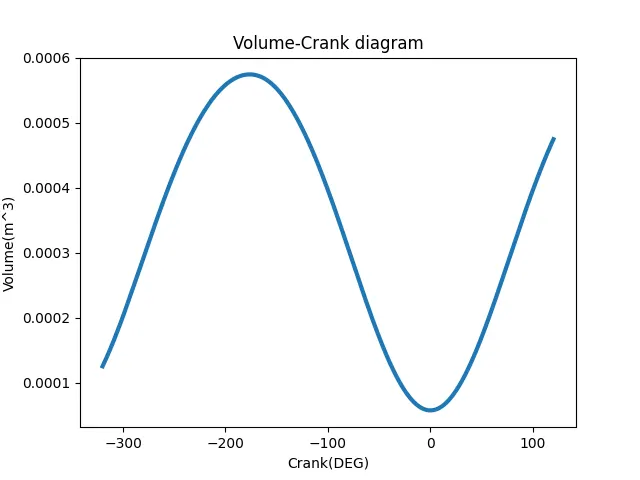
Conclusion:
The data of the engine file is read successfully and the plots were made according to user input.
Areas Under PV diagram(Workdone) = 500.5866274680076 J
Power output of the engine = 12.514665686700189 kW
Specific fuel consumption = 0.005753249971073309 g/kW.h