MATLAB: Project 1 - Parsing NASA thermodynamic data
Project-1
Parsing NASA Thermodynamic Data
Aim:
- Write a function that extracts the 14 coefficients and calculates the enthalpy, entropy, and specific heats for all the species in the data file.
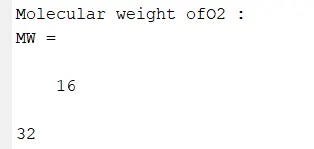
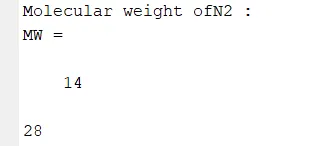
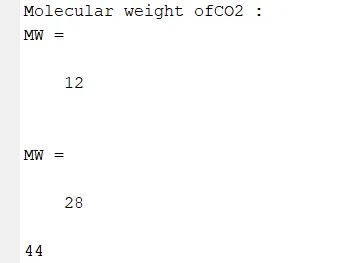
- Calculate the molecular weight of each species and display it in the command window.
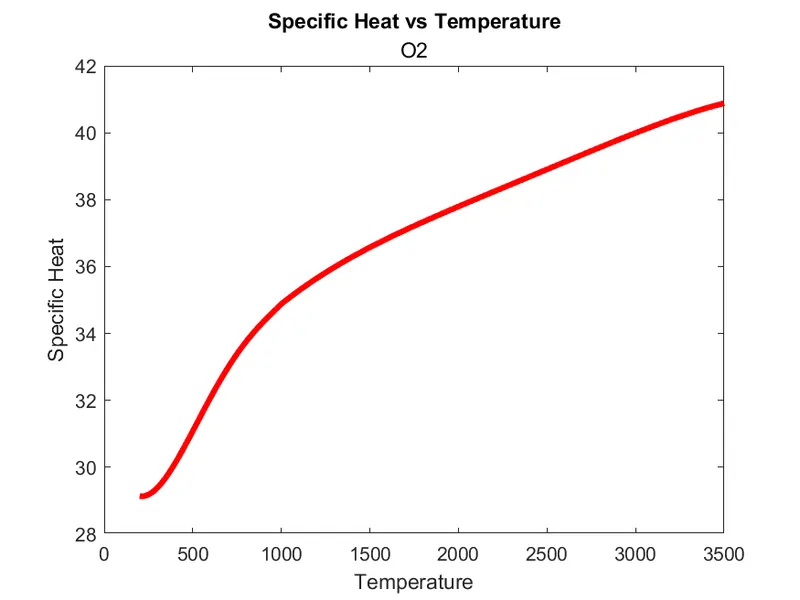
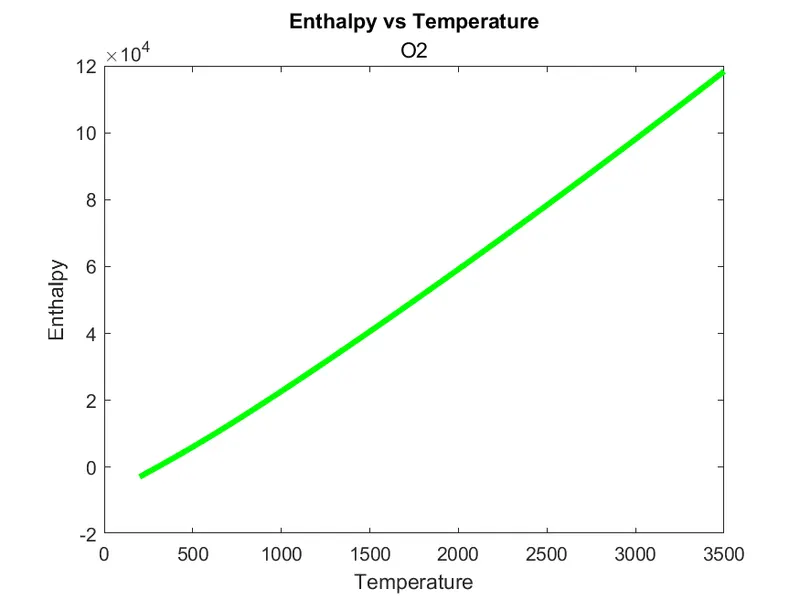
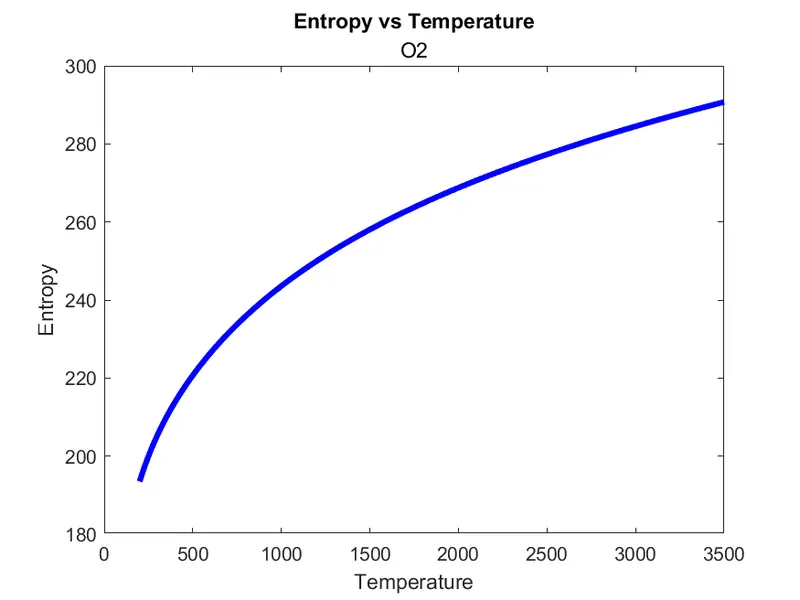
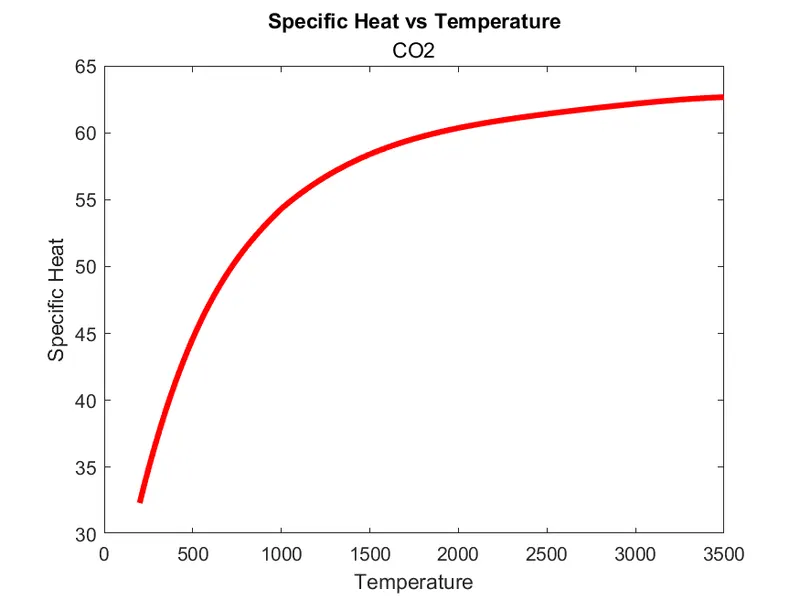
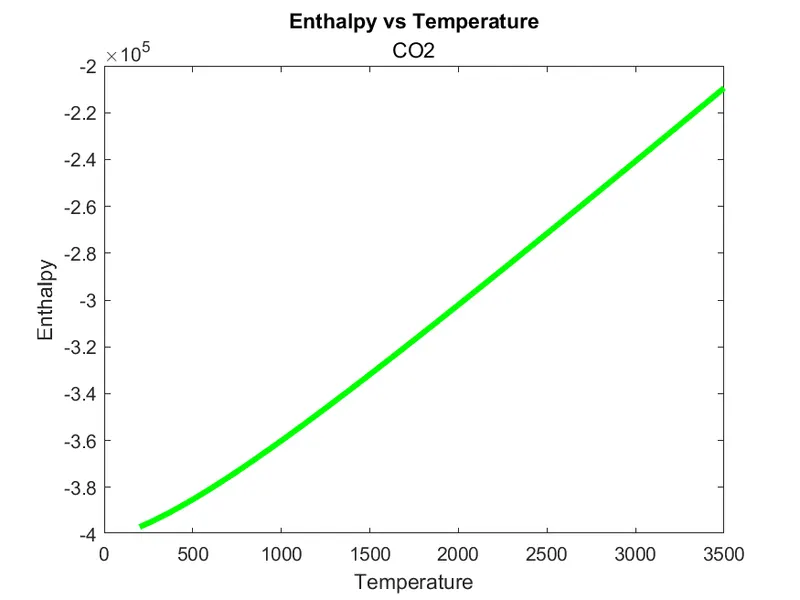
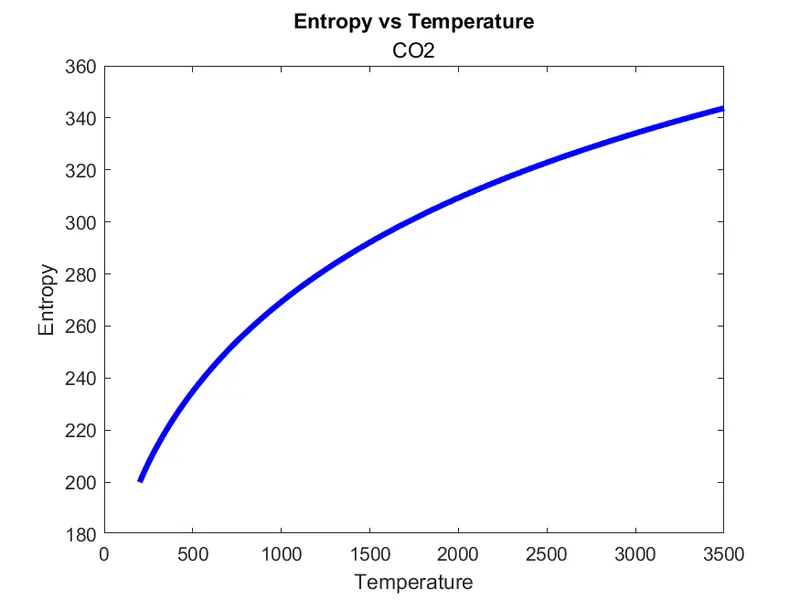
- Plot the Cp, Enthalpy, and Entropy for the local temperature range (low temperature: high temperature) specific for each species.
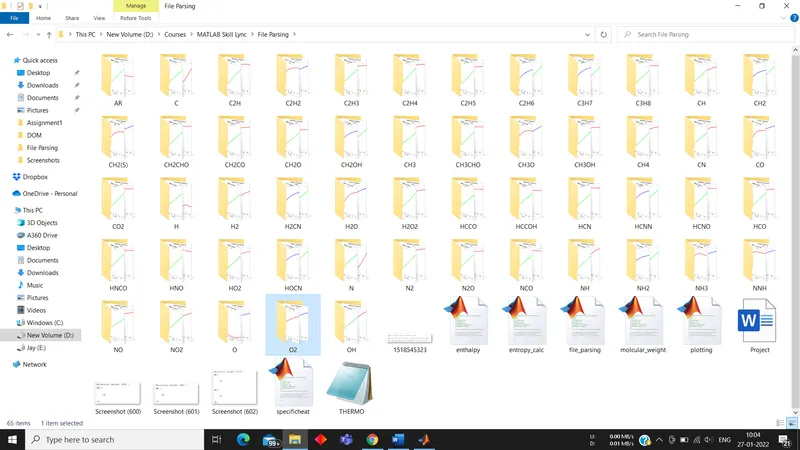
- Save the plots as images with appropriate names and dump them in separate folders for each species with a suitable name. All these should be generated automatically.
Theory:
Parsing means reading a file (in this case a MATLAB file(.m)) and translating it into an internal code that it stores in a memory. The file can be a script or a function.
NASA Thermodynamic file:
https://drive.google.com/file/d/1feu1eZhe5IL1f3AAjmejB6wEohgqSvsl/view?usp=sharing
This file contains the coefficients needed to evaluate the polynomial that can be used to finds the thermodynamic property such as Specific Heat(cp), Enthalpy(H), Entropy(S).
Formula used:

R is the universal gas constant and T is the Temperature
Main code:
clear all
close all
clc

f1 = fopen('THERMO.dat','r');

for i=1:5
    fgetl(f1);
end


R = 8.314;


%Getting the cofficients
for i=1:53
    tline1=fgetl(f1);
    splitting = strsplit(tline1,' ');
    species = (splitting{1});
    finding_dot=strfind(tline1,'.');
    low_local_temp= str2num(tline1(finding_dot(1)-3:finding_dot(1)));
    high_local_temp= str2num(tline1(finding_dot(2)-4:finding_dot(2)));
    mid_local_temp= str2num(tline1(finding_dot(3)-4:finding_dot(3)));

    T = linspace(low_local_temp,high_local_temp,500);


 tline2 = fgetl(f1);
 name = strtok(tline1);

 %Extracting higher and lower temp coff
 tline3 = fgetl(f1);
 tline4 = fgetl(f1);

    A = strfind(tline2,'E');
    B = strfind(tline3,'E');
    C = strfind(tline4,'E');

    %Exteacting higher temp coff
    a1 = str2num(tline2(1:A(1)+3));
    a2 = str2num(tline2(A(1)+4:A(2)+3));
    a3 = str2num(tline2(A(2)+4:A(3)+3));
    a4 = str2num(tline2(A(3)+4:A(4)+3));
    a5 = str2num(tline2(A(4)+4:A(5)+3));
    a6 = str2num(tline3(1:B(1)+3));
    a7 = str2num(tline3(B(1)+4:B(2)+3));

    %Extracting higher coffi
    b1 = str2num(tline3(B(2)+4:B(3)+3));
    b2 = str2num(tline3(B(3)+4:B(4)+3));
    b3 = str2num(tline3(B(4)+4:B(5)+3));
    b4 = str2num(tline4(1:C(1)+3));   %from tline3 to tline4 in line 54 till 57
    b5 = str2num(tline4(C(1)+4:C(2)+3));
    b6 = str2num(tline4(C(2)+4:C(3)+3));
    b7 = str2num(tline4(C(3)+4:C(4)+3));

  %Specific heat calcularion

  for j=1:length(T)
      cp(j) = specificheat(a1,a2,a3,a4,a5,b1,b2,b3,b4,b5,T(j),R,mid_local_temp);

      h(j) = enthalpy(a1,a2,a3,a4,a5,a6,b1,b2,b3,b4,b5,b6,T(j),R,mid_local_temp);

      s(j) = entropy_calc(a1,a2,a3,a4,a5,a7,b1,b2,b3,b4,b5,b7,T(j),R,mid_local_temp);
  end

  Molecular_W(i) = molcular_weight(name);

  plotting(cp,h,s,T,name)

end
%Calculation of enthalpy
function h=enthalpy(a1,a2,a3,a4,a5,a6,b1,b2,b3,b4,b5,b6,T,R,mid_local_temp)
if T>=mid_local_temp
h = R*(a1*T+(a2*(T^2))/2+(a3*(T^3)/3)+(a4*(T^4)/4)+(a5*(T^5)/5)+a6);
else
h = R*(b1*T+(b2*(T^2))/2+(b3*(T^3)/3)+(b4*(T^4)/4)+(b5*(T^5)/5)+b6);
end
end
%Calculation of entropy
function s=entropy_calc(a1,a2,a3,a4,a5,a7,b1,b2,b3,b4,b5,b7,T,R,mid_local_temp)
if T>=mid_local_temp
    s = R*(a1*log(T)+(a2*T)+(a3*(T^2)/2)+(a4*(T^3)/3)+(a5*(T^4)/4)+a7); %changed here
else
    s = R*(b1*log(T)+b2*T+(b3*(T^2)/2)+(b4*(T^3)/3)+(b5*(T^4)/4)+b7);
end
end
%Calculation of specific heat
function cp = specificheat(a1,a2,a3,a4,a5,b1,b2,b3,b4,b5,T,R,local_mid_temp)
if T>=local_mid_temp
cp = R*(a1+a2*T+a3*(T^2)+a4*(T^3)+a5*(T^4));
else
cp = R*(b1+b2*T+b3*(T^2)+b4*(T^3)+b5*(T^4));
end
end%Function to calulate molecular weight
function MW = molcular_weight(name)
atoms = ['H','C','O','N','R'];
fprintf('Molecular weight of');
fprintf(name);
fprintf(' : ');
atomic_weight = [1 12 16 14 40];
MW =0;
for i=1:length(name)
for j=1:length(atoms)
if strcmp(name(i),atoms(j))
MW = MW + atomic_weight(j)
position=j;
end
end
n = str2num(name(i));
if n>1
MW = MW + atomic_weight(position)*(n-1);
end
end
fprintf('%d',MW);
disp(' ');
end%Plotting
function plotting(cp,h,s,T,name)
cd(pwd)
dir_name = name;
mkdir(dir_name);
figure(1)
plot(T,cp,'LineWidth',3,'Color','r')
title('Specific Heat vs Temperature',name)
xlabel('Temperature')
ylabel('Specific Heat')
figure(2)
plot(T,h,'LineWidth',3,'Color','g')
title('Enthalpy vs Temperature',name)
xlabel('Temperature')
ylabel('Enthalpy')
figure(3)
plot(T,s,'LineWidth',3,'Color','b')
title('Entropy vs Temperature',name)
xlabel('Temperature')
ylabel('Entropy')
cd(dir_name)
saveas(1,'cp_vs_t.png')
saveas(2,'h_vs_t.png')
saveas(3,'s_vs_t.png')
cd ..
endCode Explanation:
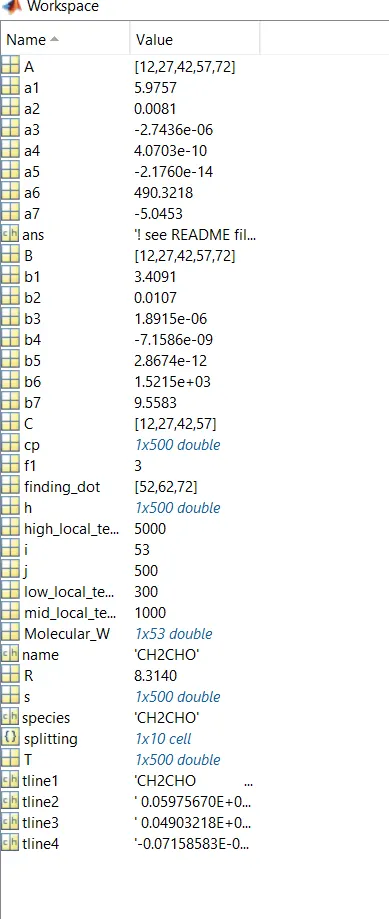
- Initially, we have to read the given file by using fopen command with the reading function. Then the successive 5 lines are extracted for temperature range using fgetl command.
- Now, for finding low, mid, and high temperatures we have to split the line1 and we can firstly split the line on the basis of ‘space’, but still, we didn’t get the desired value.
- Now we will locate the ‘dot’ in line1 and then corresponding the subtracting the number of strings to the left of the location of dot we can get the first string of the desired value.
- Now by using the range operator, we can find the complete string we want and the using ‘str2num’ command we can convert string to a number.
- Defining the temperature and the number of values we want by using ‘linspace’ command.
- Now, for extracting the coefficients we can repeat the process followed in point3 and point4 but this time instead of locating the position of dot we’ll locate the position of ‘E’.
- We can apply for loop to extract the coefficients of all 53 species instead of finding them individually.
- The temperature value from the T array is used one by one in a for loop and the cp, s, h values at each temperature is calculated based on a given condition.
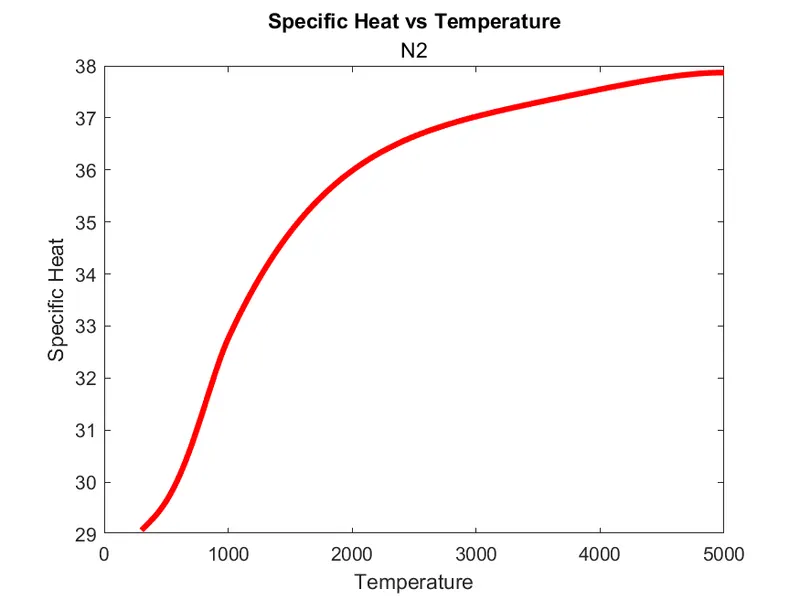
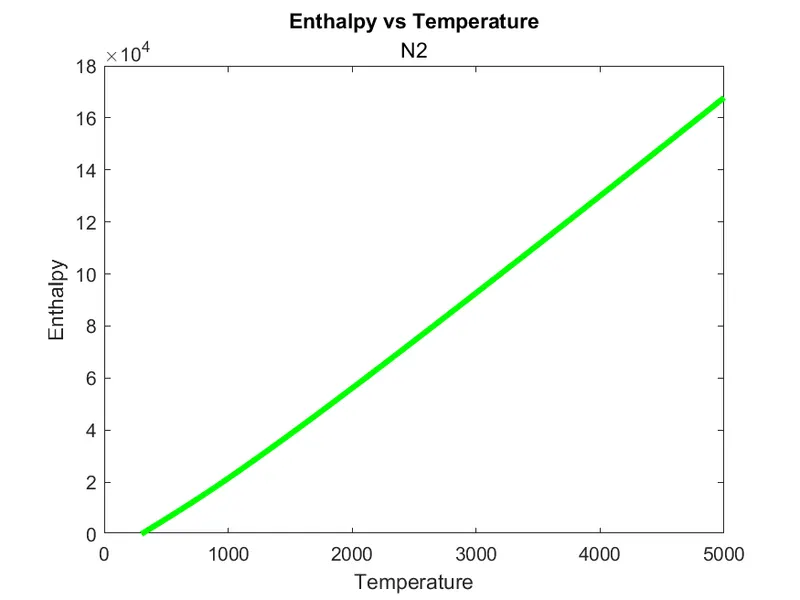
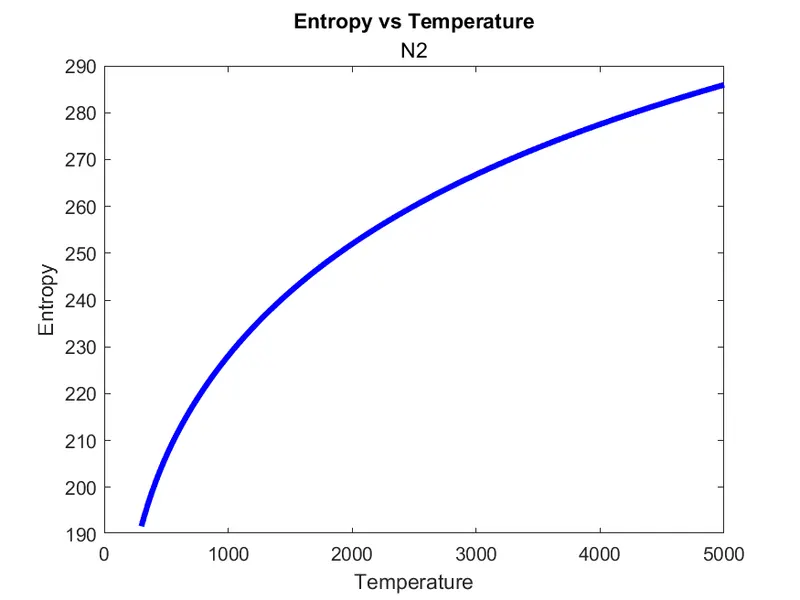
- Then the graphs are plotted specific heat vs temperature entropy vs temperature enthalpy vs temperature
- Mkdir command is used to create the new folders based on the species name and the ‘cd’ and ‘saveas’ commands are used to store the plots in the respective folders.
Output:
Plot – O2
Plot – N2
Plot – CO2
Conclusion:
- The coefficients were extracted from the file.
- The molecular weight was calculated for all the species.
- The graphs are plotted and saved in their respective folders.