Week 6 - Data analysis
Course: Python for Mechanical Engineers
Challenge: Data Analysis
Submitted By: Amanpreet Singh Whan
1 Aim:
The aim of the week 6 challenge is to write a program to perform data analysis or parsing of the given Converge engine file using Python software.
2 Theory and Governing Equations:
Data analysis is a process of inspecting, cleansing, transforming, and modeling data with the goal of discovering useful information, informing conclusions, and supporting decision-making. Data analysis has multiple facets and approaches, encompassing diverse techniques under a variety of names, and is used in different business, science, and social science domains. In today's business world, data analysis plays a role in making decisions more scientific and helping businesses operate more effectively.
Process of Data Analysis:
Analysis refers to dividing a whole into its separate components for individual examination. Data analysis is a process for obtaining raw data and subsequently converting it into information useful for decision-making by users. Data is collected and analyzed to answer questions, test hypotheses, or disprove theories
Statistician John Tukey, defined data analysis in 1961, as:
Procedures for analyzing data, techniques for interpreting the results of such procedures, ways of planning the gathering of data to make its analysis easier, more precise, or more accurate, and all the machinery and results of (mathematical) statistics which apply to analyzing data.
There are several phases that can be distinguished, described below.
Data Requirements – Data Collection – Data Processing – Data Cleaning – Exploratory Data Analysis
Since the challenge also demands the calculation of area under the PV diagram(work), Power Output, and SFC (Specific Fuel Consumption), the following are the formulas or equations that were used to determine the values of Work, Power, and SFC of the engine.
1) Trapezoidal Rule: The trapezoidal rule is used t calculate the area under the PV diagram.
2) Power Output = n *area * stroke cycle / 1000, the formula to calculate engine output.
3) SFC = Fuel consumption *10 e-6* stroke cycle *3600 / (Power Output/1000)
3 Objectives:
The objectives of the week 6 challenges are as follows:
- Write a program that can perform data analysis of the given Converge Engine file and plot the graphs as per the user requirements.
- Also, it can calculate the values of the Area under the PV diagram, Power Output, and SFC of the engine.
- Lastly, the code should perform a compatibility check by throwing an error if the non-compatible file is provided as an input.
4 Body of the Content:
Python is an interpreted, object-oriented, high-level programming language with dynamic semantics. Its high-level built-in data structures, combined with dynamic typing and dynamic binding, make it very attractive for Rapid Application Development and use as a scripting or glue language to connect existing components. Python's simple, easy-to-learn syntax emphasizes readability and therefore reduces the cost of program maintenance. Python supports modules and packages, which encourages program modularity and code reuse.
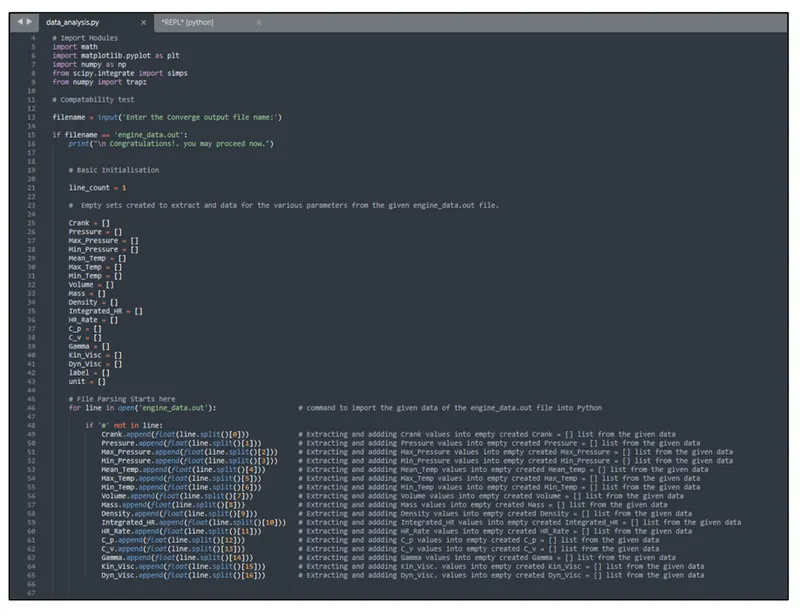
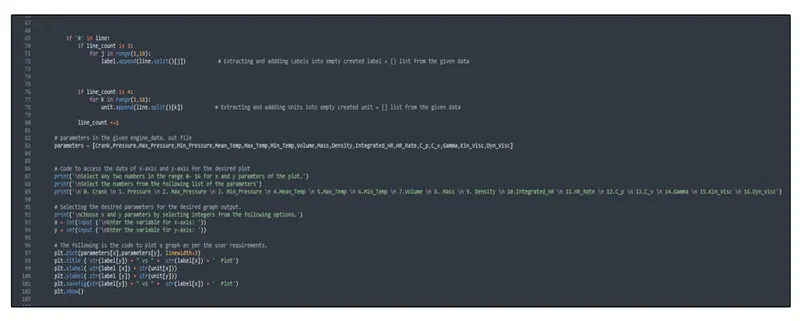
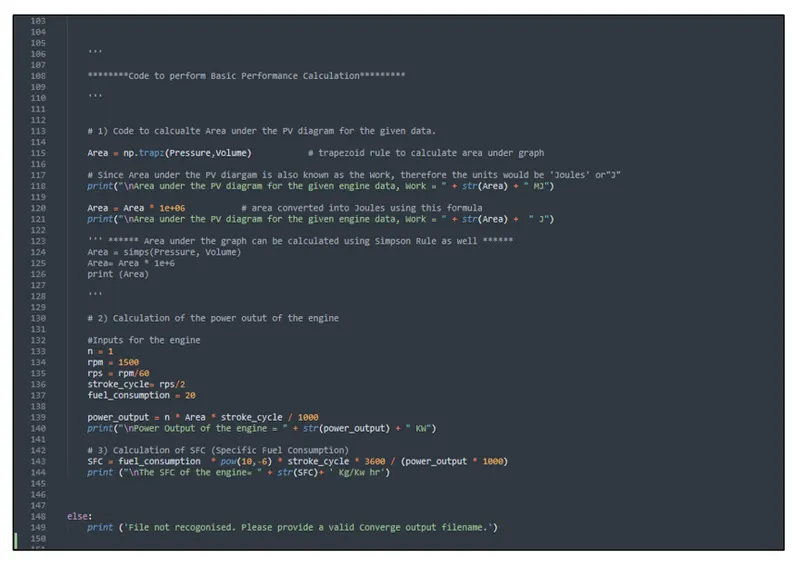
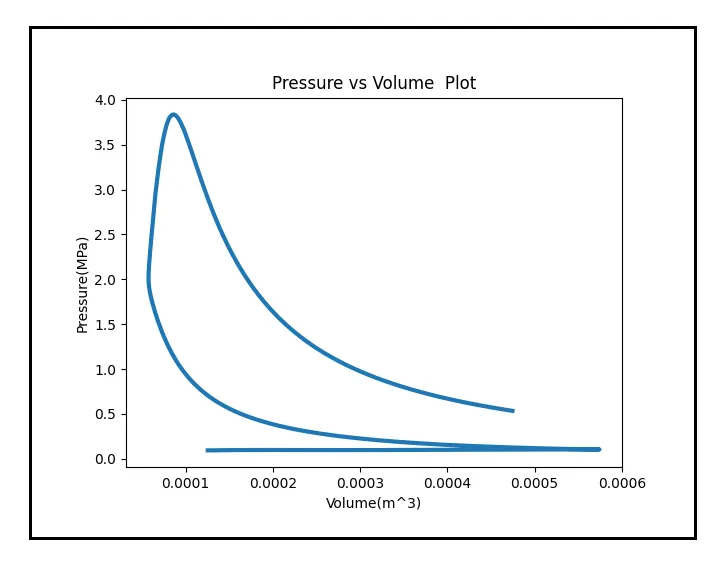
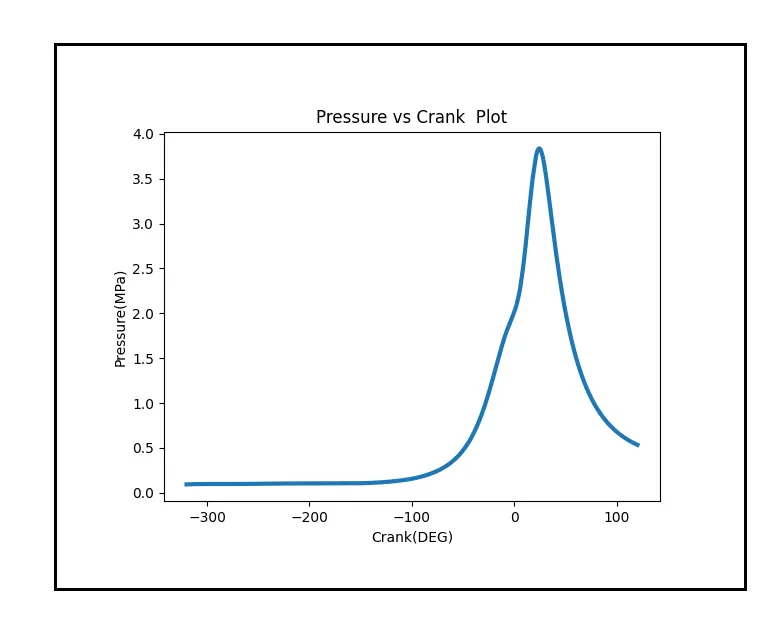
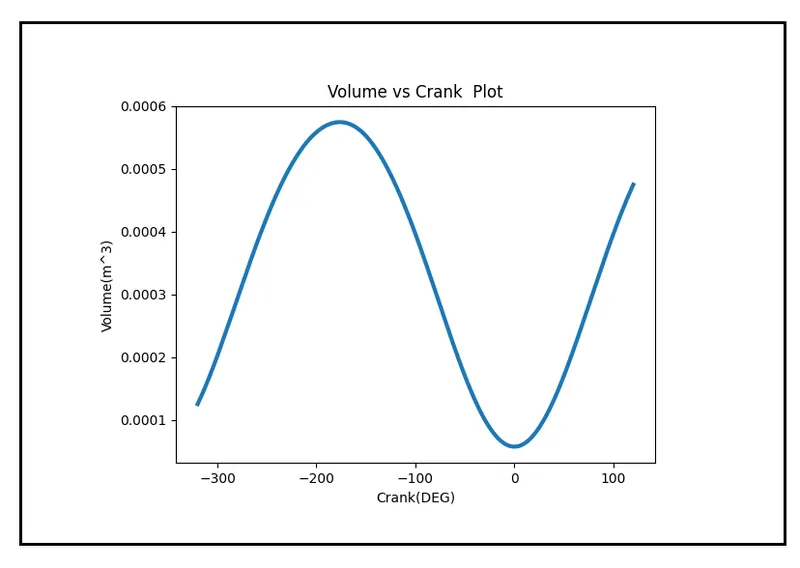
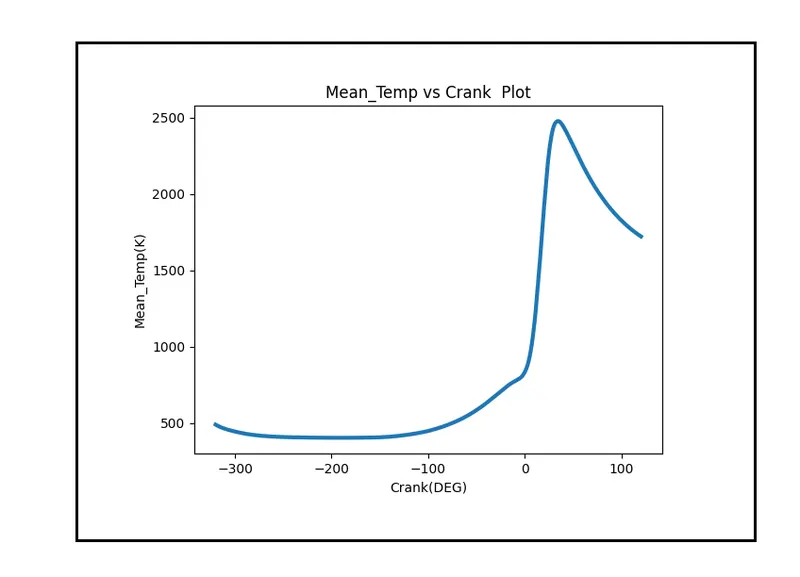
The python code was written to fulfill the requirements of the Week 6 challenge and is attached in the following figures. In addition, the plots obtained from the written code are attached as well.
Python Program
The Graphs were plotted using Python Program
Outputs from the Sublime REPL Window:
5 Conclusion:
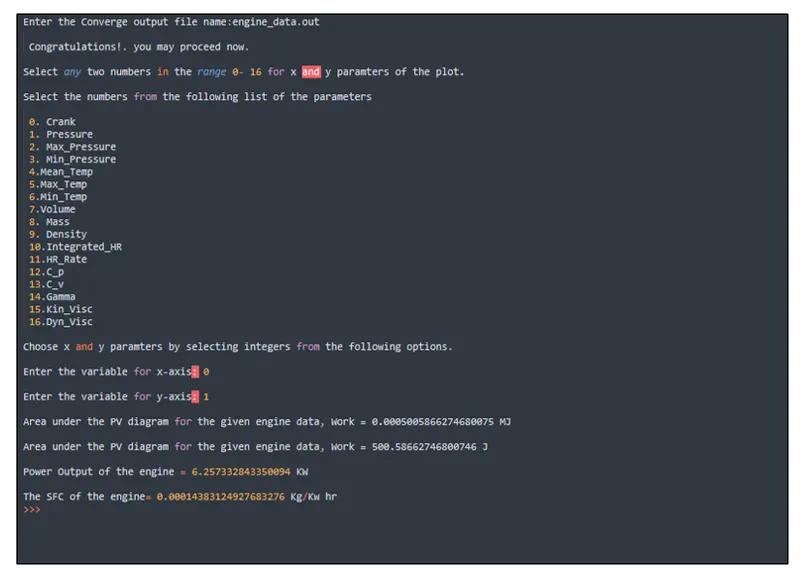
In conclusion, the main aim of the week 6 challenge is to write a python program that can perform data analysis of the given Converge Engine file and plot the graphs as per the user requirements. Also, it can calculate the values of the Area under the PV diagram, Power Output, and SFC of the engine.
From the results, it was found that
The Area under the PV diagram (Work) = 500.5866 Joules
Power Output of the Engine = 6.257 KW
Specific Fuel Consumption, SFC = 0.000144 Kg/KW.hr
6 Appendix:
''' Data Analysis Challenge'''
''' Demonstrating File Parsing in Python'''

# Import Modules
import math
import matplotlib.pyplot as plt
import numpy as np
from scipy.integrate import simps
from numpy import trapz

# Compatability test

filename = input('Enter the Converge output file name:')

if filename == 'engine_data.out':
	print("\n Congratulations!. you may proceed now.")


	# Basic Initialisation

	line_count = 1

	#  Empty sets created to extract and data for the various parameters from the given engine_data.out file.

	Crank = []
	Pressure = []
	Max_Pressure = []
	Min_Pressure = []
	Mean_Temp = []
	Max_Temp = []
	Min_Temp = []
	Volume = []
	Mass = []
	Density = []
	Integrated_HR = []
	HR_Rate = []
	C_p = []
	C_v = []
	Gamma = []
	Kin_Visc = []
	Dyn_Visc = []
	label = []
	unit = []

	# File Parsing Starts here
	for line in open('engine_data.out'):                    # command to import the given data of the engine_data.out file into Python

		if '#' not in line:
			Crank.append(float(line.split()[0]))            # Extracting and addding Crank values into empty created Crank = [] list from the given data
			Pressure.append(float(line.split()[1]))         # Extracting and addding Pressure values into empty created Pressure = [] list from the given data
			Max_Pressure.append(float(line.split()[2]))     # Extracting and addding Max_Pressure values into empty created Max_Pressure = [] list from the given data
			Min_Pressure.append(float(line.split()[3]))     # Extracting and addding Min_Pressure values into empty created Min_Pressure = [] list from the given data
			Mean_Temp.append(float(line.split()[4]))        # Extracting and addding Mean_Temp values into empty created Mean_temp = [] list from the given data
			Max_Temp.append(float(line.split()[5]))         # Extracting and addding Max_Temp values into empty created Max_Temp = [] list from the given data
			Min_Temp.append(float(line.split()[6]))         # Extracting and addding Min_Temp values into empty created Min_Temp = [] list from the given data
			Volume.append(float(line.split()[7]))           # Extracting and addding Volume values into empty created Volume = [] list from the given data
			Mass.append(float(line.split()[8]))             # Extracting and addding Mass values into empty created Mass = [] list from the given data
			Density.append(float(line.split()[9]))          # Extracting and addding Density values into empty created Density = [] list from the given data
			Integrated_HR.append(float(line.split()[10]))   # Extracting and addding Integrated_HR values into empty created Integrated_HR = [] list from the given data
			HR_Rate.append(float(line.split()[11]))         # Extracting and addding HR_Rate values into empty created HR_Rate = [] list from the given data
			C_p.append(float(line.split()[12]))             # Extracting and addding C_p values into empty created C_p = [] list from the given data
			C_v.append(float(line.split()[13]))             # Extracting and addding C_v values into empty created C_v = [] list from the given data
			Gamma.append(float(line.split()[14]))           # Extracting and addding Gamma values into empty created Gamma = [] list from the given data
			Kin_Visc.append(float(line.split()[15]))        # Extracting and addding Kin_Visc. values into empty created Kin_Visc = [] list from the given data
			Dyn_Visc.append(float(line.split()[16]))        # Extracting and addding Dyn_Visc. values into empty created Dyn_Visc = [] list from the given data


		if '#' in line:
			if line_count is 3:
				for j in range(1,18):
					label.append(line.split()[j])           # Extracting and addding Labels into empty created label = [] list from the given data


			if line_count is 4:
				for k in range(1,18):
					unit.append(line.split()[k])           # Extracting and addding Units into empty created unit = [] list from the given data

			line_count +=1

	# parameters in the given engine_data. out file
	parameters = [Crank,Pressure,Max_Pressure,Min_Pressure,Mean_Temp,Max_Temp,Min_Temp,Volume,Mass,Density,Integrated_HR,HR_Rate,C_p,C_v,Gamma,Kin_Visc,Dyn_Visc]


	# Code to access the data of x-axis and y-axis for the desired plot
	print('\nSelect any two numbers in the range 0- 16 for x and y paramters of the plot.')
	print('\nSelect the numbers from the following list of the parameters')
	print('\n 0. Crank \n 1. Pressure \n 2. Max_Pressure \n 3. Min_Pressure \n 4.Mean_Temp \n 5.Max_Temp \n 6.Min_Temp \n 7.Volume \n 8. Mass \n 9. Density \n 10.Integrated_HR \n 11.HR_Rate \n 12.C_p \n 13.C_v \n 14.Gamma \n 15.Kin_Visc \n 16.Dyn_Visc')

	# Selecting the desired parameters for the desired graph output.
	print('\nChoose x and y paramters by selecting integers from the following options.')
	x = int(input ('\nEnter the variable for x-axis: '))
	y = int(input ('\nEnter the variable for y-axis: '))

	# The following is the code to plot a graph as per the user requirements.
	plt.plot(parameters[x],parameters[y], linewidth=3)
	plt.title ( str(label[y]) + " vs " +  str(label[x]) + '  Plot')
	plt.xlabel( str(label [x]) + str(unit[x]))
	plt.ylabel( str(label [y]) + str(unit[y]))
	plt.savefig(str(label[y]) + " vs " +  str(label[x]) + '  Plot')
	plt.show()


	'''

	********Code to perform Basic Performance Calculation*********

	'''


	# 1) Code to calcualte Area under the PV diagram for the given data.

	Area = np.trapz(Pressure,Volume)           # trapezoid rule to calculate area under graph

	# Since Area under the PV diargam is also known as the Work, therefore the units would be 'Joules' or"J"
	print("\nArea under the PV diagram for the given engine data, Work = " + str(Area) + " MJ")

	Area = Area * 1e+06           # area converted into Joules using this formula
	print("\nArea under the PV diagram for the given engine data, Work = " + str(Area) +  " J")

	''' ****** Area under the graph can be calculated using Simpson Rule as well ******
	Area = simps(Pressure, Volume)
	Area= Area * 1e+6
	print (Area)

	'''

	# 2) Calculation of the power outut of the engine

	#Inputs for the engine
	n = 1
	rpm = 1500
	rps = rpm/60
	stroke_cycle= rps/2
	fuel_consumption = 20

	power_output = n * Area * stroke_cycle / 1000
	print("\nPower Output of the engine = " + str(power_output) + " KW")

	# 3) Calculation of SFC (Specific Fuel Consumption)
	SFC = fuel_consumption  * pow(10,-6) * stroke_cycle * 3600 / (power_output * 1000)
	print ("\nThe SFC of the engine= " + str(SFC)+ ' Kg/Kw hr')


else:
	print ('File not recogonised. Please provide a valid Converge output filename.')