Week 6 - Data analysis
DATA ANALYSIS USING PYTHON
Data analysis is done to perform collecting data, cleaning data, analysing data, visualizing data to get requried information
OBJECTIVES
Data visualizer
- Your script should take column numbers as the input and plot the respective columns as separate images
- Each file should be saved by the name of the column
- The plot labels should be extracted from the file. If, I request for a plot between column 1 (crank angle) and column 8(volume), then the label information should automatically be extracted and must appear as labels in the plots. THIS SHOULD NOT BE DONE MANUALLY
Compatability check
- You code should exit gracefully, if a non-compatible file is provided as an input. It should say something like "File not recognized. Please provide a valid CONVERGE output file"
Basic performance calculation (50 points)
- Calculate the area under the P-V diagram. P is in column 2 and V is in column 8.
- Calculate the power output of this engine. Assume that RPM is 1500
- This engine consumed 20 micro grams of fuel (per 1 stroke cycle). Calculate its specific fuel consumption.
Program explination
- Compatibility check: This is to check the input of the specified converge file is correct or not, if it is correct program will run otherwise program will thorw a error
- Data visualizer: It will read the file, exracts the requried parameter name and units, extracts parameter values, stores those values and plots the graphs between the parameters
- Import all the requried modules for calculations like math, matplotlib, and numpy
- Then try find the opend file is good to perform operations or not
- Write a code to extract each column as a saparate data to perform requried task
- initially when we made a split each rows are taken as a different line data
- After adding transpose it turned to each columns
- By giving required column numbes plot the graph
- After that using formulas calculate the required resuts as per objectives
import math
import matplotlib.pyplot as plt
import numpy as np

try:
	file_content = open('engine_data.out','r')

except FileNotFoundError:
	print('File not recognized / not found, please provide a valid converge output file ')

Data = []
for line in file_content:
	if '#' not in line:
		Data.append(line.split())


Data_column = np.transpose(Data)
Data_column = Data_column.astype(float)


plt.plot(Data_column[0,:],Data_column[1,:], linewidth = 3, color = 'blue')
plt.xlabel('Crank(DEG)', color = 'red')
plt.ylabel('Pressure(MPA)', color = 'red')
plt.title('pressure_vs_Crank')
plt.savefig('column_0_vs_column_1' + '.png')
plt.show()

plt.plot(Data_column[0,:],Data_column[7,:], linewidth = 3, color = 'blue')
plt.xlabel('Crank(DEG)', color = 'red')
plt.ylabel('Volume(m^3)', color = 'red')
plt.title('Volume_vs_Crank')
plt.savefig('column_0_vs_column_7'+'.png')
plt.show()

plt.plot(Data_column[7,:],Data_column[1,:], linewidth = 3, color = 'blue')
plt.xlabel('Volume(m^3)', color = 'red')
plt.ylabel('Pressure(MPA)', color = 'red')
plt.title('Pressure_vs_Volume')
plt.savefig('column_7_vs_column_1'+'.png')
plt.show()

#Calculating the area under the P-V diagram in 'pa'

Area = (np.trapz(Data_column[1,:]*(10**6),Data_column[7,:]))/1000
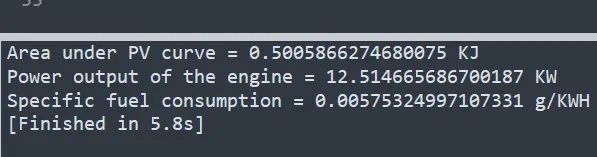
print("Area under PV curve =",Area, 'KJ')

#Calulating the power output of the engine
Power = Area*(1500/60)
print("Power output of the engine =", Power, 'KW' )

#Calculating specific fuel consumption(SFC)
SFC = (20*(10**-6)*3600)/Power
print("Specific fuel consumption =", SFC, 'g/KWH')
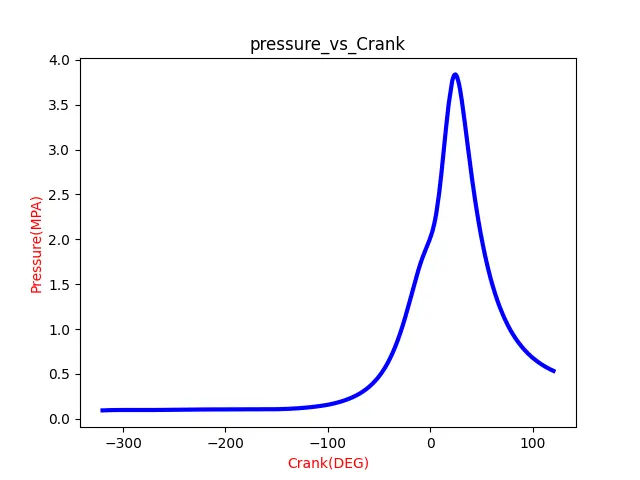
- The first graph is between crank vs pressure i.e crank data is present in the column 0 and the pressure data is present in the column 1 the graph shown below
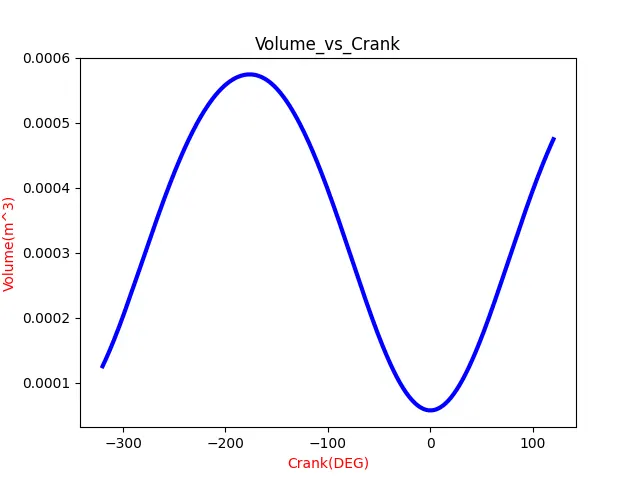
- The second graph is between crank vs volume i.e crank data is present in the column 0 and the volume data is present in the column 7 the graph shown below
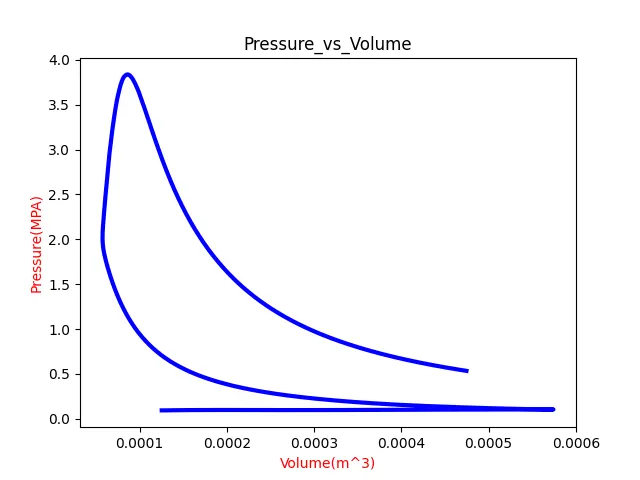
- The Third graph is between volume vs pressure i.e volume data is present in the column 7 and the pressure data is present in the column 1 the graph shown below
Result
All the graphs using column name as a input is coded above
The requried calculations are
- Area under the cureve between column pressure and volume whic is calculated using np.trapz which is a calculation syntax for area under curve
Area under the curve(Workdone) = 0.5005 KJ
- Power output of the engine is calculated
Power = workdone * RPM
Power = 12.514 KW
- Specific heat composition(SFC) is calculated
SFC = 0.00575 g/KWH