Week 6 - Data analysis
AIM :- Write a python script for file parsing of Converge CFD Data file.
Objectives :-
1) Calculate the area under the P-V diagram. P is in column 2 and V is in column 8.
2) Calculate the power output of this engine. Assume that RPM is 1500
3) This engine consumed 20 micro grams of fuel (per 1 stroke cycle). Calculate its specific fuel consumption.
Program : -
import math
import matplotlib.pyplot as plt
from numpy import *
from matplotlib.pyplot import *


# File Compatibility
def file_reader(file):
    if file == "engine_data.out":
        print("File Name OK", "Proceeding Compatibility Check")
        if 'CONVERGE' not in a[0]:
            print("Error : Unsupported File")
            print("Provide a valid Converge File")
            exit()
        else:
            print("File Is Compatible", "Setting Up Environment n")
    else:
        print("Error : Unsupported File")
        print("Provide a valid Converge File")
        exit()


# prompt
file = input("Enter Filename :  ")
a = []
for line in open(file, 'r'):
    if '#' in line:
        a.append(line.split())

file_reader(file)

# setting Interface
# Appending Interface Data
col_num = a[1]
col_data = a[2]
col_unit = a[3]

# Data cleaning for Displaying
col_num = col_num[2:]
col_data = col_data[1:]
col_unit = col_unit[1:]


# Title for Interface
def header(s):
    str = " "
    return str.join(s)


s = a[0]

# Interface
print("n* * * * * * * * * * * * * * * * * * * * * * * * * * * * * * * * * * * * * * * *")
print(header(s))
print("n* * * * * * * * * * * * * * * * * * * * * * * * * * * * * * * * * * * * * * * *")
print("Data Available For Analysis n")
print("Column : Data : Unit")
print("-------------------------")

for i in range(len(col_num)):
    if i < 9:
        print("  0" + col_num[i], " : ", col_data[i], " : ", col_unit[i], " : ")
    else:
        print("  " + col_num[i], " : ", col_data[i], " : ", col_unit[i], " : ")
print("n* * * * * * * * * * * * * * * * * * * * * * * * * * * * * * * * * * * * * * * *")

# prompt
print("n Select Any Two From The above Data n")

x = (int(input("Enter The Column for x-axis : ")) - 1)
y = (int(input("Enter The Column for y-axis : ")) - 1)

# Labels On Both Axis
x_label = col_data[x]
y_label = col_data[y]

X = []
Y = []

# apending Called Data
for line in open(file, 'r'):
    if '#' not in line:
        X.append(float(line.split()[x]))
        Y.append(float(line.split()[y]))

# Basic Performance Calculation
P = []
V = []

for line in open(file, 'r'):
    if '#' not in line:
        P.append(float(line.split()[1]))
        V.append(float(line.split()[7]))

pressure = 1e6 * array(P)
volume = array(V)
AUC = trapz(pressure, volume)
cyclepersec = 750 / 60
power = AUC * (cyclepersec / 1000)
mf = 20e-6
SFC = mf * 3600 / power

# Displaying Engine Performance
print("n----------------------------------------------------------")
print("| Engine Performance Calculation                         |")
print("----------------------------------------------------------")
print("| Work done =", AUC, "Joules                         |")
print("n----------------------------------------------------------")
print("| Power Output of the Engine @ 1500RPM", power, "KW |")
print("n----------------------------------------------------------")
print("| Specific Fuel Consumption", SFC, "g/KW.h  |")
print("n----------------------------------------------------------")
print("n* * * * * * * * * * * * * * * * * * * * * * * * * * * * * * * * * * * * * * * *")

# plotting
plt.plot(X,Y)
plt.xlabel(x_label+col_unit[x])
plt.ylabel(y_label+col_unit[y])
plt.savefig(y_label+"-"+x_label+".png")
plt.show()
Working Code : -
1. The code begins with importing required libraries. Libraries of interest here are, numpy and matplotlib.pyplot. for calculations and plotting respectively.
2. As we need our script to exit gracefully in case invalid file is provided. For this we define a function that can run a compatibility test. The test is simply a series of if else statements which helps in checking validity of file.
3. File name is taken as input by a prompt and the file is passed into the compatibilty checker function.
4. Once compatibility check is done, data stored in file is cleaned to form an interface. The interface has columns which consists the data contained by the data file. Also, header for interface is extracted.
5. Again a prompt is given to user to select any two data points from the interface. This points are extracted and appended into empty arrays (namely X and Y). The extracted data is plotted at later stage.
6. Next, we extract pressure and volume values to calculate engine power. This done by evaluation of area under PV curve (this gives work) this when multiplied by number of cycles gives power. This is done by using trapz command. The results are displayed in tabular fashion proceeding which we have plots embelished in previous steps.
RESUlT :
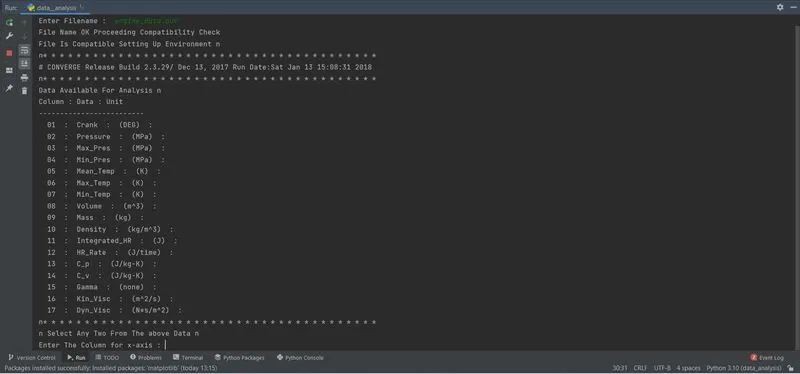
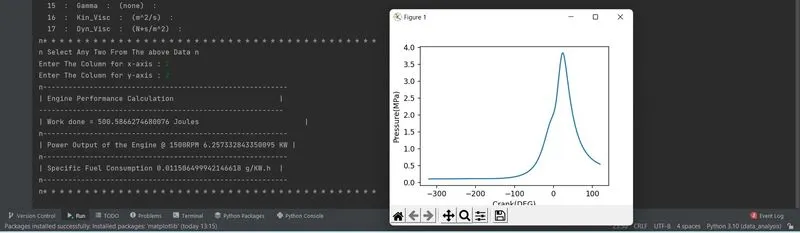
First selection of x axis 1 & y axis 2
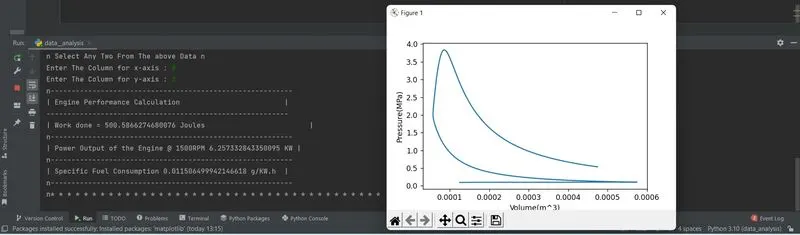
second selection of x axis =8 and y axis = 2