Project 1 - Parsing NASA thermodynamic data
AIM : Write a function that extracts the 14 co-efficients and calculates the enthalpy, entropy and specific heats for all the species in the data file.
function code :-
1] SPECIFIC HEAT :-
% Function to calculate specific heat (cp)

function  cp = specific_heat(a1,a2,a3,a4,a5,b1,b2,b3,b4,b5,T,R,global_med_temp)
% comparing with gobal temp

if T>global_med_temp

    cp = R*(a1+a2*T+a3*T.^2+a4*T.^3+a5*T.^4);
else
    cp = R*(b1+b2*T+b3*T.^2+b4*T.^3+b5.*T.^4);
end
2] ENTHALPY :-
% Function to calculate enthalpy (h)

function h = enthalpy(a1,a2,a3,a4,a5,a6,b1,b2,b3,b4,b5,b6,T,R,global_med_temp)

if T>global_med_temp
    h = R*(a1*T+(a2*T.^2)./2+(a3*T.^3)./3+(a4*T.^4)./4+(a5*T.^5)./5+a6);
else
    h = R*(b1*T+(b2*T.^2)./2+(b3*T.^3)./3+(b4*T.^4)./4+(b5*T.^5)./5+b6);
end
3] ENTROPY :-
% Function to calculate entropy (s)

function  s = entropy(a1,a2,a3,a4,a5,a7,b1,b2,b3,b4,b5,b7,T,R,global_med_temp)

if T
4] MOLECULAR WEIGHT :-
% function to calculate molecular weight

function MW = molecular_weight(element_name)
atoms = ['H','C','N','O','A'];
fprintf('molecular weight of');
fprintf(element_name);
fprintf(' : ');
atomic_weight = [1 12 14 16 39];
MW = 0;

for i = 1:length(element_name);
    for j = 1:length(atoms);
        if strcmp(element_name(i),atoms(j))
            MW = MW+atomic_weight(j);
            position = j
        end
    end
    n = str2num(element_name(i));
    if n>1
        MW = MW+atomic_weight(position)*(n-1);
    end
end
fprintf('%d',MW);
disp(' ');

end
MAIN CODE :-
clear all
close all
clc

f1 = fopen('THERMO.dat','r');
first_line = fgetl(f1);

% obtaining global maximum, medium and minimum temperatures
global_temp = fgetl(f1);
temp_range = strsplit(global_temp,' ');

% obtaining temperature values from splitting data
global_min_temp = str2num(temp_range{2});
global_med_temp = str2num(temp_range{3});
global_max_temp = str2num(temp_range{4});

% creating vector of 400 evenly spaced temperature points
R = 8.314;
comments1 = fgetl(f1);
comments2 = fgetl(f1);
comments3 = fgetl(f1);

for i = 1:53
    line1 = fgetl(f1);
    line_1 = strsplit(line1,' ')
    T_med = str2double(line_1(length(line_1)-1));
    T_max = str2double(line_1(length(line_1)-2));
    T_min = str2double(line_1(length(line_1)-3));
    T = linspace(T_min,T_max,400);
    element_name = strtok(line1);

    line2 = fgetl(f1);
    a = strfind(line2,'E');

    line3 = fgetl(f1);
    b = strfind(line3,'E');

    line4 = fgetl(f1);
    c = strfind(line4,'E');

    a1 = str2num(line2(1:a(1)+3));
    a2 = str2num(line2(a(1)+4:a(2)+3));
    a3 = str2num(line2(a(2)+4:a(3)+3));
    a4 = str2num(line2(a(3)+4:a(4)+3));
    a5 = str2num(line2(a(4)+4:a(5)+3));
    a6 = str2num(line3(1:b(1)+3));
    a7 = str2num(line3(b(1)+4:b(2)+3));

    b1 = str2num(line3(b(2)+4:b(3)+3));
    b2 = str2num(line3(b(3)+4:b(4)+3));
    b3 = str2num(line3(b(4)+4:b(5)+3));
    b4 = str2num(line3(1:c(1)+3));
    b5 = str2num(line3(c(1)+4:c(2)+3));
    b6 = str2num(line3(c(1)+4:c(2)+3));
    b7 = str2num(line3(c(1)+4:c(2)+3));


        % specific heat
        cp = specific_heat(a1,a2,a3,a4,a5,b1,b2,b3,b4,b5,T,R,global_med_temp);

        % enthalpy
        h = enthalpy(a1,a2,a3,a4,a5,a6,b1,b2,b3,b4,b5,b6,T,R,global_med_temp);

        % entropy
        s = entropy(a1,a2,a3,a4,a5,a7,b1,b2,b3,b4,b5,b7,T,R,global_med_temp);

        % molecular weight
        MW = molecular_weight(element_name);

        % saving the data
        cd('C:\Users\Rajat Ramteke\Desktop\rajat');
        dir_name = element_name;
        mkdir(dir_name);

        % plotting the data
        figure(1)
        plot(T,cp,'LineWidth',2,'Color','b')
        title(sprintf('specific_heat Vs Temperature for %s ', element_name))
        xlabel('TEMPERATURE')
        ylabel('SPECIFIC HEAT')
        grid on

        figure(2)
        plot(T,h,'LineWidth',2,'Color','r')
        title(sprintf('Enthalpy Vs Temperature for %s ', element_name))
        xlabel('TEMPERATURE')
        ylabel('ENTHALPY')
        grid on

        figure(3)
        plot(T,s,'LineWidth',2,'Color','g')
        title(sprintf('Entropy Vs Temperature for %s ', element_name))
        xlabel('TEMPERATURE')
        ylabel('ENTROPY')
        grid on

        pause(0.0001)
        cd(dir_name);
        saveas(1,'specific heat.png');
        saveas(2,'Enthalpy.png');
        saveas(3,'Entropy.png');
        cd('C:\Users\Rajat Ramteke\Desktop\rajat');

end
OUTPUT :-
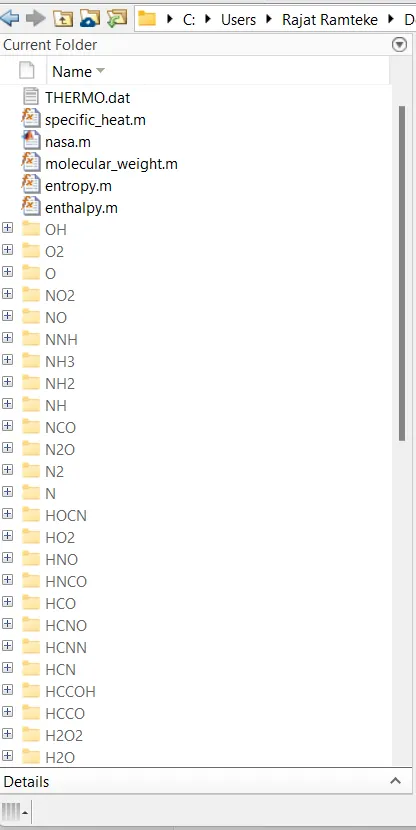
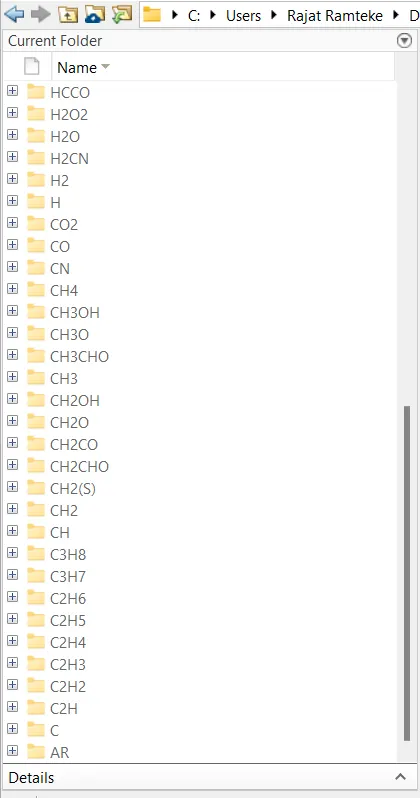
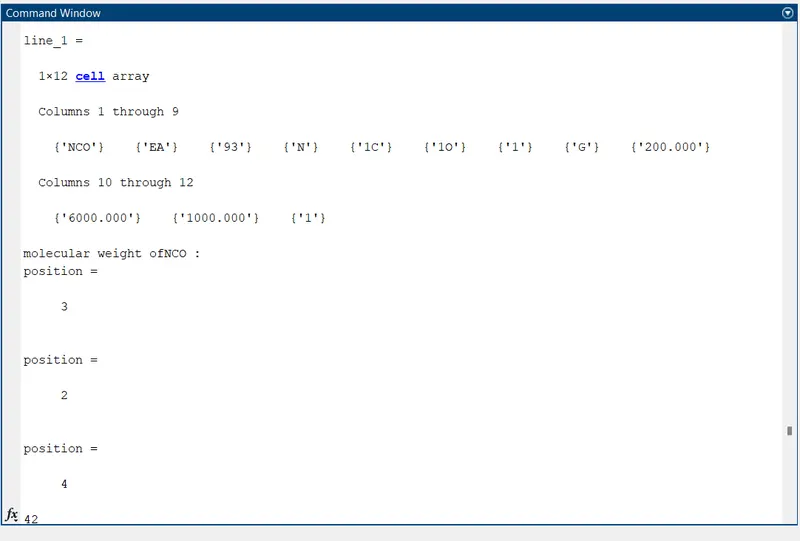
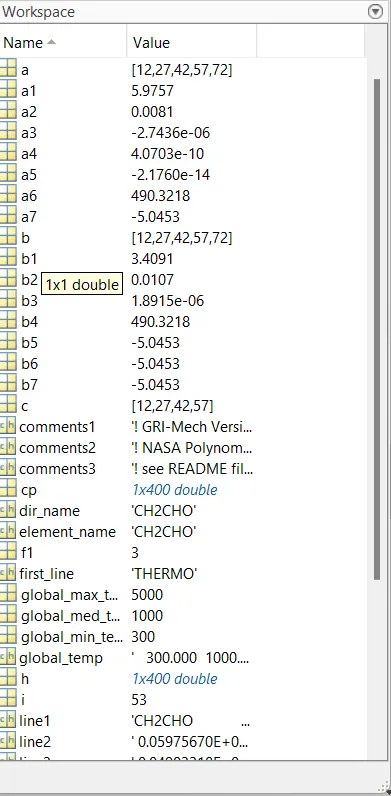
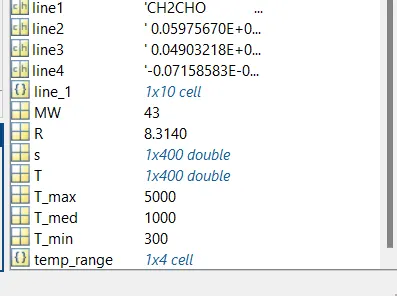
RESULT & CONCLUSION :-
A function that extracts the 14 co-efficients is written and the enthalpy, entropy and specific heats for all the species in the given NASA data file are calculated. And the molecular weight of each species are calculated and displayed it in the command window. The Cp, Enthalpy and Entropy for the local temperature range specific for each species given in the data file were plotted. These graphs for specific species are saved as image in their alloted folder.
From this project have learnt to open a data file and read using the commands and to get the lines form the file and using it calculations. And to make a directory and to change directory and to save the plotted graphs as images using saveas command.