Week 6 - Data analysis
DATA ANALYSIS
Aim: Write code to read a data file and generate plots based on user input.
Objectives:
- Script should take column numbers as the input and plot the respective columns as separate images.
- Each file should be saved by the name of the column.
- The plot labels should be extracted from the file.
- Code should exit gracefully if a non-compatible file is provided as an input. It should say something like "File not recognized. Please provide a valid CONVERGE output file".
- Calculate the area under the P-V diagram. P is in column 2 and V is in column 8.
- Calculate the power output of the engine. Assume RPM as 1500.
- Calculate engine’s specific fuel consumption if it consumes 20 micro grams of fuel (per 1 stroke cycle).
Formulae:
- Power output, P = ((Work done)*(Stroke cycle))/1000 (kW)
- Specific fuel consumption, `SFC = r/P` (kg/kWh)
where,
r = fuel consumption rate in grams per second (g/s)
P = engine power (W)
Problem Statement:
Use the given output file(engine_data) which contains data values of certain parameters and write a code which reads this file and generates plots between two parameters based on user inputs. The plot’s labels should be extracted from the provided data file and the plot should be saved by the name of columns. Calculate area under the P-V diagram, power output and specific fuel consumption.
Solution Procedure:
- Import necessary modules such as “matplotlib”, “numpy”, ‘tabulate”, “math” and “simps from scipy.integrate”.
- Do Compatibility check by comparing the user input file name with the provided file’s name.
- Read the given file. First five lines contain information as comments, so store all the information lines in an array.
- From comments array extract column number, parameter names and units.
- Display a table containing column numbers, parameter names and units.
- Ask the inputs for column numbers from user for plotting.
- Extract the requested data from the data file and plot the diagram.
- Calculate area under curve, power output and specific fuel consumption.
Code:
# DATA ANALYSIS
# import necessary modules
import matplotlib.pyplot as plt
import numpy as np
from tabulate import tabulate
import math
from scipy.integrate import simps

# compatability check

file_name = input('Enter file name: ')

if file_name == 'engine_data.out':
	print('\n')
else:
	print('File not recognized. Please provide a valid CONVERGE output file name')

# file reading
# comment section
comments = []
for line in open(file_name):
	if '#' in line:
		comments.append(line.split())

# column numbers
c_no = []
for elements in comments[1]:
	if '#' not in elements:
		if 'column' not in elements:
			c_no.append(elements)

# parameters name
parameters = []
for  names in comments[2]:
	if '#' not in names:
		parameters.append(names)

# units
units = []
for Units in comments[3]:
	if '#' not in Units:
		units.append(Units)

# Displaying parameter table
header = ['Sl.no','Parameters','Units']
data = zip(c_no,parameters,units)
print(tabulate(data,headers=header,tablefmt='plain'))

# taking column numbers as input and plotting respective columns
z = 1
while z == 1:
	print("\nProvide column numbers to generate plot\n ")
	p1 = int(input('Enter 1st column number(x-axis): '))
	p2 = int(input('Enter 2nd column number(y-axis): '))

	# labels with units
	label_x = parameters[p1-1] + units[p1-1]
	label_y = parameters[p2-1] + units[p2-1]

	# plot data
	data1 = []
	data2 = []

	# basic performance data
	Pressure = []
	Volume = []

	# extracting required data
	for line in open(file_name):
		if '#' not in line:
			data1.append(float(line.split()[p1-1]))
			data2.append(float(line.split()[p2-1]))
			Pressure.append(float(line.split()[1]))
			Volume.append(float(line.split()[7]))


	# Plotting
	plt.plot(data1,data2,linewidth=3)
	plt.xlabel(label_x)
	plt.ylabel(label_y)
	plt.title(label_y+' vs '+label_x)
	plt.grid()
	plt.show()
	plt.savefig(label_y+' vs '+label_x)

	# Area under P-V diagram
	area = simps(Pressure,Volume)
	print('\nArea under P-V diagram: '+str(area))
	print('Work done by the engine: '+str(area*1e6))

	# Power output of the engine(power = (work done*stroke cycle)/1000) || work done = (area*1e6)
	rpm = int(input('\nEnter RPM to calculate power output of engine: '))		# Rotations per minute
	stroke_cycle = rpm/(60*2)
	power = (area*1e6)*(stroke_cycle/1000)
	print('Power output of the engine:'+str(power)+' KW\n')

	# Specific fuel consumption
	r = int(input('Enter Fuel consumption rate in mg per 1 stroke of cycle: '))
	sfc = (r/power)*3.6
	print('Specific fuel consumption of engine:'+str(sfc)+' kg/kW-hr\n')


	# To continue or exit the loop
z = int(input('Enter 1 to plot another diagram or enter any other number to exit:'))Results:
- Below figure is output window showing "File not recognized. Please provide a valid CONVERGE output file name". This statement is displayed as the file name enterd by user dosen't matches with which the file name used in the code.

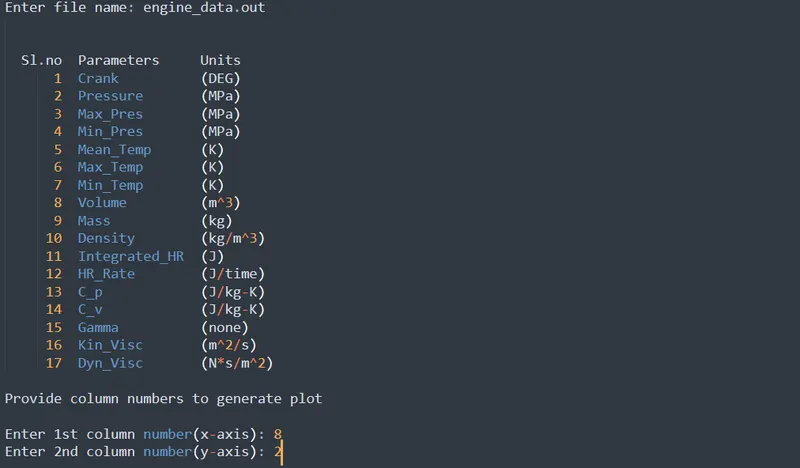
- After entering a valid CONVERGE output file name, the code reads the file and displays a table containing serial number, parameters and units as header as shown below. Then asks to enter two column numbers between which the plot should be created.
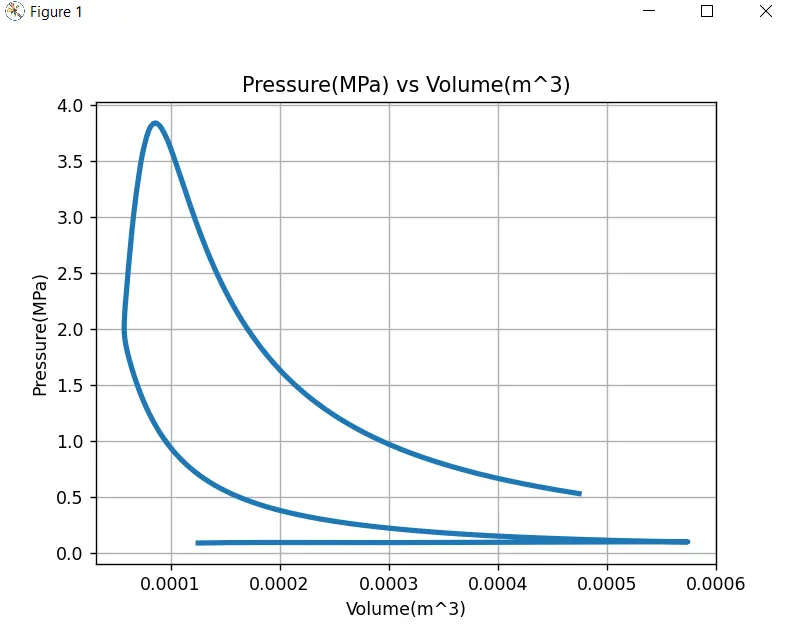
- After providing two inputs, it generates plot between two entered column numbers as shown below. The plot automatically generates the axis labels and title.
- After plotting the PV diagram, calculated Area under PV diagram and Work done by the engine is displayed in the output window as shown below.

- Below figure shows the output window asking the input of RPM to calculate power output.

- Below figure shows the output window displaying the Power output value for 1500RPM.

- Below figure shows the output window asking the input of fuel consumption rate.

Below figure shows the output window displaying the Specific fuel consumption of the engine and asks to enter 1 if user wants to plot another diagram or enter any other number to exit.

Discussion: The code has been written to read a file and plot diagrams according to the user inputs. It also automatically saves the plot figure with a name consisting of respective column names. It also calculates and displays power output and specific fuel consumption. As many plots could be generated on a single run of this code.
References: