Week 6 - Data analysis
Aim
To develop a python code that can perform Data visualization, compatibility check, and perform the basic calculations.
1.Data Visualization:
- "Matplotlib" is used to perform plotting operations.
- "numpy" is used to perform array operations.
- A function "def datavisvualizer():" is defined to perform repetitive operations whenever the function is called.
- "line count" is defined to store the number of iterations.
- "try and except" is defined to check for the data file availability.
- "open'' command is used to open the file. The file should be stored in the directory where the python program is executed.
- int represents the integer, int(input) where input is the command which is used to get the value/ data from the user.
- "line. split()" is defined to split the data and the data can be stored as an array.
- "for loop" is used to read each line in the file and if the command is used to filter the data from the file.
- Finally "plt.plot" is used to plot the data.
Code:
def datavisvualizer():
	linecount=1
	column_name1=[]
	column_name2=[]
	column_unit1=[]
	column_unit2=[]
	xaxis=[]
	yaxis=[]
	try:
		file=open('engine_data.out')
		print('The file engine_data was successfully opened')
		print('Welcome to the world of IC Engines \n 0.Crank angle(Theta) \n 1.Pressure(Mpa) \n 2.Maximum Pressure(Mpa) \n 3.Minimum Pressure(Mpa) \n 4.Mean Temperature(K) \n 5.Maximum Temperature(K) \n 6.Minimum Temperature(K) \n 7.Volume(m^3) \n 8.Mass(kg) \n 9.Density(kg/m^3) \n 10.Integrated HR(J) \n 11.HR Rate(J/time \n 12.CP(J/kg-K) \n 13.CV(J/kg-K)) \n 14.Gamma \n 15.Kinematic viscosity(m^2/s) \n 16.Dynamic viscosity(N*s/m^2)')
		print('Select a value between 0 and 16,this for the x coordinate')
		option1=int(input(''))
		print('Your selected option is',option1)
		print('Select a value between 0 and 16,this for the y coordinate')
		option2=int(input(''))
		print('Your selected option is',option2)
		for line in open('engine_data.out'):
			if linecount==3:
				column_name1=line.split()[option1+1]
				column_name2=line.split()[option2+1]
			if linecount==4:
				column_unit1=line.split()[option1+1]
				column_unit2=line.split()[option2+1]
			if '#' not in line:
				xaxis.append(float(line.split()[option1]))
				yaxis.append(float(line.split()[option2]))
			linecount=linecount+1
		plt.plot(xaxis,yaxis,linewidth=3)
		plt.xlabel(column_name1+column_unit1)
		plt.ylabel(column_name2+column_unit2)
		plt.title(column_name1+" "*1+'vs'+" "*1+column_name2)
		plt.grid()
		plt.savefig(column_name1+"_"+'vs'+"_"+column_name2)
		plt.show()
		print("Thank you.Have a good day")
	except:
		print("File not recognized. Please provide a valid CONVERGE output file")
Output:
After running the program the following outputs were displayed
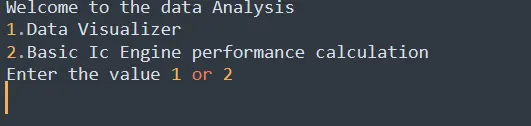
The above output collects the information about the task to be performed. For this program, i choose "5"
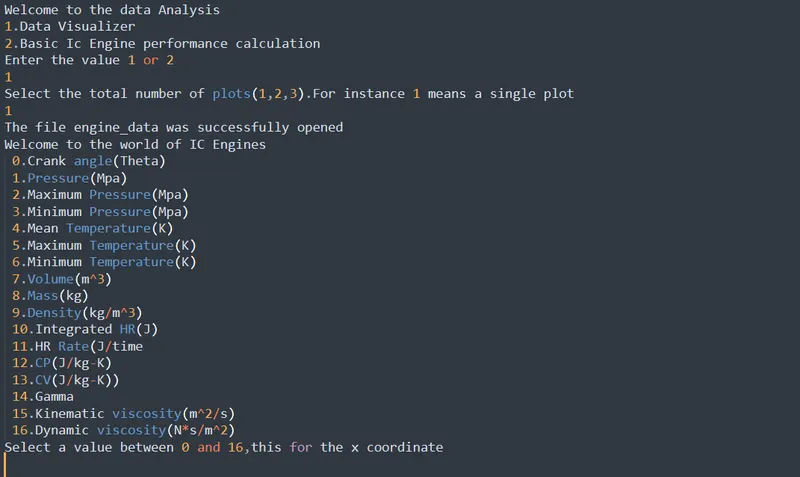
This output displays the menu which contains all the columns from the data (engine_data.out). Select either two to perform plotting operations
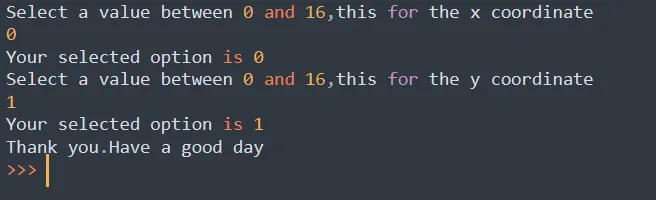
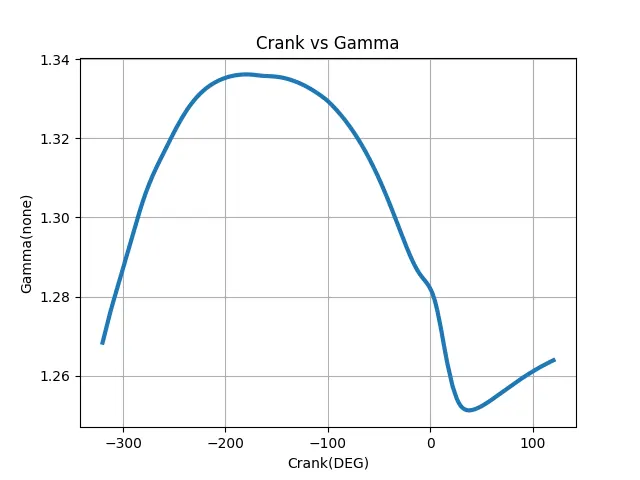
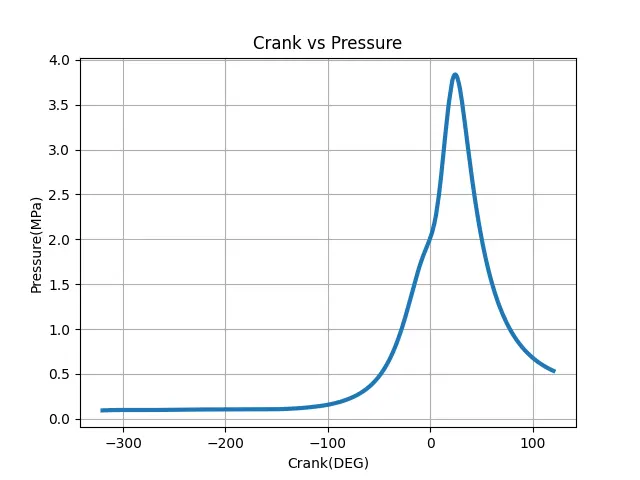
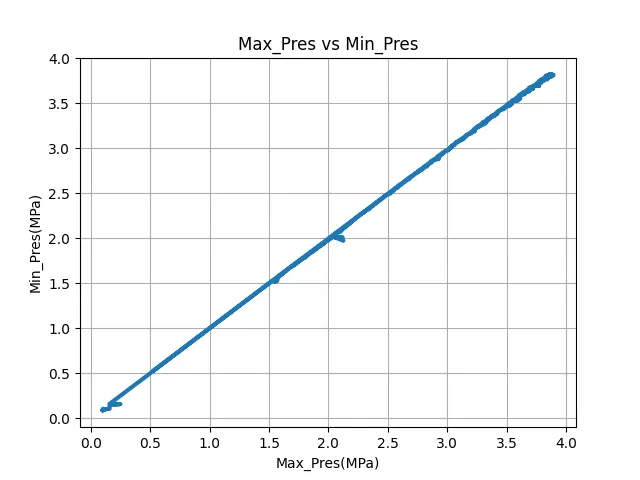
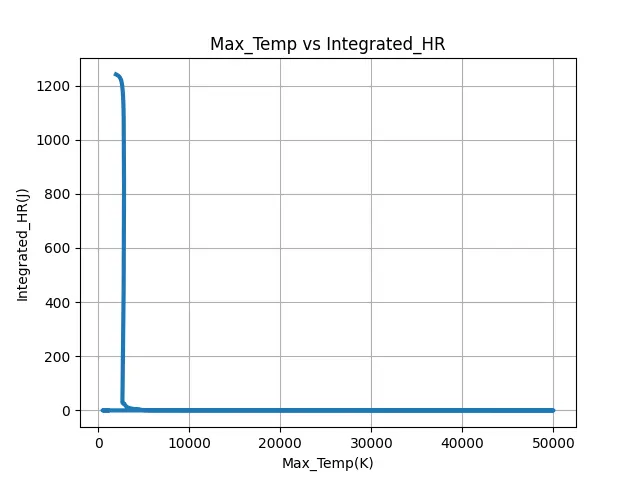
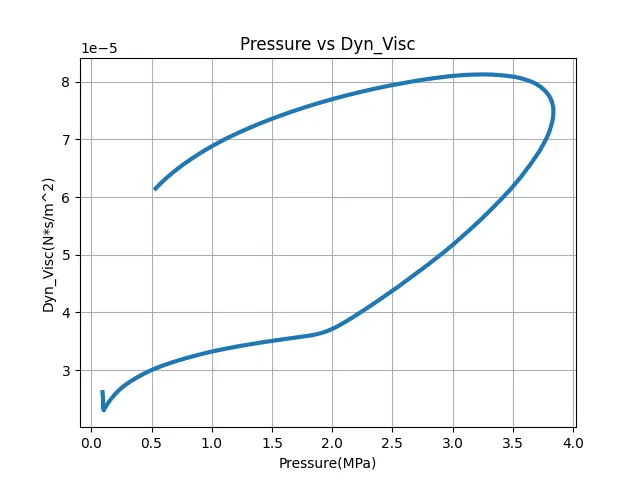
In this output, 0 represents crank angle and 1 represents pressure. After giving the values the following plots were displayed Since I gave 5 plots as input. All 5 plots were saved and displayed
2.Compatibility Check:
"try and except" is defined to check for the data file availability. Try is similar to the if condition and is used in file parsing. This command checks for the file in the directory if available execute the program successfully if not the program automatically exists in the block. except is similar to else in looping statement used for display error messages.
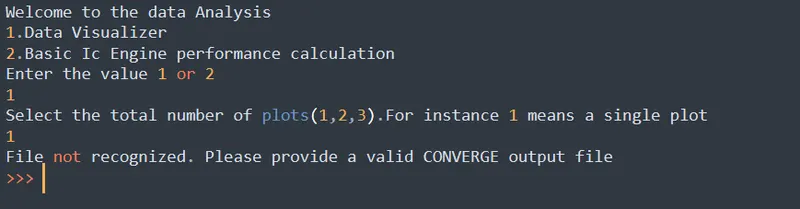
The following output is displayed when there is a lack of file.
3.Basic Calculations:
Formulae used:
Power output=(W*RPM*n)/(60*1000*2)
n is the number of cylinders
W is the work output
RPM=1500
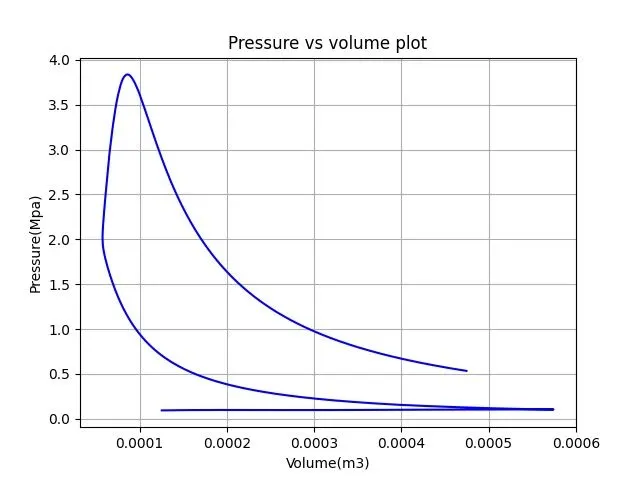
Power output= Area under PV diagram*Speed
SFC(Specific fuel consumption)= fuel consumed per unit time /power
mass of the fuel= 20 micrograms of fuel (per 1 stroke cycle)
Procedures:
- "simps" is imported from the scipy module.
- "try and except" is defined to check for the data file availability.
- A separate function for basic calculation is defined to perform repetitive operations.
- Similar to objective1 same for and if loop is defined to read and sort the file data.
- Formulas were defined to perform basic ic engine operations,.
- The data for p and v is collected from the file using file parsing and stored in a separate array.
- simps are the sinusoidal rule which is used to calculate the area under the curve. By this approach area under p v diagram are calculated
Program
def basiccalculation():
	try:
		file=open('engine_data.out')
		print('The file engine_data was successfully opened')
		P=[]
		V=[]
		N=1500
		Speed=N/60
		stroke_cycle=Speed/2
		n=1 #number of cylinder
		Mass=20*pow(10,-6)
		for line in open('engine_data.out'):
			if '#' not in line:
				V.append(float(line.split()[7]))
				P.append(float(line.split()[1]))
		plt.plot(V,P,color='blue')
		plt.xlabel('Volume(m3)')
		plt.ylabel('Pressure(Mpa)')
		plt.title('Pressure vs volume plot')
		plt.grid()
		Area=float(simps(P,V))
		Power=(Area*n*stroke_cycle*pow(10,6))/1000
		SFC=(Mass*stroke_cycle*3600)/(Power*1000)
		print('Area under P V diagram is :',Area)
		print('The power output is:',Power)
		print('The Specific fuel consumption is:',SFC)
		plt.show()
	except:
		print("File not recognized. Please provide a valid CONVERGE output file")
Output
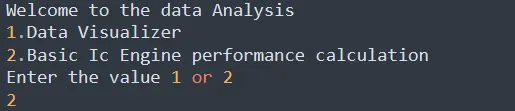
when the value 2 is entered the following outputs were displayed

Python Code:
# Library files
import matplotlib.pyplot as plt
import numpy as np
from scipy.integrate import simps

def datavisvualizer():
	linecount=1
	column_name1=[]
	column_name2=[]
	column_unit1=[]
	column_unit2=[]
	xaxis=[]
	yaxis=[]
	try:
		file=open('engine_data.out')
		print('The file engine_data was successfully opened')
		print('Welcome to the world of IC Engines \n 0.Crank angle(Theta) \n 1.Pressure(Mpa) \n 2.Maximum Pressure(Mpa) \n 3.Minimum Pressure(Mpa) \n 4.Mean Temperature(K) \n 5.Maximum Temperature(K) \n 6.Minimum Temperature(K) \n 7.Volume(m^3) \n 8.Mass(kg) \n 9.Density(kg/m^3) \n 10.Integrated HR(J) \n 11.HR Rate(J/time \n 12.CP(J/kg-K) \n 13.CV(J/kg-K)) \n 14.Gamma \n 15.Kinematic viscosity(m^2/s) \n 16.Dynamic viscosity(N*s/m^2)')
		print('Select a value between 0 and 16,this for the x coordinate')
		option1=int(input(''))
		print('Your selected option is',option1)
		print('Select a value between 0 and 16,this for the y coordinate')
		option2=int(input(''))
		print('Your selected option is',option2)
		for line in open('engine_data.out'):
			if linecount==3:
				column_name1=line.split()[option1+1]
				column_name2=line.split()[option2+1]
			if linecount==4:
				column_unit1=line.split()[option1+1]
				column_unit2=line.split()[option2+1]
			if '#' not in line:
				xaxis.append(float(line.split()[option1]))
				yaxis.append(float(line.split()[option2]))
			linecount=linecount+1
		plt.plot(xaxis,yaxis,linewidth=3)
		plt.xlabel(column_name1+column_unit1)
		plt.ylabel(column_name2+column_unit2)
		plt.title(column_name1+" "*1+'vs'+" "*1+column_name2)
		plt.grid()
		plt.savefig(column_name1+"_"+'vs'+"_"+column_name2)
		plt.show()
		print("Thank you.Have a good day")
	except:
		print("File not recognized. Please provide a valid CONVERGE output file")

def basiccalculation():
	try:
		file=open('engine_data.out')
		print('The file engine_data was successfully opened')
		P=[]
		V=[]
		N=1500
		Speed=N/60
		stroke_cycle=Speed/2
		n=1 #number of cylinder
		Mass=20*pow(10,-6)
		for line in open('engine_data.out'):
			if '#' not in line:
				V.append(float(line.split()[7]))
				P.append(float(line.split()[1]))
		plt.plot(V,P,color='blue')
		plt.xlabel('Volume(m3)')
		plt.ylabel('Pressure(Mpa)')
		plt.title('Pressure vs volume plot')
		plt.grid()
		Area=float(simps(P,V))
		Power=(Area*n*stroke_cycle*pow(10,6))/1000
		SFC=(Mass*stroke_cycle*3600)/(Power*1000)
		print('Area under P V diagram is :',Area)
		print('The power output is:',Power)
		print('The Specific fuel consumption is:',SFC)
		plt.show()
	except:
		print("File not recognized. Please provide a valid CONVERGE output file")
print('Welcome to the data Analysis')
print('1.Data Visualizer\n2.Basic Ic Engine performance calculation')
print('Enter the value 1 or 2')
n=int(input())
if n==1:
	print('Select the total number of plots(1,2,3).For instance 1 means a single plot')
	k=int(input())
	for f in range (0,k):
		task1=datavisvualizer()
		k=k+1
elif n==2:
	task2=basiccalculation()
else:
	print('Option dosent exist.Please try again')
	print('1.Data Visualizer\n2.Basic Ic Engine performance calculation')
	print('Enter the value 1 or 2')
	n=int(input())
	if n==1:
		print('Select the total number of plots(1,2,3).For instance 1 means a single plot')
		k=int(input())
		for f in range (0,k):
			task1=datavisvualizer()
			k=k+1
	elif n==2:
		task2=basiccalculation()
	else:
		print('Sorry Better luck next time')
Conclusion:
- Data visualization is performed by using the parsing command in python.
- Compatibility check is executed using the try and except option.
- By using the parsing command area under the p v diagram is calculated.