Week 6 - Data analysis
OBJECTIVE: A Python script to visualize the data according to the user input and save the images.
PROBLEM STATEMENT:
- DATA VISUALIZER: The Python script should take column numbers as the input and plot the respective columns as separate images. The name of the column should save each file.
The plot labels should be extracted from the file. If I request a plot between column 1 (crank angle) and column 8(volume), then the label information should automatically be extracted and appear as labels in the plots. THIS SHOULD NOT BE DONE MANUALLY.
- COMPATIBILITY CHECK: The Python code should exit gracefully if a non-compatible file is provided as an input. It should say something like, "File not recognized. Please provide a valid CONVERGE output file".
- BASIC PERFORMANCE CALCULATIONS: Calculate the area under the P-V diagram. Calculate the power output of this engine. Assume that RPM is 1500. This engine consumed 20 micrograms of fuel (per 1 stroke cycle). Calculate its specific fuel consumption.
SOLUTION PROCEDURE:
- At first, required modules are imported.
- Then the input commands are used to ask the enter the file name.
- After If block (Conditional statement) is used to check whether the user entered file name is found or not. It continues to compatibility check.
- If not, it displays ‘File not found. Please provide a valid converge file’.
- Using for loop extracting each line from the given data and in between using if block to eliminate lines containing # symbol and appending all the values in the data to the created empty array parameters.
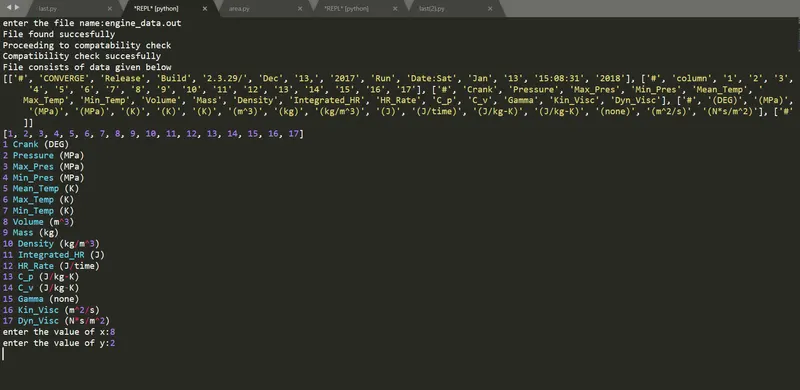
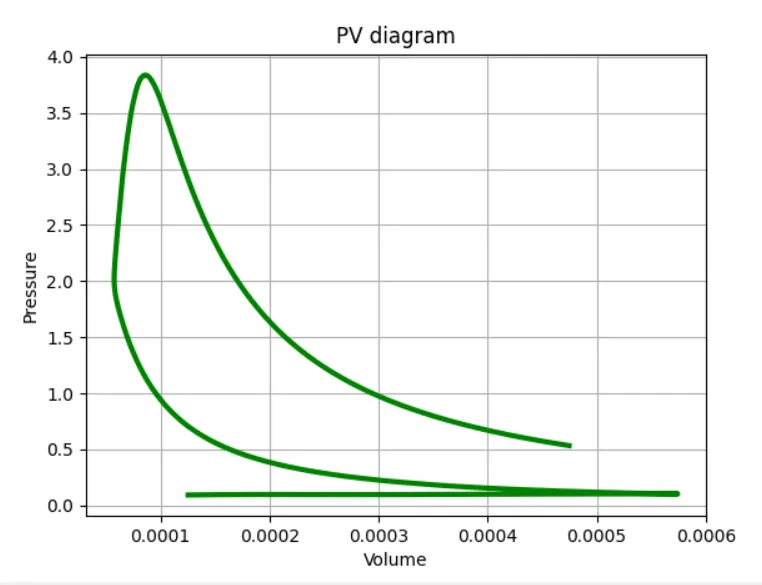
- After using for loops and if blocks, printing the column numbers, column names, and column units. Then using input commands plotting the graph between any two columns. (E.g., PV diagram).
- We know that the given data file contains thermodynamic data collected from a port fuel-injected engine simulation. From the data file, we can understand it is a 4 stroke Otto cycle. So, we will apply the following formula to calculate the basic performance of the engine.
-
- Extract volume and pressure data from the input data file and append the corresponding values to the created empty arrays such as pressure and volume. Then, numerically integrate the pressure and volume data using trapz () function from scipy. Integrate library. It is the work done by the engine.
- A= Area under the PV curve (i.e., Work done per cycle in MJ).
- Power output = Product of (A, n, 1e6) W {n= Number of cycles per second}.
- n = N/2*60 for 4 stroke engine and n = N/60 for 2 stroke engines {N = Rotations per min}.
- BSFC (Brake specific fuel consumption):
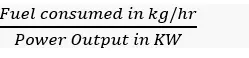
- Plotting the required graphs.
-
CODE WITH EXPLAINATION:
- (1) Contains Data Visualizer and Compatability check:
-
# DATA ANALYSIS USING PYTHON. # BY SAMBA MAHESH. # IMPORTING REQUIRED MODULES. import math import matplotlib.pyplot as plt import numpy as np #l=int(input("enter the line no:")) line_count=1 # COMPATABILITY CHECK # If block (Conditional statement) is used to check whether the user entered file name is found or not. It continues to compatibility check. # If not, it displays ‘File not found. Please provide a valid converge file’. # The input commands are used to ask the enter the file name. File=input("enter the file name:") if File=='engine_data.out': print("File found succesfully") print("Proceeding to compatability check") print("Compatibility check succesfully") print("File consists of data given below") else: 'break' #print('File not found. Please provide a valid converge file') # Creating an empty array of parameters. parameters=[] #Using for loop extracting each line from the given data and in between using if block to eliminate lines which contains # symbol. for line in open('engine_data.out'): if '#' in line: parameters.append((line.split())) # Appending all the values in the data to the created empty array parameters. print(parameters) # using for loops and if blocks, printing the column numbers, columns names, columns units. a=parameters[1].index('column') column_num=[] # Creating an empty array of column_number. for i in range(a,len(parameters[1])-1): column_num.append(i) # Appending the values to the created empty array column_number. print(column_num) column_name=[] # Creating an empty array of column_name. for j in (parameters[2]): if j !='#': column_name.append(j) # Appending the values to the created empty array column_name. #print(column_name) column_unit=[] # Creating an empty array of column_unit. for k in (parameters[3]): if k != '#': column_unit.append(k) # Appending the values to the created empty array column_unit. #print(column_unit) for l in range(0,len(column_num)): print(column_num[l],column_name[l],column_unit[l]) # printing all three (column- num, name, units) all together. # Using input commands for entering the required columns numbers for plotting. x=int(input("enter the value of x:"))-1 y=int(input("enter the value of y:"))-1 # Creating an empty arrays of X-axis and Y-axis parameters for plotting. x_parameters=[] y_parameters=[] #Using for loop extracting each line from the given data and using if block to eliminate lines containing # symbol. for line in open('engine_data.out'): if '#' not in line: x_parameters.append(float(line.split()[x])) # Appending values to the created empty array x_parameters. y_parameters.append(float(line.split()[y])) # Appending values to the created empty array y_parameters. # Printing the values of x_parameters and y_parameters print(x_parameters) print(y_parameters) # Plotting the obtained results. plt.plot(x_parameters,y_parameters,color='green',linewidth=3) plt.xlabel('Volume') plt.ylabel('Pressure') plt.title('PV diagram') plt.grid() plt.show() - (2) Basic Performance Calculations:
-
# BASIC PERFORMANCE CALCULATION OF THE ENGINE USING PYTHON.
# BY SAMBA MAHESH

# IMPORTING REQUIRED MODULES.
import math
import matplotlib.pyplot as plt
from scipy.integrate import simps
import numpy as np

# CREATING EMPTY ARRAYS OF PRESSURE AND VOLUME.
pressure=[]
volume=[]


# Using for loop to extract the data and if statement to eliminate the lines contains '#'symbole and appending the values to the created empty arrays.
for line in open('engine_data.out'):
	if '#' not in line:
		pressure.append(float(line.split()[1]))
		volume.append(float(line.split()[7]))

#Using numpy module assigning the values of pressure and volume to P & V.
P=np.array(pressure)
V=np.array(volume)

# CALCULATING AREA USING NUMERICAL INTEGRATION ( Trapezoidal rule).
area=1000*np.trapz(P,V)
# Printing the value of Area.
print('Area under the P-V diagram(Work done):' +str(area)+ ' KJ')

# Defining RPM
RPM=1500
# CALCULATING POWER OUTPUT OF THE ENGINE.
power=2*math.pi*RPM*area/60
# Printing the value of power output.
print('Power output of the engine:'+str(power)+' KW')

# CALCULATING BREAK SPECIFIC FUEL CONSUMPTION (BSFC)
Fuel_per_stroke=20*1e-6
Fuel_per_Sec=Fuel_per_stroke*RPM*(0.5/60)
Fuel_per_Hour=Fuel_per_Sec*3600
BSFC=Fuel_per_Hour/power

# Printing the value of BSFC
print('Specific fuel consumption of the engine:'+str(BSFC)+' g/Kwhr')
RESULTS AND DISCUSSIONS: