Week 6 - Data analysis
AIM: Write a python program that reads the engine output parameter data file.
OBJECTIVE: 1. To read the data from a given data file.
- To take the file name as an input from the user and check whether the file is present or not.
- To plot a graph between 2 parameters given by the user as an input.
- To do basic performance calculation by calculating the area under the P-V diagram, the power output of this engine and specific fuel consumption.
PROBLEM STATEMENT:-
- Calculate the area under the P-V diagram. P is in column 2 and V is in column 8.
- Calculate the power output of this engine. Assume that RPM is 1500
- This engine consumed 20 micrograms of fuel (per 1 stroke cycle). Calculate its specific fuel consumption.
PROCEDURE: To solve the above-given problem statement, the following procedure is followed: -
- Using a python program initially the name of the data file is taken as an input from the user and checked whether the file is present or not, if the file is not present then the program is terminated.
- Then the file is opened and data is read line by line and stored.
- The name of parameters, their units and their column number is stored as an array and displayed in the form of a table for the user to select the required columns.
- Then the column no for the independent parameter (x-axis) and dependent parameter (y-axis) is taken from the user and the values of those columns are extracted from the data file and further plotted.
- At the end, the values under pressure and volume column are extracted from the data file and the area under the PV diagram is calculated which gives the work done, then multiplying it with speed the value of power output by the engine is calculated and at the end the specific fuel consumption is also calculated and displayed.
Python program:-
#Data-Analysis
#Import required libraries
import numpy as np
import matplotlib.pyplot as plt

#File Compatibility
def file_reader(file):
	if file=="engine_data.out":
		print("File Name OK","n","Proceeding Compatibility Check")
		if 'CONVERGE' not in a[0]:
			print("Error : Unsupported File")
			print("Provide a Valid Converge File")
			exit()
		else:
			print("File is compatable. Set up OK!!")
	else:
		print("Error : Unsupported File")
		print("Provide a Valid Converge File")
		exit()

#Prompt
file = input("Enter Filename : ")
a = []
for line in open(file,'r'):
	if '#' in line:
		a.append(line.split())

file_reader(file)

#Setting Interface

#Appending Interface Data
col_num = a[1]
col_data = a[2]
col_unit = a[3]

#Data Cleaning For Displaying
col_num = col_num[2:]
col_data = col_data[1:]
col_unit = col_unit[1:]

#Title for Interface
def header(s):
	str = " "
	return (str.join(s))

s = a[0]

#Interface
print("* * * * * * * * * * * * * * * * * * * * * * * * * * * * * * * * * * * * * * * * ")
print(header(s))
print("* * * * * * * * * * * * * * * * * * * * * * * * * * * * * * * * * * * * * * * * ")
print("Data Available For Analysisn")
print("Column : Data : Unit")
print("----------------------")
for i in range(len(col_num)):
	if(i<9):
		print(" 0"+col_num[i]+"."," : ", col_data[i], ":", col_unit[i])
	else:
		print(" "+col_num[i]+"."," : ", col_data[i], ":", col_unit[i])
print("* * * * * * * * * * * * * * * * * * * * * * * * * * * * * * * * * * * * * * * * ")


#Prompt
print(" \nSelect Any Two From The above Data")
x = (int(input("Enter The Column For x-axis: "))-1)
y = (int(input("Enter The Column For y-axis: "))-1)


#Labels On Both Axis
x_label = col_data[x]
y_label = col_data[y]
X = []
Y = []

#Appending Called Data
for line in open(file,'r'):
	if '#' not in line:
		X.append(float(line.split()[x]))
		Y.append(float(line.split()[y]))

#Basic Performance Calculations
P = []
V = []
for line in open(file,'r'):
	if '#' not in line:
		P.append(float(line.split()[1]))
		V.append(float(line.split()[7]))
pressure = 1e6 * np.array(P)
volume = np.array(V)
AUC = np.trapz(pressure,volume)
cyclepersec = 750/60
power = AUC * (cyclepersec/1000)
mf = 20e-6
SFC = mf * 3600/power


#Displaying Engine Performance
print("-------------------------------------------------------------")
print("| Engine Performance Calculation |")
print("-------------------------------------------------------------")
print("| Work Done =", AUC, "Joules |")
print("-------------------------------------------------------------")
print("| Power Output of the Engine @ 1500RPM", power,"kW |")
print("-------------------------------------------------------------")
print("| Specific Fuel Consumption", SFC, "g/kW.h |")
print("-------------------------------------------------------------")
print("* * * * * * * * * * * * * * * * * * * * * * * * * * * * * * * * * * * * * * * * ")


#Plotting The Data
plt.plot(X,Y)
plt.xlabel(x_label+col_unit[x])
plt.savefig(y_label+"-"+x_label+".png")
plt.grid()
plt.show()
print("* * * * * * * * * * * * * * * * * * * * * * * * * * * * * * * * * * * * * * * * ")
print("* * * * * * * * * * * * * * * * * * * * * * * * * * * * * * * * * * * * * * * * ")
EXPLANATION:-
- Initially, the required modules are imported.
- The filename is taken as an input from the user and, to verify the user file with engine_data.out file, if the command is used.
- Using a for a loop every line of the file is read line by line.
- Then the column numbers and column names (parameter name and unit of the parameter) are separated and stored in an array.
- Using a for loop the extracted column, no and names are displayed for the user and asked to select 2 columns to make a plot.
- Then the values of the column selected by the user are extracted and stored in an array and further plotted on a graph.
- For basic performance calculation, the values of pressure and volume column are extracted and using the 'np.trapz(P,V)' command, the area under the PV diagram is calculated which also is the Workdone.
- Converting the given speed of 1500rpm into rps the power output of the engine is calculated and further the specific fuel consumption of the engine is calculated.
- All the values calculated are displayed on the screen for the user.
RESULT:-
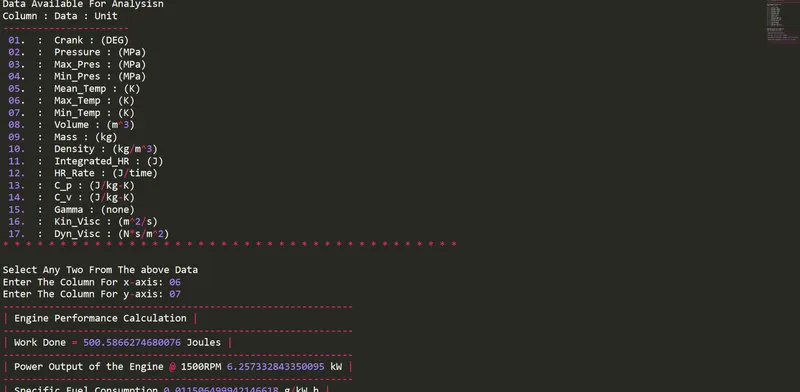
Engine Performance Calculation |
| Work Done = 500.5866274680076 Joules |
| Power Output of the Engine @ 1500RPM 6.257332843350095 kW |
| Specific Fuel Consumption 0.011506499942146618 g/kW.h
GRAPH :-
P-V diagram, cp-cvand max.temp or min temp. graphically representation respectively.
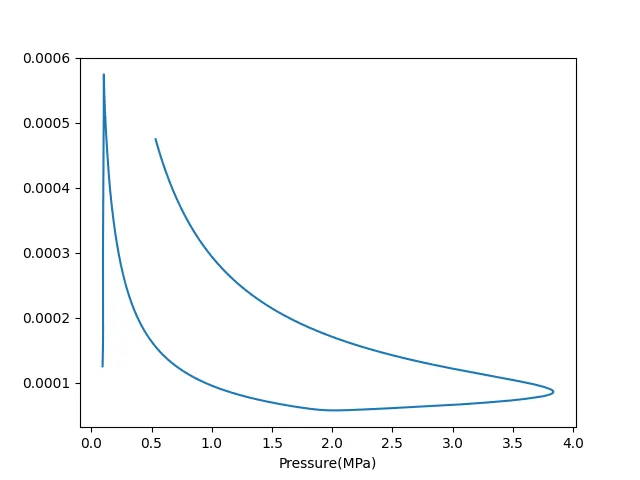
fig.1
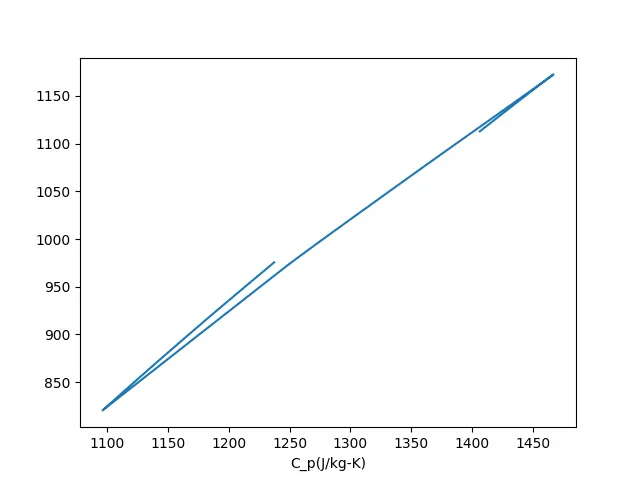
fig.2
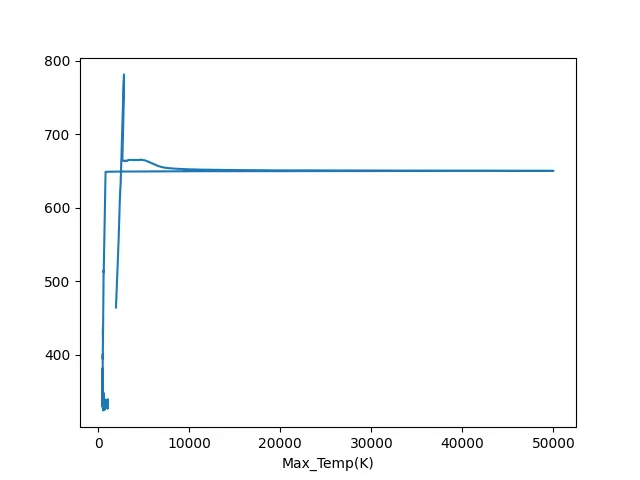
fig.3
CONCLUSIONS:
1. The data from the output file was read successfully and the plot required as per the user need was made.
2. The performance calculations were done and displayed successfully.
Area under PV diagram Work Done = 500.5866274680076 Joules
Power Output of the Engine @ 1500RPM 6.257332843350095 kW
Specific Fuel Consumption 0.011506499942146618 g/kW.h