Week 6 - Data analysis
data analysis:
objective of project:
- data visualizer:
- the python code must take the column numbers as the inputs and plot the respective column as separate images
- each file have to besaved by its respective name of the coloum
- the plot labels should be extracted from the file. as, if i want to plot a graph betweem coloum number1 and 3 then it should extract the data autometically
- compatability check:
code must be executed sucessfully ,if not the it must show that a non compatible file is provided as input the disply showld be like 'file not recognised please provide a valid converge output file'
- basic performance calculation
- calculate the area under the P-V diagram. p is in the coloumn 2 and v is in the column 8
- calculate the power output of the engine at 1500rpm
- calculate the specific fuel consuption as this engine consumes 20micro grams of fuel per stroke
python code steps:
- import required libraries
- save the python file and the engine data output in the same folder as the python file reads the data and if not stored the code will not be executed
- file gets opened and read by the programme
- then the parameters are stored in the empty arrays created and each array given a name in the programme
- the formula to calculate the power, specific fuel consuption is given in the programme to calculate from the data
- these parameters are calculated and graphs are displayed at the end of the programme
python code:
import matplotlib.pyplot as plt
import numpy as np
from numpy import trapz

fname = input("enter the filename:   ")

if fname == 'engine_data.out':
	print('file is valid')
else:
	print('file is invalid')
	exit()

def compatibility_check(a):
	if 'CONVERGE' not in a:
		print('please provide converge output file to process')
		exit()

	else:
		print('compatibility check is sucessful')

		pass
FILE= []

for line in open(fname):
	if '#' in line:
		FILE.append(line.split())

compatibility_check(FILE[0])
noc = len(FILE[1])
head = len(FILE[2])
col_no = []
col_val = []
col_units = []

z = FILE[1].index('column')
for i in range(z,noc-1):

	col_no.append(i)

for j in FILE[2]:

	if j is not '#':

		col_val.append(j)

for k in FILE[3]:

	if k is not '#':

		col_units.append(k)

print('data available are:')

for a in range(0,len(col_no)):

	print(col_no[a],col_val[a],col_units[a])

xaxis = int(input('Enter xaxis column no:'))-1
yaxis = int(input('Enter yaxis column no:'))-1

x = []
y = []

for line in open(fname):

	if '#' not in line:

		x.append(float(line.split()[xaxis]))
		y.append(float(line.split()[yaxis]))

plt.plot(x,y,linewidth=1.5)
plt.xlabel(col_val[xaxis])
plt.ylabel(col_val[yaxis])
plt.show()

pressure = []
vol = []

for line in open(fname):
	if '#' not in line:

		pressure.append(float(line.split()[1]))
		vol.append(float(line.split()[7]))

Pressure = 1e6*np.array(pressure)
Volume = np.array(vol)
area = np.trapz(Pressure,Volume)
print('workdone =',area, 'joules')
cyclepersec = 750/60
power = area*(cyclepersec/1000)
print('power=',power,'kw')
mass_flow = 20e-6
sfc = mass_flow*3600/power
print('specific fuel consumption =',sfc,'g/kwh')

#******************************************************************************
results and discussions:
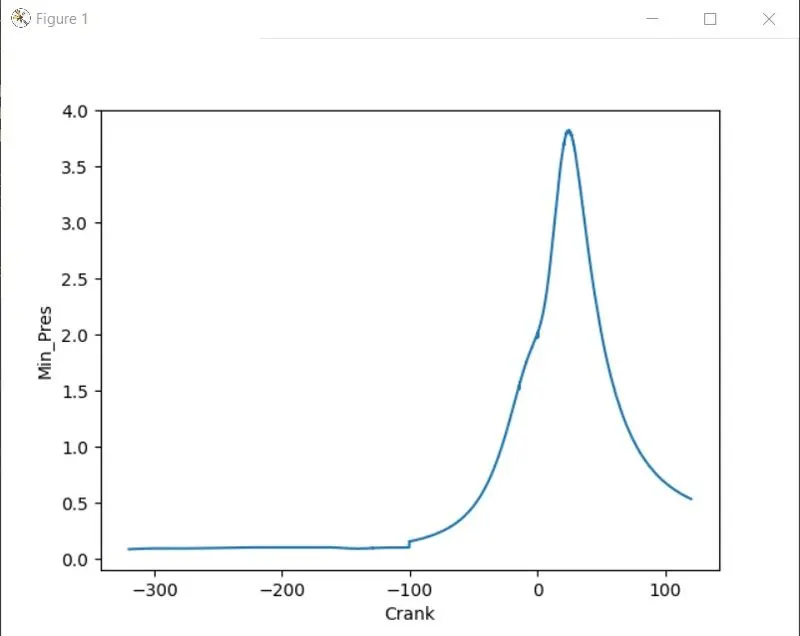
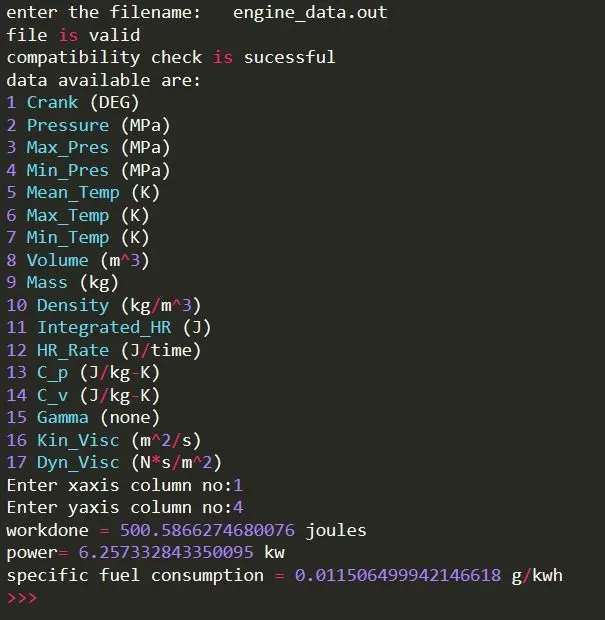
- the programme was sucessfull in reading and importing data from the file
- the calculations werw done and results are obtained
plot obtained between min_pressure and crank