Week 6 - Data analysis
Data analysis:-
It is defined as a process of cleaning, transforming, and modeling data to discover useful information for business decision-making. The purpose of Data Analysis is to extract useful information from data and taking the decision based upon the data analysis.
Data visualizer:-
Data visualization is the graphical representation of information and data. By using visual elements like maps, graphs, charts, and tables, data visualization tools provide an accessible way to see and understand trends, outliers, and patterns in data. In the world of Big Data, data visualization tools and technologies are essential to analyze massive amounts of information and make data-driven decisions.
Compatibility check:-
Compatibility Testing is a type of Non-functional testing and it is a type of Software testing to check whether your software is capable of running on different hardware, operating systems, applications, network environments, or Mobile devices. It can be of two types forward compatibility testing(Testing of the software in new or upcoming versions. It is also known as forward compatibility) and backward compatibility testing(Testing of the software in old or previous versions. It is also known as backward compatibility).
Code:-
# Moduels
import math  # for doing mathamatical calculations
import matplotlib.pyplot as plt  # for ploting
import numpy as np # numpy is used to +, -, *, /, power, and linspace for the arrays
from scipy.integrate import simps

line_count = 1
try:
	file = open('engine_data.out')
	print('file opened sucessfully \n')
except:
	print('file does not exist \n')

print('the plot parameters given below in the series \n')
print('1-Crank, 2-Pressure, 3-Max_pressure, 4-Min_pressure, 5-Mean_Temperature, 6-Max_temp, 7-Min_temp, 8-Volume, 9-Mass, 10-Density, 11-Integrated_hr, 12-HR_rate, 13-C_p, 14-C_v, 15-Gamma, 16-Kin_visc, 17-Dyn_visc')

first_column = input('enter the 1st column for the plot choose a number between 1(include) and 17(include): ')
second_column = input('enter the 2st column for the plot(choose a different column from column_number_1): ')
print('\n')

first_column = int(first_column)
second_column = int(second_column)

values_of_column_1 = []
values_of_column_2 = []

for line in open('engine_data.out'):
	if line_count is 3:
		column_name_1 = line.split()[first_column]
		column_name_2 = line.split()[second_column]
	if '#' not in line:
		values_of_column_1.append(float(line.split()[first_column-1]))
		values_of_column_2.append(float(line.split()[second_column-1]))

	line_count+= 1

# Area under curve that is work done
area = float(simps(values_of_column_1, values_of_column_2))
print('area:{}\n'.format(area))

# Given inputs
rpm = 1500
speed = rpm/60
power = area*speed
print('power:{}\n'.format(power))

mass_of_fuel = 20*pow(10,-6)
specific_fuel_consumption = mass_of_fuel/power
print('specific_fuel_consumption:{}\n'.format(specific_fuel_consumption))

# plotting
plt.figure()
plt.plot(values_of_column_2,values_of_column_1, linewidth=2, color='r')
plt.xlabel(column_name_1)
plt.ylabel(column_name_2)
plt.title('{} vs {}'.format( column_name_1,column_name_2))
plt.show()

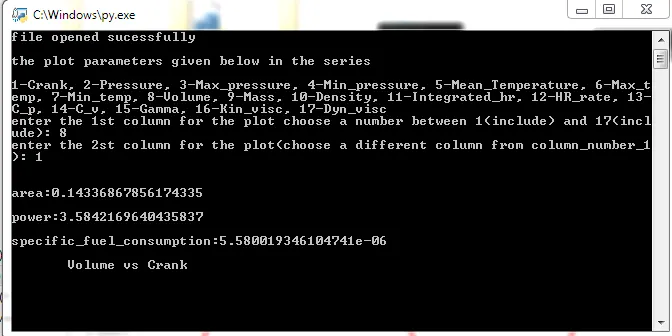
After saving the code we will get the solution like this in the command window which was shown in the above figure. Open the saved file and mention the column numbers and it will show the area, power, and specific heat consumption that belongs to the plots.
Result:-
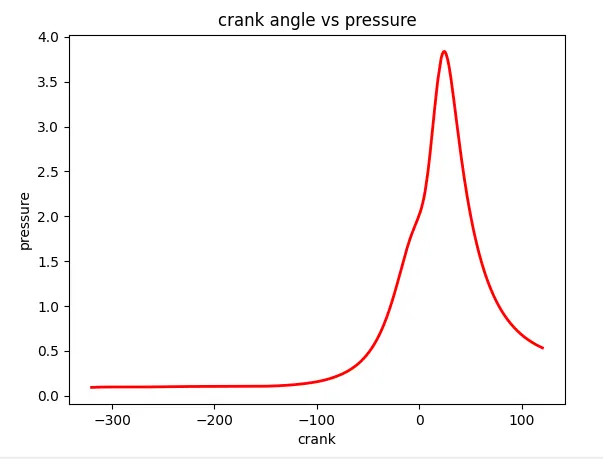
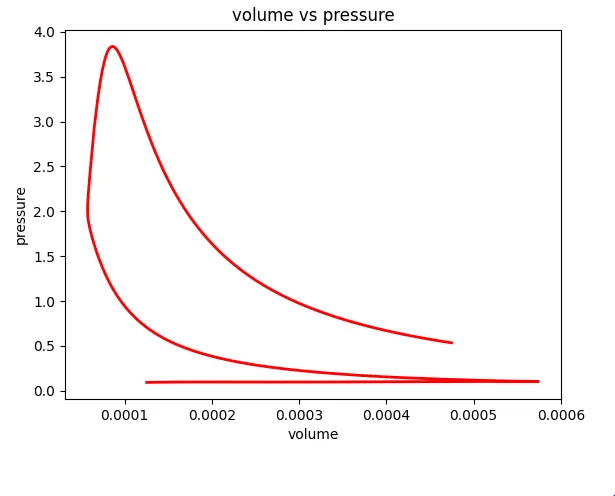
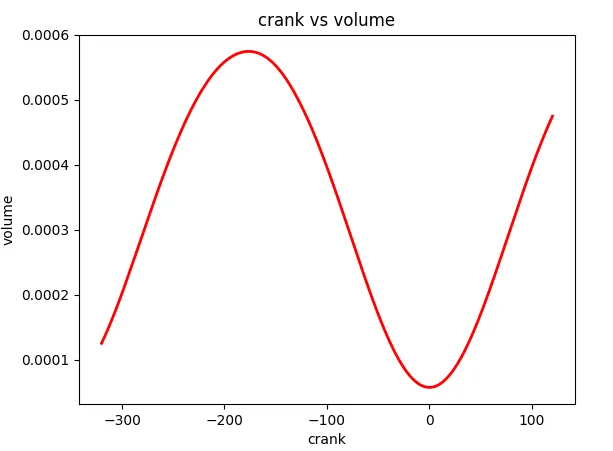
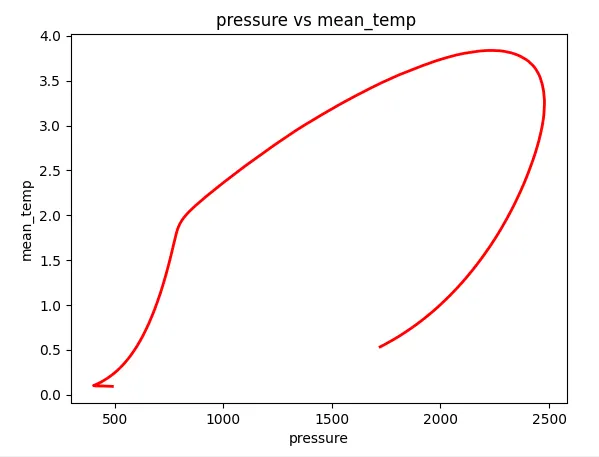
Like this, by changing the column numbers it shows different power, area, and specific heat consumption to each plot.