Week 6 - Data analysis
Title: Data analysis
Aim: To write a script that does the data visualization, Compatability check and Basic Performance calculation.
Objectives:
Data visualization:
- Your script should take column numbers as the input and plot the respective columns as separate images
- Each file should be saved by the name of the column
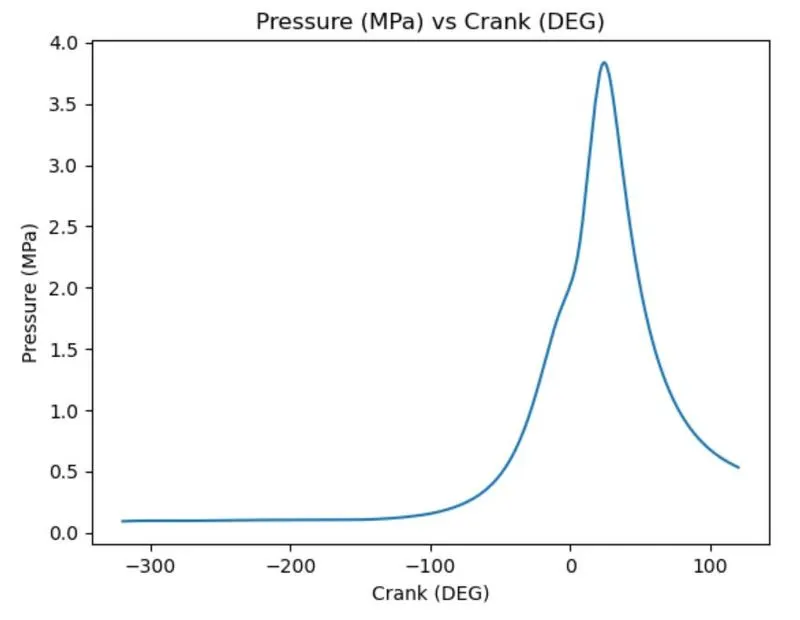
- The plot labels should be extracted from the file. If I request for a plot between column 1 (crank angle) and column 8(volume), then the label information should automatically be extracted and must appear as labels in the plots. THIS SHOULD NOT BE DONE MANUAL
Compatibility Check:
- Code should exit gracefully if a non-compatible file is provided as an input. It should say something like "File not recognized. Please provide a valid CONVERGE output file".
Basic performance calculation:
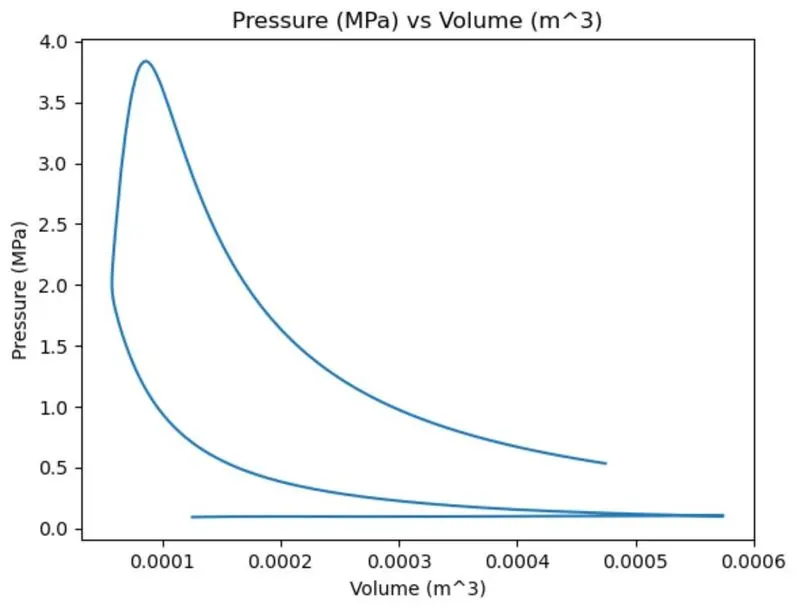
- Calculate the area under the P-V diagram. P is in column 2 and V is in column 8.
- Calculate the power output of this engine. Assume that RPM is 1500
- This engine consumed 20 micrograms of fuel (per 1 stroke cycle). Calculate its specific fuel consumption.
From the data file, we know it is a 4-Stroke otto cycle. We will calculate Work done, Power and specific fuel consumption.
A = Workdone per cycle(MJ) i.e., Area under the curve
P = Power i.e., A*N*`10^6` W
n = Number of Cycles per second
n = N/120 for, 4-stroke engine
n = N/60 for, 2-Stroke engine
N = Rotations per min
SFC(specific Fuel Consumption) = (Fuel Consumed in kg/hr)/(Power output in kW)
# Importing the libraries

import numpy as np
import matplotlib.pyplot as plt
from scipy.integrate import simps
import sys

# Placing Try-Except block

filename = input('CONVERGE output filename with extension(.out): ')

try:
	f = open(filename)
	f.close()
except FileNotFoundError:
	print('File Not recognized. Please provide a valid CONVERGE output file')
	sys.exit()

# Checking for Data presence in the CONVERGE output file

i = 0

for line in open(filename):
	if '#' not in line:
		break

	i = i + 1

j = 0

for line in open(filename):
	j = j + 1

	if j > 1:
		break

if j == i:
	print('No data present in the CONVERGE File')

# Data Extraction

i = 0
for line in open(filename):
	if  i == 2:
		c = line.split()
		i = 0
		break

	if i == 1:
		b = line.split()
		i = i + 1

	if 'column' in line.split():
		a = line.split()
		i = 1

# Removing 'column' and '#' from list a
a.remove('column')
a.remove('#')

# Converting dtype into 'int'

a = np.array(a,dtype = np.int)

# Removing '#' from list b & c

b.remove('#')

c.remove('#')

num_col = len(a)

# Reading the data

data_counter = 0

data = np.arange(0, num_col)

for line in open(filename):
	if '#' not in line:
		d = line.split()
		d = np.array(d, dtype = np.float32)
		data = np.vstack([data,d])
		data_counter = data_counter + 1

# Deleting 1st row

data = np.delete(data, 0, 0)

# Data Visualization

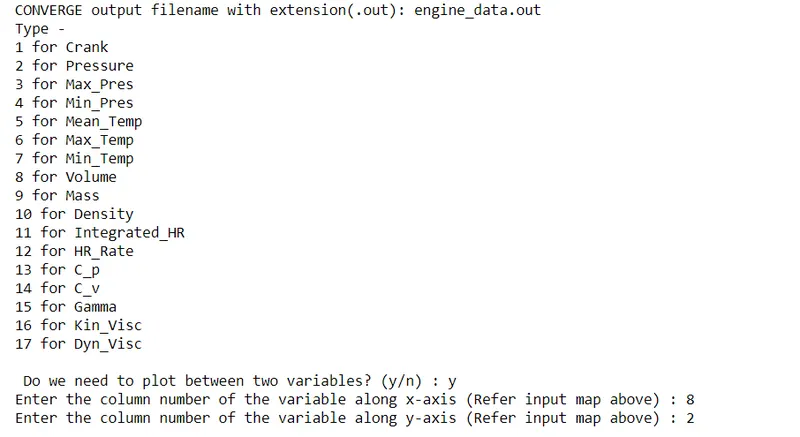
print('Type -')

for i in a:
	print(f'{i} for {b[i-1]}')

print(' ')

x = input(' Do we need to plot between two variables? (y/n) : ')

while(x.lower()== 'y'):
	cn1 = input("Enter the column number of the variable along x-axis (Refer input map above) : ")
	cn2 = input("Enter the column number of the variable along y-axis (Refer input map above) : ")

	cn1 = int(cn1)
	cn2 = int(cn2)

	plt.figure()
	plt.plot(data[:,cn1 - 1], data[:,cn2 - 2])

	plt.xlabel(f'{b[cn1-1]} {c[cn1-1]}')
	plt.ylabel(f'{b[cn2-1]} {c[cn2-1]}')

	plt.title(f'{b[cn2-1]} {c[cn2-1]} VS. {b[cn1-1]} {c[cn1-1]}')

	plt.show()
	print(' ')

	x = input('Do we want to plot any other two variables? (y/n): ')

print(' ')


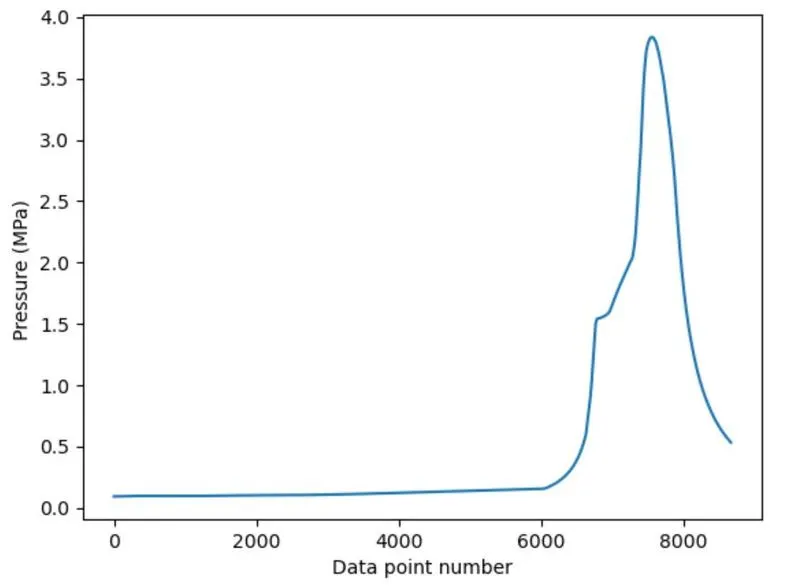
x = input('Do we want a single variable plot? (y,n): ')
while(x.lower() == 'y'):
	cn = input('Enter the column number of the variable (refer input map above): ')
	cn = int(cn)
	plt.figure()
	plt.plot(np.arange(0, data_counter), data[:,cn-1])
	plt.xlabel('Data Point Number')
	plt.ylabel(f'{b[cn-1]} {c[cn-1]}')

	plt.show()
	print(' ')

	x = input('Do you want any other single variable plot? (y/n): ')
print(' ')

# Output parameter calculations

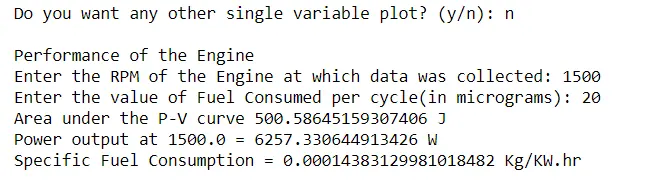
print('Performance of the Engine')

# Workdone

b1 = [i.lower() for i in b]
pressure_col = b1.index('pressure')
volume_col = b1.index('volume')
pressure = data[:, pressure_col]
volume = data[:, volume_col]

A = 0

A = simps(pressure, volume, even = 'first') * np.power(10,6)

# Power

rpm = float(input('Enter the RPM of the Engine at which data was collected: '))
f = float(input('Enter the value of Fuel Consumed per cycle(in micrograms): '))

n = rpm/(2*60)

P = A*n

# Specific Fuel Consumption

f = (f*n*3600)/ np.power(10,9)
sfc = (f*1000)/P

# Outputs

print(f'Area under the P-V curve {A} J')
print(f'Power output at {rpm} = {P} W')
print(f'Specific Fuel Consumption = {sfc} Kg/KW.hr')
Code Description:
1. Importing and Understanding of data using necessary modules. also Performed Compatibility test. Which checks file is a valid CONVERGE output file and its non-empty.
2. Extraction of data along with the column and column index from the output file. The columns of the data contain the data of each individual parameters.
3. Directions or commands to end-user to the variable to be plotted. With (y/n) selection.
4. With help of variable dependence we have calculated the performance factors.
Results: