Week 6 - Data analysis
Aim
To write a python code to do the data parsing of the given data file obtained from converge simulation.
Python code
"""
Python code for file parsing using the data file obtained from converge simulation

"""

import math
import matplotlib.pyplot as plt
import numpy as np


#User managed file opening
crank=[]
pressure=[]
max_pressure=[]
min_pressure=[]
temperature=[]
max_temperature=[]
min_temperature=[]
volume=[]
mass=[]
density=[]
Integrated_HR=[]
HR_rate=[]
cp=[]
cv=[]
gamma=[]
kinetic_viscosity=[]
dynamic_viscosity=[]
prop=[crank,pressure,max_pressure,min_pressure,max_temperature,min_temperature,volume,mass,density,Integrated_HR,HR_rate,cp,cv,gamma,kinetic_viscosity,dynamic_viscosity]
s=input("Enter the path of file\n")
# File initilization
try:
	values=open('engine_data.out','r')

except Filenotfound:
	print("File format unreadable, provide a Converge output file")
data=[]
for line in values:
	if '#' not in line:
		data.append(line.split())

data1=np.transpose(data)
data1=data1.astype(float)


# all parameters
choose=['crank_angle(deg)','Pressure','Max_pressure','Min_pressure','Mean_temperature','Max_temperature','Min_temperature','Volume','Mass','Density','Integrated_HR','HR_Rate','C_p','C_v','Gamma','Kin_visc','Dyn_visc']

print('These are the code number for the following number.Choose!!!')


# codes for the parameters
choose_num=['crank_angle=0','Pressure=1','Max_pressure=2','Min_pressure=3','Mean_temperature=4','Max_temperature=5','Min_temperature=6','Volume=7','Mass=8','Density=9','Integrated_HR=10','HR_Rate=11','C_p=12','C_v=13','Gamma=14','Kin_visc=15','Dyn_visc=16']
print(choose_num)

print("Press the code forfirst parameter(x-axis)")
x=int(input())
print("press the code for second parameter(y-axis)")
y=int(input())

# Calculating area under pv curve
volume=data1[7,:]
pressure=data1[1,:]*pow(10,6)

#plot from data
plt.plot(data1[x,:],data1[y,:],linewidth=3,color='black')
plt.xlabel(choose[x])
plt.ylabel(choose[y])
plt.title(choose[y]+ 'VS' +choose[x])
plt.show()

# for getting work done we integrate the area under the pv diagram
work=np.trapz(pressure,volume)*1000
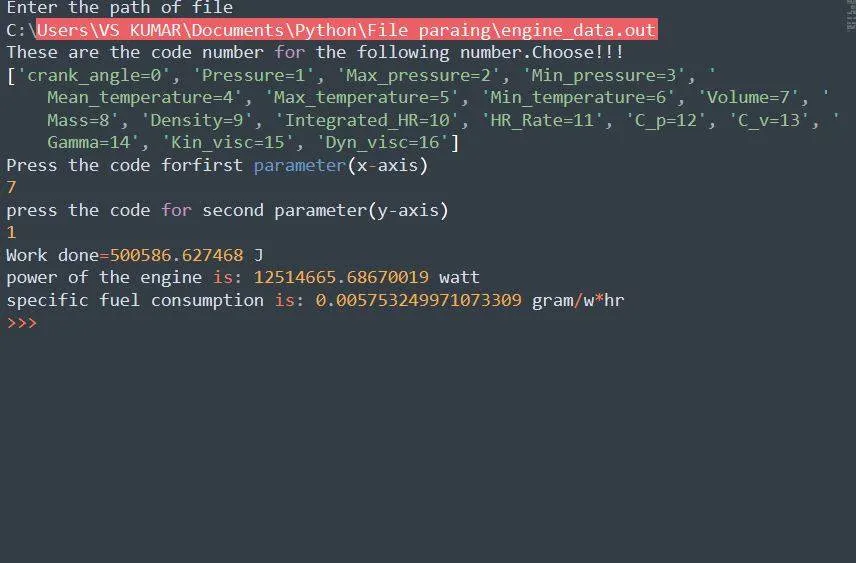
print("Work done={:f} J".format(work))

	# Assuming the engine to be 4 stroke and the power is produced in alternate cycle
speed=1500/60 # into rotation per second
power=work*speed
print('power of the engine is:',power,'watt')


	# Assuing fuel consumed per stroke is 20mg, fuel consumed per hr is equal to intake strokes ( in each alternate cycle) in an hr
consumption=20
sfc=(consumption*3600)/power
print('specific fuel consumption is:',sfc,'gram/w*hr')
Working of code
- Firstly the modules are imported into the python code which is required to carry out the calculations.
- Then various arrays are introduced in the code which will store the values of the parameters described in the data file which will be initialized
- Then the user input is described which initializes the file that has the data file.
- After the file is initialized then each of the parameters involved is increased incrementally as per their sequence in the given data file.
- The initialized file is having to converge as a name in itself and in this file, every data line which is presided by a hashtag will be not be read.
- Each parameter defined in the data file can be utilized to plot as per the requirement of the user.
- The column numbers of the properties to be plot is passed as an argument of the function 'user_input", which plots the graph along with the x-axis and y-axis labels obtained from the data file initialized.
- For calculation of work done 'trapz' function is used to integrate the area under PV curve and then display it in the command window.
- Through the above way power as well as specific consumption of fuel can also be calculated using the required mathematical formulas and then can be displayed in the command window.
Plots
- Pressure VS Volume
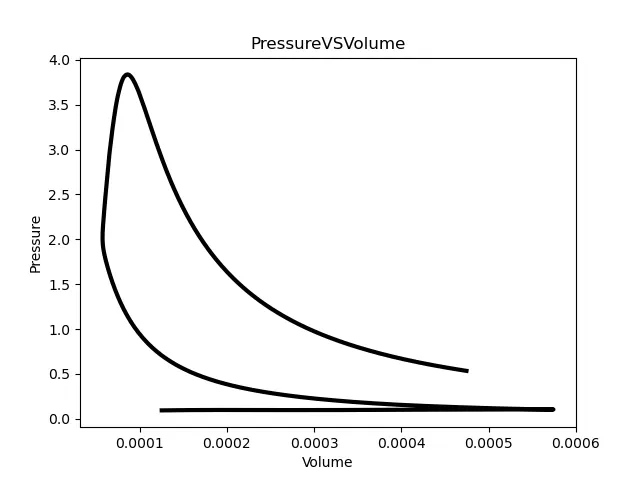
- Temperature VS Volume
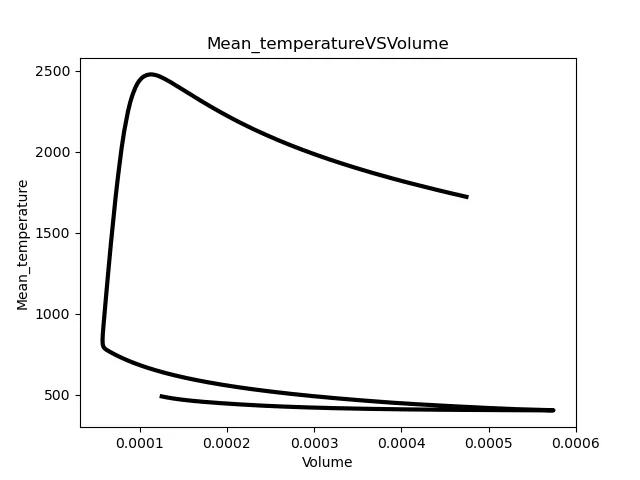
Results
- Calculations for work done, power of engine and specific fuel consumption.
Conclusion
A python code has been successfully generated to do the data parsing of the given data file obtained from Converge simulation from the user inputs.