Week 6 - Data analysis
OBJECTIVE:-
1)To create a script that take column numbers as the input and plot the respective columns as separate images
2)Each file should be saved by the name of the column
3)The plot labels should be extracted from the file. If an user request for a plot between column 1 (crank angle) and column 8(volume), then the label information should automatically be extracted and must appear as labels in the plots
4)The code should exit gracefully, if a non-compatible file is provided as an input. It should say something like "File not recognized. Please provide a valid CONVERGE output file"
5)To Calculate the area under the P-V diagram. P is in column 2 and V is in column 8.
6) To Calculate the power output of this engine. Assume that RPM is 1500
7) To Calculate its specific fuel consumption if the engine consumes 20 micro grams of fuel (per 1 stroke cycle).
SOLUTION PROCEDURE:-
- The data file name is accepeted from the user by 'input' command and the file name is taken for compatibility check.
- All the data values from the data file excluding the names and units of parameters are stored in another array by 'append' command
- The two parameters are accepted from the user with column number as a reference number.(i.e if volume is in 2nd column then it can be selected as a parameter by just entering its corresponding index)
- A plot is created between the two parameters selected.
- x and y label is created on the plot automatically by using the python code plt.xlabel(parameter[x]) and plt.ylabel(parameter[y]) .
- The file name of the plot created is saved with its corresponding variable names automatically by using the python code 'plt.savefig(parameter[y]+ 'vs' +parameter[x]+'.png')
If the plot is between pressure and volume then, the area under p-v diagram is to be calculated and the power is to be calculated with the help of the following formulas.
The code is as follows:-
import math
import matplotlib.pyplot as plt
import numpy as np
#taking input of file name from the user.
file_name=input('Enter the converge file name:')
try:
	data=open(file_name,'r')
	print('\ndata file is opened successfully')
except FileNotFoundError:
	print('\nFile not recognized, please provide a valid converge output file')
#creating empty array for storing only data values and excluding  the parameters names and unit
data_val=[]
#creating empty array for pressure
pressure=[]
#creating empty array for volume
volume=[]
for line in data:
	if '#' not in line:
		data_val.append(line.split())
		pressure.append(float(line.split()[1]))
		volume.append(float(line.split()[7]))
parameter=[ 'Crank' , 'Pressure' , 'Max_Pressure' , 'Min_Pressure', 'Mean_Temp' , 'Max_Temp', ' Min_Temp',  'Volume' , 'Mass' , 'Density' ,'Integrated_HR' , 'HR_Rate' ,  'C_p'  , 'C_v',   'Gamma'  ,'Kin_Visc'  , 'Dyn_Visc']
print('\n')
#printing all the parameters with corresponding code number.
print('select the parameter from the list given below by entering corresponding number')
i=0
for i in range(0,17):
	print(parameter[i],'-',i)
	i=i+1

print('\n')
#accepting values for first parameter
print('select the first parameter (independent variable)\n')
x=int(input())
print('\n')
print('first parameter selected is ',parameter[x])
print('\n')

#accepting values for second parameter
print('select the second  parameter (dependent variable)\n')
y=int(input())

print('second parameter selected is ',parameter[y])

col=np.transpose(data_val)
col=col.astype(float)

plt.plot(col[x,:],col[y,:])
plt.xlabel(parameter[x])
plt.ylabel(parameter[y])
plt.title(parameter[y]+ ' vs ' +parameter[x])
plt.savefig(parameter[y]+ ' vs ' +parameter[x]+'.png')

plt.show()
if x is 7 and y is 1:
	rpm=1500
	#area under p-v diagram
	area=np.trapz(pressure,volume)
	w_d=area*1000
	#power of the engine
	p=(2*math.pi*rpm*w_d)/60
	#fuel consumption per stroke
	f_con_str=20*1e-6
	#fuel consumption per hour
	f_con_hour=f_con_str*rpm*(0.5/60)*3600
	#specific fuel consumption
	sfc=f_con_hour/p
	print('\n')
	print('area under p-v diagram (work done):-',w_d,'KJ')
	print('\n')
	print('power output of the engine:',p,'KW')
	print('\n')
	print('specific fuel consumption of the engine:',sfc,'g/KWh')
RESULT:-
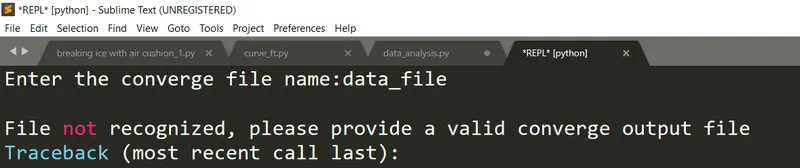
1) When a non existing file name is entered or if the data file is not saved in the same folder where the python file is saved, then the following result is obtained in the script.
2) when a valid data file name is entered the following result is obtained.

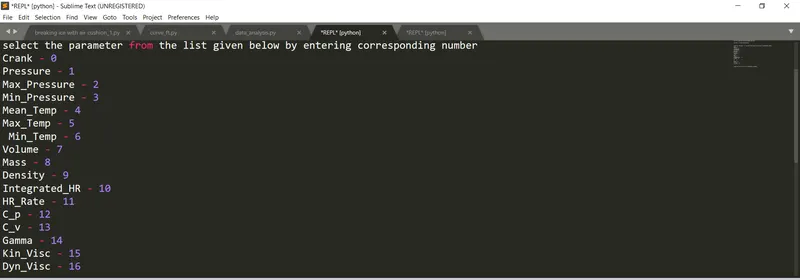
3)The list of parameters is as shown below and the parameter is selected with corresponding number.
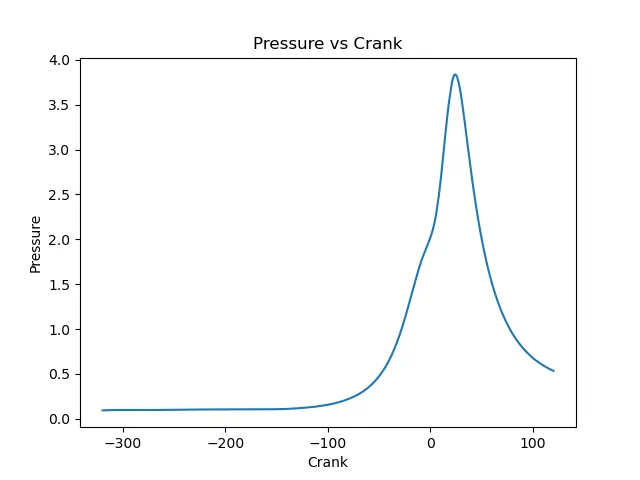
4) if '0' and '1' are the column index selected then a plot of pressure vs crank angle is generated.
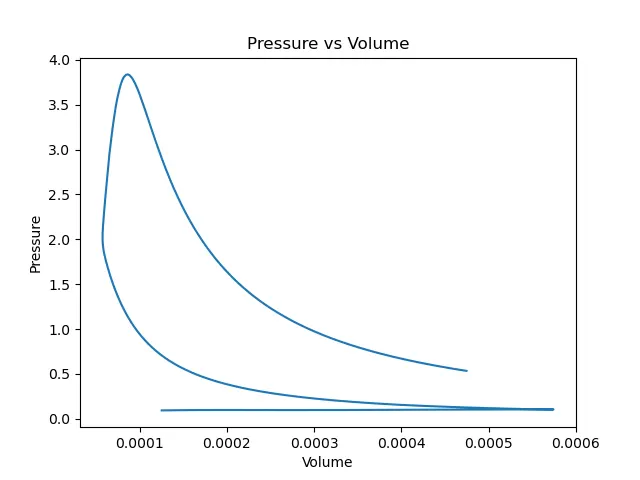
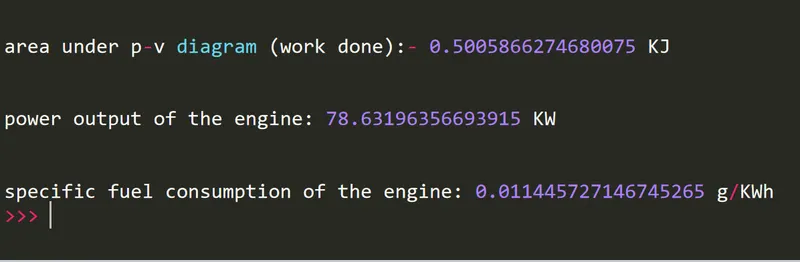
5) If the column index selected is '7' and '1' then a plot of pressure vs volume is generated and the area under p-v diagram is calculated.