Week 6 - Data analysis
AIM: To create a data visualizer tool that does the following things.
Data visualizer
- Your script should take column numbers as the input and plot the respective columns as separate images
- Each file should be saved by the name of the column
- The plot labels should be extracted from the file. If, I request for a plot between column 1 (crank angle) and column 8(volume), then the label information should automatically be extracted and must appear as labels in the plots. THIS SHOULD NOT BE DONE MANUALLY
Compatability check
- You code should exit gracefully, if a non-compatible file is provided as an input. It should say something like "File not recognized. Please provide a valid CONVERGE output file"
Basic performance calculation
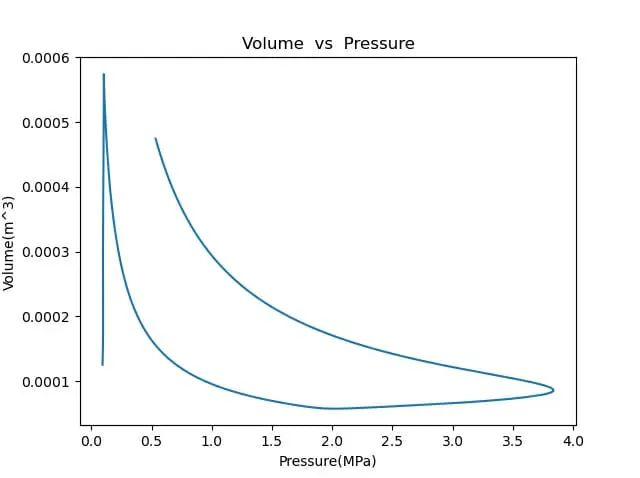
- Calculate the area under the P-V diagram. P is in column 2 and V is in column 8.
- Calculate the power output of this engine. Assume that RPM is 1500
- This engine consumed 20 micro grams of fuel (per 1 stroke cycle). Calculate its specific fuel consumption.
Python code:
import matplotlib.pyplot as plt
import math
import numpy as np
from numpy import trapz

print('General Instruction')
print('Please Make Sure that the CONVERGE data file is saved in the same path directory where Python code is saved.')
# file_name = input('Enter the CONVERGE file having .out Extension : ')

# Compatibility Check
try:
    data = open('engine_data.out', 'r')
    print('\nData file is succesfully opened.')

except FileNotFoundError:
    print('\nPlease Enter a valid filename.\n')

line_count = 1
for line in data:
    if line_count == 3:
        Parameter = line.split()
        Columns = len(Parameter)
        print('\nThis CONVERGE file contains following data which is derived from I.C.Engine Simulation :')
        print('It has total %d Data Columns' % (Columns - 1))  # First Column '#' has no data.

        for Line in data:
            if line_count == 4:
                Unit = Line.split()
            break

        for C_no in range(1, Columns):
            print(C_no, line.split()[C_no], Line.split()[C_no])
        break
    line_count = line_count + 1

print('\nChoose any Two Parameter From Above.')
print('Enter a Number Corresponding to Parameter 1 to 17.\n')
x = 2  # int(input("Enter X-axis Parameter : "))
y = 8  # int(input("Enter Y-axis Parameter : "))

x_data = []
y_data = []

line_count = 1
for line in open('engine_data.out', 'r'):
    if line_count == 3:
        X_label = line.split()[x]
        Y_label = line.split()[y]
        if line_count <= 4:
            x_label = line.split()[x] + Line.split()[x]
            y_label = line.split()[y] + Line.split()[y]

    if '#' not in line:
        x_data.append(float(line.split()[x - 1]))
        y_data.append(float(line.split()[y - 1]))

    line_count = line_count + 1

filename = Y_label + ' vs ' + X_label + '.png'

plt.figure()
plt.plot(x_data, y_data)
plt.xlabel(x_label)
plt.ylabel(y_label)
plt.title(Y_label + '  vs  ' + X_label)
plt.savefig(filename)
plt.show()

if x == 8 and y == 2:
    RPM = 1500
    Area = np.trapz(y_data, x_data)  # In MJ
    Workdone = Area * 1000  # In KJ
    Power = 2 * math.pi * RPM * Workdone / 60  # In KW
    Fuel_per_Stroke = 20 * 1e-6  # In grams per stroke
    Fuel_per_Sec = Fuel_per_Stroke * RPM * (0.5 / 60)  # In grams per second
    Fuel_per_Hour = Fuel_per_Sec * 3600  # In grams per hour
    BSFC = Fuel_per_Hour / Power  # In g/KWh

    print('Area under the P-V diagram(Workdone) :', Workdone, 'KJ')
    print('Power Output of this Engine :', Power, 'KW')
    print('Specific Fuel Consumption :', BSFC, 'g/KWh')

RESULT:

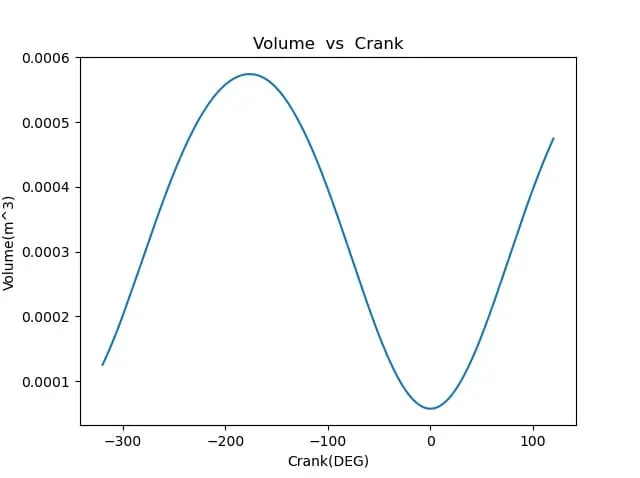
Effect of cranck angle on volume:
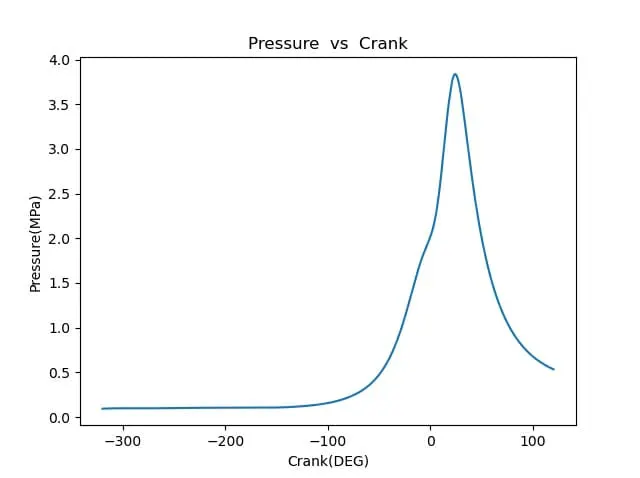
Effect of crank angle on pressure:
P-V Diagram:
Output:
Area under the P-V diagram = 5005866274680075 KJ
Power output of the engine = 78.63196356693915 KW
Specific fuel consumption =0.0076304847644968424 g/KWh