Week 6 - Data analysis
Aim:It is to create the data visulizer tool for the following things to perform:
1.Data visualizier
2.Compatability check
3.Basic performance calulation
Theory:
1.Data visualizer:In this data visualizer, take columns as inputs,there each file should be saved by the name of the coloum,now plot the coloumns as seperate images.
2.compatability check:Our code should exit in a clean way when the non compatible file provided as input
3.Basic performance calcualtions:We will calculate the area under the P-V diagram
Procedure:The required program for the data analysis is:
import matplotlib.pyplot as plt
import math
import numpy as np
from numpy import trapz
print('General Instruction')
print('Please Make Sure that the CONVERGE data file is saved in the same path directory where Python code is saved.')
file_name = input('Enter the CONVERGE file having .out Extension : ')
#Compatibility Check
try :
data = open('file_name','r')
print('\nData file is succesfully opened.' )
except FileNotFoundError:
print('\nPlease Enter a valid filename.\n')
line_count = 1
for line in data:
if line_count==3:
Parameter = line.split()
Columns = len(Parameter)
print('\nThis CONVERGE file contains following data which is derived from I.C.Engine Simulation :')
print('It has total %d Data Columns' %(Columns-1)) #First Column '#' has no data.
for Line in data:
if line_count ==4:
Unit =Line.split()
break
for C_no in range(1,Columns):
print(C_no,line.split()[C_no],Line.split()[C_no])
break
line_count = line_count + 1
print('\nChoose any Two Parameter From Above.')
print('Enter a Number Corresponding to Parameter 1 to 17.\n')
x = 2#int(input("Enter X-axis Parameter : "))
y = 8#int(input("Enter Y-axis Parameter : "))
x_data = []
y_data = []
line_count = 1
for line in open('engine_data.out','r'):
if line_count == 3:
X_label = line.split()[x]
Y_label = line.split()[y]
if line_count<=4:
x_label = line.split()[x] + Line.split()[x]
y_label = line.split()[y] + Line.split()[y]
if '#' not in line:
x_data.append(float(line.split()[x-1]))
y_data.append(float(line.split()[y-1]))
line_count = line_count + 1
filename = Y_label + ' vs ' + X_label + '.png'
plt.figure()
plt.plot(x_data,y_data)
plt.xlabel(x_label)
plt.ylabel(y_label)
plt.title(Y_label + ' vs ' + X_label)
plt.savefig(filename)
plt.show()
Results:The graphs of volume vs pressure,pressure vs crank and volume vs crank are plotted
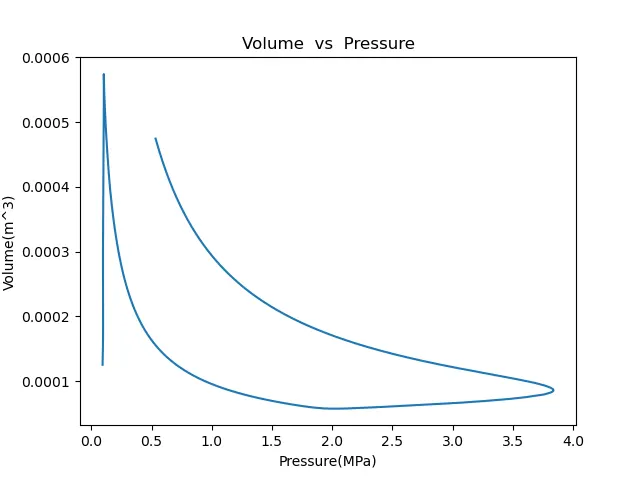
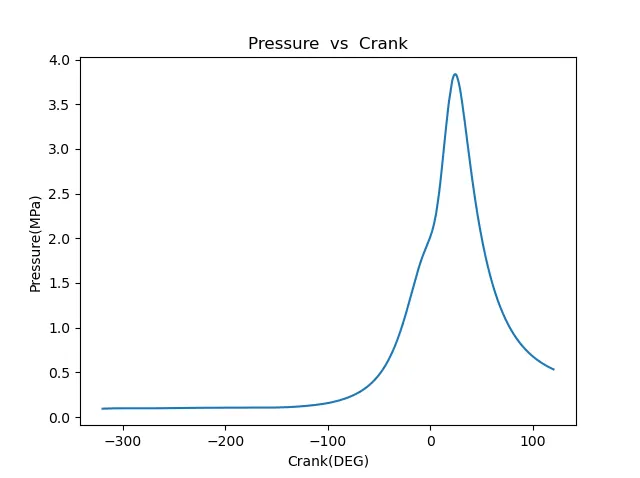
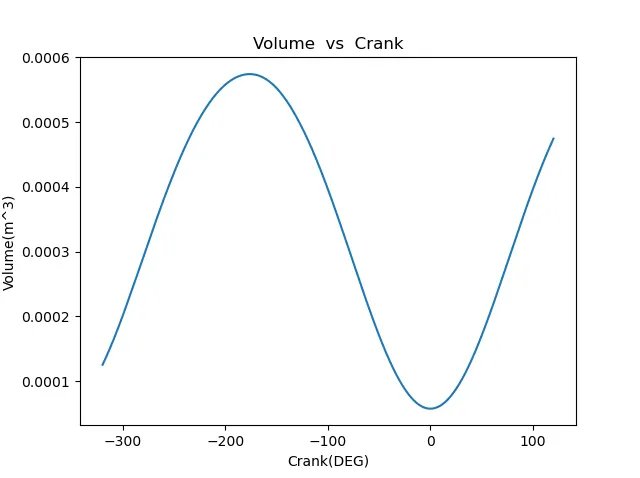
1.The area under the P-V diagram is:0.0005005866274680075
2.The power output of this engine: 0.07863196356693915
3.The specific feul consumption is:0.0076304847644968424
Conclusion:The basic calculations were performed using python like,Area under P-V Diagram,Power output of this engine and Specific feul consumption were obtained and the graph which helps the behaviour of pressure,volume,crank is determined.