Week 6 - Data analysis
AIM :
Data visualizer (100 points)
- Your script should take column numbers as the input and plot the respective columns as separate images
- Each file should be saved by the name of the column
- The plot labels should be extracted from the file. If, I request for a plot between column 1 (crank angle) and column 8(volume), then the label information should automatically be extracted and must appear as labels in the plots. THIS SHOULD NOT BE DONE MANUALLY
Compatability check (30 points)
- You code should exit gracefully, if a non-compatible file is provided as an input. It should say something like "File not recognized. Please provide a valid CONVERGE output file"
Basic performance calculation (50 points)
- Calculate the area under the P-V diagram. P is in column 2 and V is in column 8.
- Calculate the power output of this engine. Assume that RPM is 1500
- This engine consumed 20 micro grams of fuel (per 1 stroke cycle). Calculate its specific fuel consumption.
THEORY :
Power output = 2 * pi * RPM * Area / 60
Specific fuel consumption = Fuel consumption per hour / Power output
PROCEDURE :
import matplotlib.pyplot as plt
import math
import numpy as np


filename = input('Enter the filename: ')
if '.out' not in filename:
	print('Error : Please provide a valid CONVERGE output file')
else:
	line_count = 1
	for line in open(filename,'r'):
		if line_count==2:
			column_no = line.split()[2:]
		if line_count==3:
			parameters = line.split()[1:]
		line_count += 1

	c_p = {}
	for i in range(0,len(column_no)):
		c_p[column_no[i]] = parameters[i]
	print(c_p)

x = int(input('Enter the column number of your x axis parameter using the given dictionary: '))
y = int(input('Enter the column number of your y axis parameter using the given dictionary: '))

x_val = []
y_val = []

line_count = 1
for line in open(filename,'r'):
	if line_count == 3:
		x_label = line.split()[x]
		y_label = line.split()[y]
	if '#' not in line:
		x_val.append(float(line.split()[x-1]))
		y_val.append(float(line.split()[y-1]))
	line_count+=1
plt.plot(x_val,y_val)
plt.xlabel(x_label)
plt.ylabel(y_label)
plt.show()

#Calculating area, power output and specific fuel consumption for PV
if x == 8 and y == 2:

	area = np.trapz(y_val,x_val)
	rpm = 1500
	power_out = 2*math.pi*rpm*area/60
	fuel_stroke = 20*1e-6
	fuel_hour = fuel_stroke * 30
	specific_fuel_cons = fuel_hour/power_out

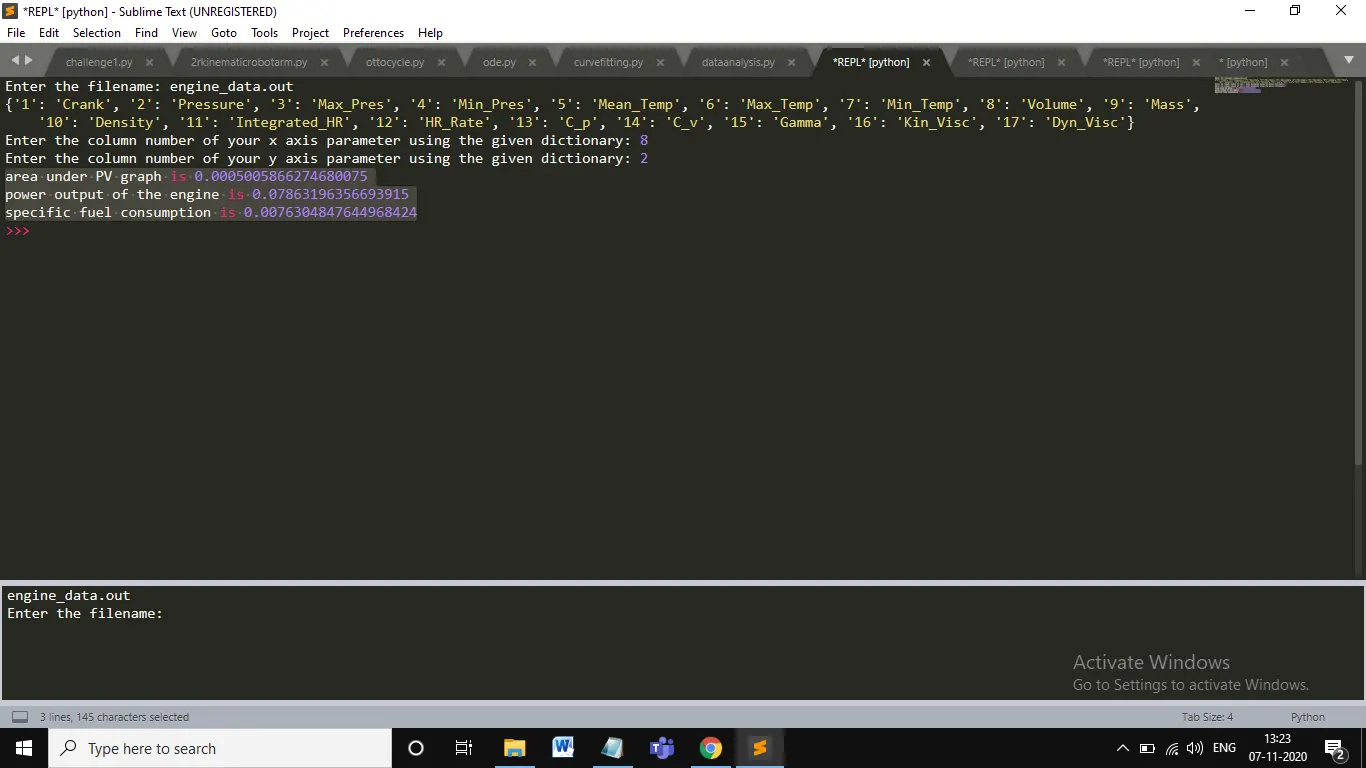
	print('area under PV graph is',area)
	print('power output of the engine is',power_out)
	print('specific fuel consumption is',specific_fuel_cons)
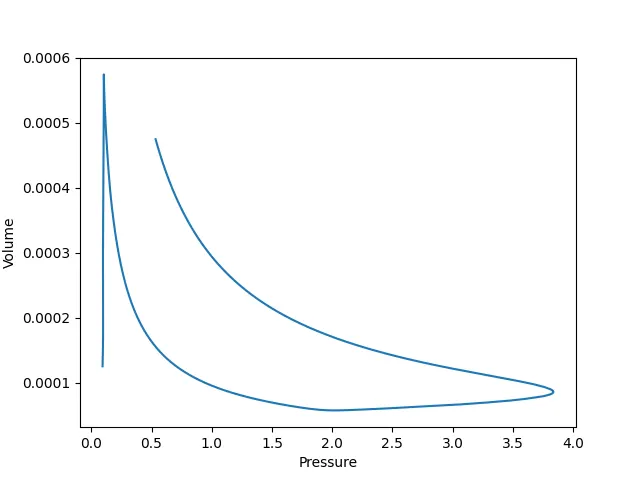
Using the above code, I was able to plot the graph for the parameters that the user inputs.
And later with the help of trapz method from the numpy module, I was able to calculate the area under the PV graph with was further used to calculate power output and the specific fuel consumption.
RESULT :
Pressure vs Mean temperature values plot
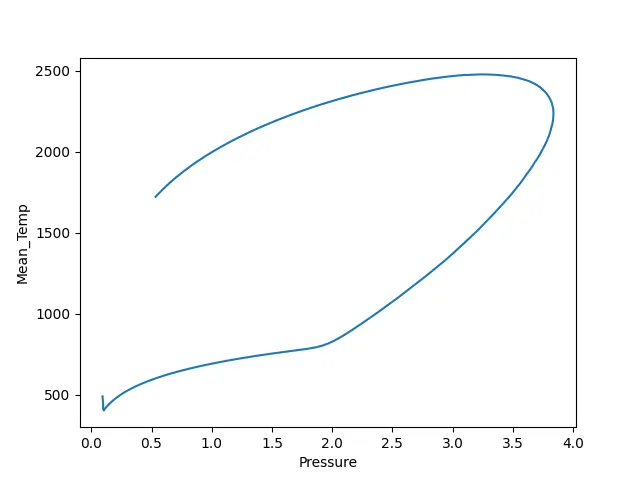
Pressure vs Volume plot