Data analysis using Python
Aim: To write a program that works as a data visualizer, performance calculator, with a compatibility check.
Governing Equations:
speed = rpm/60
power = speed*area
specific fuel consumption = m/power
In the above equation, m denotes the mass of the fuel consumed and is in micro grams
Speed is in m/s
The area is in meters
The engine power output is in KiloWatts
Specific Fuel Consumption is in g/KWhr
Values:
RPM is 1500
Equation Description: The governing equations are derived from the basics of an internal combustion engine.
Objectives:
To make a Data visualizer:
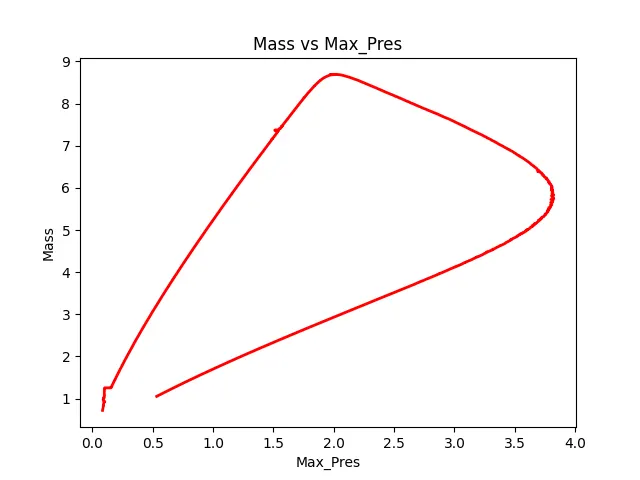
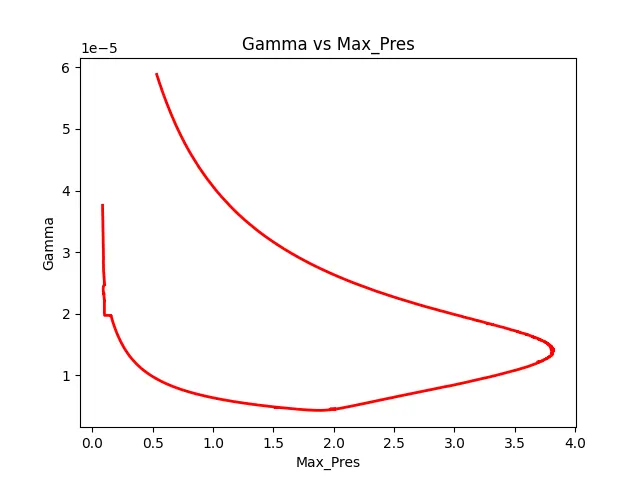
The script should take column numbers as the input and plot the respective columns as separate images. Each file should be saved by the name of the column
The plot labels should be extracted from the file.
Compatibility check:
code should exit gracefully if a non-compatible file is provided as an input. It should say something like "File not recognized. Please provide a valid CONVERGE output file"
Basic performance calculation:
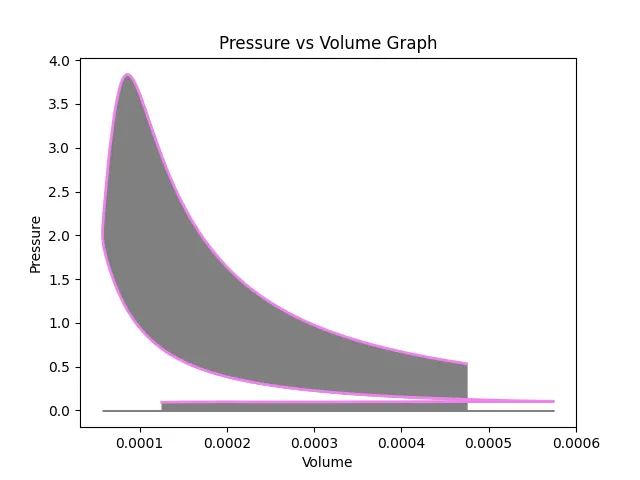
Calculate the area under the P-V diagram. P is in column 2 and V is in column 8.
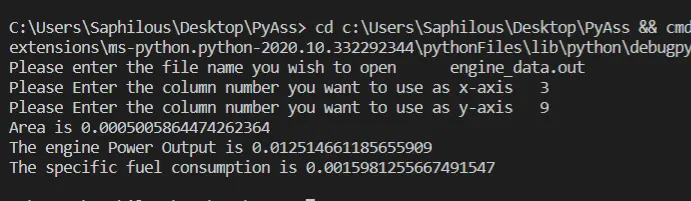
Calculate the power output of this engine. Assume that RPM is 1500
This engine consumed 20 micrograms of fuel (per 1 stroke cycle). Calculate its specific fuel consumption.
Solution Flow:
First, we have to check for file compatibility and then whether the file is present or not. Once that is done, we have to take column number inputs from the user.
Then, using a for loop, we’ll iterate line by line and obtain the labels for the plots and the data. We’ll then store the data in empty arrays. Using the matplotlib, we can then plot the graphs and label them accordingly.
Using the governing equations, we can calculate all the required parameters.
Body:
Programming Language Used: Python 3.8.6 (since 3.9 doesn't yet have the matplotlib modules added)
Code:
import math
import numpy as np
from scipy.integrate import simps
import matplotlib.pyplot as plt
import os
import sys

#The code starts

def fileformatchecker():
    fileinput = input('Please enter the file name you wish to open      ')
    fileformat = fileinput.split('.')
    if(fileformat[1] != 'out'):
        print('The format you entered is not supported. Please enter a valid CONVERGE output file')
        return fileformatchecker()
    return(fileinput)

try:
    inputfilename = fileformatchecker()
    fileopened = open(inputfilename)
except:
    print('The Input file is not found')
    sys.exit(1)

col1 = input('Please Enter the column number you want to use as x-axis   ')
col2 = input('Please Enter the column number you want to use as y-axis   ')

val1 = []
val2 = []
count = 1
col1name = 'none'
col2name = 'none'
for line in open(inputfilename):

    if(count == 3):
        col1name = line.split()[int(col1)]
        col2name = line.split()[int(col2)]
    if '#' not in line:
        val1.append(float(line.split()[int(col1)]))
        val2.append(float(line.split()[int(col2)]))

    count+=1

#basic perf calculation

pressurevals =[]
volumevals = []

for line in open(inputfilename):

    if '#' not in line:
        pressurevals.append(float(line.split()[1]))
        volumevals.append(float(line.split()[7]))

area=float(simps(pressurevals, volumevals))

print('Area is ' + str(area))

rpm = 1500
speed = rpm/60
power = speed*area
print('The engine Power Output is ' + str(power))

FuelMass = 20*pow(10, -6)
specfuel = FuelMass/power
print('The specific fuel consumption is ' + str(specfuel))


plt.plot(val1, val2, color = 'red', linewidth = 2)
plt.xlabel(col1name)
plt.ylabel(col2name)
filenametosave = str(col2name) + ' vs ' + str(col1name) + '.png'
plt.title(filenametosave)
plt.savefig(filenametosave)
plt.show()
plt.clf()

plt.plot(volumevals, pressurevals, color = 'violet', linewidth = 2)
plt.xlabel('Volume')
plt.ylabel('Pressure')
plt.fill_between(volumevals, pressurevals, color = 'gray')
plt.title('Pressure vs Volume Graph')
plt.show()
Code Explanation:
In the first few lines, the required modules are imported. Then, we are defining a conditionally recursive function to check the file format. If the file is not in the CONVERGE output format, we are prompting the user to enter the file name again. If the file is not found, the code exits with an error message to the terminal.
If everything is correct, the user will be prompted to enter the two-column numbers to plot the graph. After the user enters the column numbers, we are using for loop to get the names and the values of those columns and storing them.
Then we are calculating basic performance as asked in the question. The governing equations are used to calculate the required parameters. Then, we are plotting the graph between the user-entered columns, and the PV area curve.
Output:
Performance Values:
Compatibility Check:
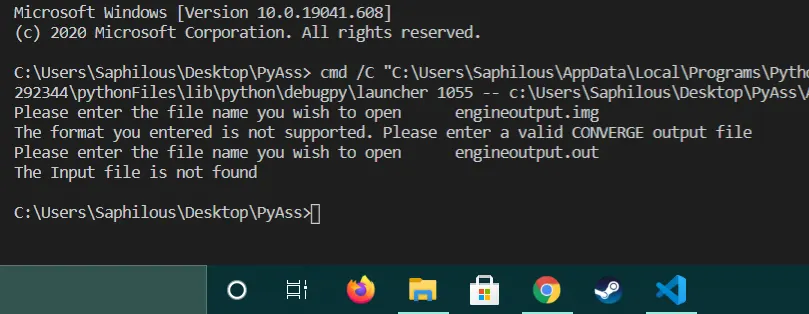
Results:
We obtained the required graphs and the compatibility check was successful. From the output code, we can see that,
The area under the PV curve is 0.500050058 m
The engine power output is 0.0125 KiloWatts
Specific Fuel Consumption is 0.001598 g/KWhr
Conclusion:
The necessary plots are obtained, and the parameters are calculated.