Week 6 - Data analysis
Title: write a Python code to create data visualizer tools.
Introduction:
Python is a general-purpose programming language and is widely used for data analysis. Almost all cloud data platforms offer python-support and often new features become available in the python program first.
To start programming this problem we have to import matplotlib.pyplot and import math libraries first.
When we will create empty arrays storing the various values of different properties of engines.
After that we will create a “for loop” and then we will append all the values of each individual engine properties.
We have used except the command so that if the data file mentioned above is not present in the folder then it will be print ‘file not recognized’.
Float and line.slit command so that if the data for specific engine values in their respective columns.
Then we have plotted the required plots of pressure vs. volume and max_pressure vs. crank angle.
And lastly, we calculate the value of area under PV, Power of engine in [ KW & HP] specific fuel consumption in g/kWh.
Stape 1: Write code to visualize the engine data file.
'''
Write a program to creat a data visulizer tool

Code writen by Md.rubayat Alam riad
'''
import numpy as np
import math
import matplotlib.pyplot as plt

# Data extracting

Crank=[]
pressure=[]
max_pressure=[]
min_pressure=[]
mean_temperature=[]
max_temperature=[]
min_temperature=[]
volume=[]
mass=[]
density=[]
integrate_hr=[]
hr_rate=[]
C_p=[]
c_v=[]
gamma=[]
kin_visc =[]
dyn_visc=[]

ct = 1


try:
	open('engine_data.out')

except Wrroing_input_file:
   print('file not recognized.Please provide a valiod Converge output file')

for line in open('engine_data.out'):

   if '#'   not in line:
     Crank.append(float(line.split()[0]))
     pressure.append(float(line.split()[1]))
     max_pressure.append(float(line.split()[2]))
     min_pressure.append(float(line.split()[3]))
     mean_temperature.append(float(line.split()[4]))
     max_temperature.append(float(line.split()[5]))
     min_temperature.append(float(line.split()[6]))
     volume.append(float(line.split()[7]))
     mass.append(float(line.split()[8]))
     density.append(float(line.split()[9]))
     integrate_hr.append(float(line.split()[10]))
     hr_rate.append(float(line.split()[11]))
     C_p.append(float(line.split()[12]))
     c_v.append(float(line.split()[13]))
     gamma.append(float(line.split()[14]))
     kin_visc.append(float(line.split()[15]))
     dyn_visc.append(float(line.split()[16]))


plt.plot(Crank,pressure, color='green',linewidth=3.5)
plt.xlabel('crank angle, deg')
plt.ylabel('pressure, bar')
plt.title('PV diagram')
plt.grid()
plt.show()
plt.plot(volume,pressure,linewidth=3)
plt.xlabel('volume, m^3')
plt.ylabel('pressure, Bar')
plt.grid()
plt.show()


area =np.trapz(pressure,volume)
print('Area under PV =', area)
rpm = 1500
rps= rpm/60
powerwatt = area*rps*1000
powerhp=powerwatt/0.746
print('power of engine output=', powerwatt,'in kwatt ,when rpm is 1500')
print('Power of engine is', powerhp, 'in horsepower')

sfc = (20*pow(10,-6)*3600)/(0.08*powerwatt)
print('specific fuel consumption is', sfc, 'in g/kwh')
Step 2: Results
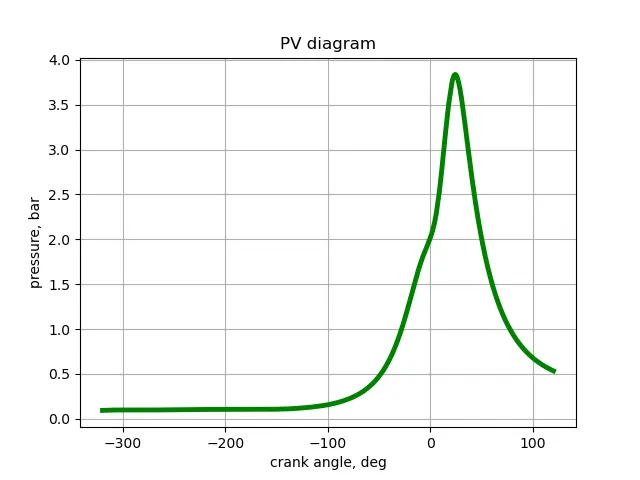
The plot shows the maximum pressure vs. crank angle graph.
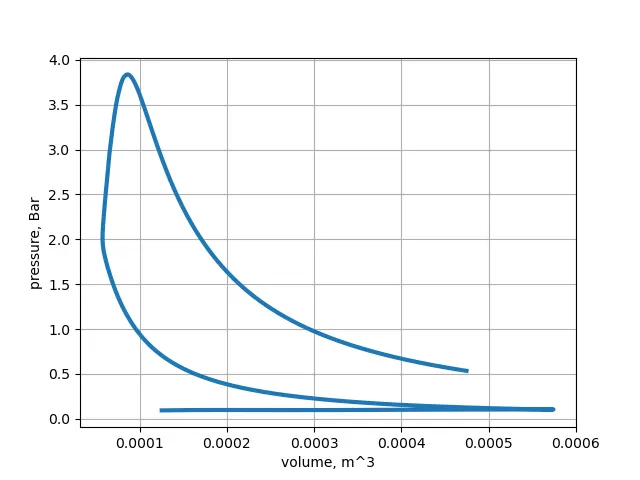
The plot shows pressure vs. volume graph.
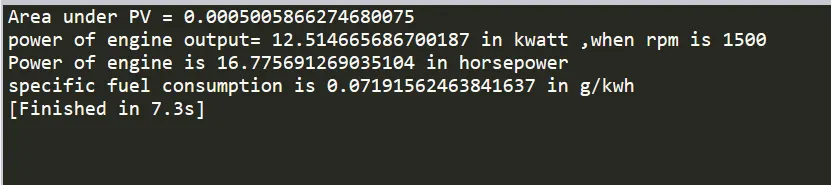
The image shows the area under PV, Power of engine in [ KW & HP], and specific fuel consumption in g/kWh.
Step 3: Consultation
WE can understand to import data sets for each and every value shown in the Engine data file.
We can learn to extract data from data use them for specific purposes.