Study of Data analysis using python
Study of Data analysis using python
AIM:
Write a script to analyse data using python
OBJECTIVE:
- Data visualizer: We have to plot graphs between any two parameters according to the user given input
- Compatibity Check: You code should exit gracefully, if a non-compatible file is provided as an input. It should say something like "File not recognized. Please provide a valid CONVERGE output file"
- Basic performance calculation: We have to Calculate the area under the P-V diagram. Pis in column 2 and V is in column 8, And Calculate the power output of this engine. Assume that RPM is 1500.This engine consumed 20 micro grams of fuel (per 1 stroke cycle). Calculate its specific fuel consumption
THEORY:
Data analysis is a process of inspecting, cleansing, transforming and modeling data with the goal of discovering useful information, informing conclusions and supporting decision-making. Data analysis has multiple facets and approaches, encompassing diverse techniques under a variety of names, and is used in different business, science, and social science domains. In today's business world, data analysis plays a role in making decisions more scientific and helping businesses operate more effectively.
Data analysis is a somewhat abstract concept to understand without the help of examples. So to better illustrate how and why data analysis is important for businesses, here are the 4 types of data analysis and examples of each.
Descriptive Analysis: Descriptive data analysis looks at past data and tells what happened. This is often used when tracking Key Performance Indicators (KPIs), revenue, sales leads, and more.
Diagnostic Analysis: Diagnostic data analysis aims to determine why something happened. Once your descriptive analysis shows that something negative or positive happened, diagnostic analysis can be done to figure out the reason. A business may see that leads increased in the month of October and use diagnostic analysis to determine which marketing efforts contributed the most.
Predictive Analysis: Predictive data analysis predicts what is likely to happen in the future. In this type of research, trends are derived from past data which are then used to form predictions about the future. For example, to predict next year’s revenue, data from previous years will be analyzed. If revenue has gone up 20% every year for many years, we would predict that revenue next year will be 20% higher than this year. This is a simple example, but predictive analysis can be applied to much more complicated issues such as risk assessment, sales forecasting, or qualifying leads.
Prescriptive Analysis: Prescriptive data analysis combines the information found from the previous 3 types of data analysis and forms a plan of action for the organization to face the issue or decision. This is where the data-driven choices are made.
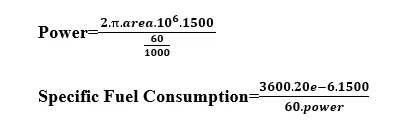
BASIC FORMULAE:
PYTHON CODE:
#Program to Perform the DATA Analysis

import math
import matplotlib.pyplot as plt
import numpy as np
from scipy.integrate import simps

#1.Compatability check

try:
	open('engine_data.out','r')

	line_count=1

	# We have to crate the empty arrrays to store the value of volume and pressure

	Volume=[]
	Pressure=[]

	#In data file Volume and Pressure is in Column number 8 and 2
	v=8
	p=2

	# We have to create a empty array to store all the values from data
	data=[]

except:
	print('file not recognized.Please provide a valid CONVERGE output file')

# For loop is initiated  to add the values of Volume and Pressure form the data

for line in open('engine_data.out', 'r'):

	if '#' not in line:
		data.append(line.split())
		if line_count>=6:
			Volume.append(float(line.split()[v-1]))
			Pressure.append(float(line.split()[p-1]))
	line_count=line_count+1

#Plotting the P-V diagram


plt.plot(Volume,Pressure,	linewidth=3)
plt.xlabel('Volume (m^3)')
plt.ylabel('Pressure (MPA')
plt.title('P-V Diagram')
plt.savefig('P-V digaram of engine')
plt.show()

#2.Calculations to be done
#Area under PV diagram
#power
#Specific Fuel consumption

area=np.trapz(Pressure,Volume)
print('Area under the PV curve=',area)

power=2*math.pi*area*pow(10,6)*1500/(60/1000)
print('Power =',power,'Watt')

sfc=(3600*20e-6*1500)/(60*power)
print('Specific Fuel consumption=',sfc,'gram/KW*hr')


#3.Data visualizer

#Transposing columns into row matrix and onvering into float type
transpose=np.transpose(data)
float_t=transpose.astype(np.float)


#First we have to create arrays of parametrs
parameters=['crank','Pressure','Maximum Pressure','Minimum Pressure','Mean Temparature','Maximum Temparature','Minimum Temparature','Volume','Mass','Density','Integrated HR','HR Rate','Cp','Cv','Gamma','kinematic Viscosity','Dynamic Viscosity']

#We have to create choice option for parameters where user have too give input
print('Please enter your choice from the following parameters')
print(' 1.crankn 2.Pressuren 3.Maximum Pressure n 4. Minimum Pressure n 5. Mean Temparature n 6.Maximum Temparature n 7.Minimum Temparature n 8.Volume n 9.Mass  n 10.Density  n 11.Integrated HR n 12.HR Rate n 13.Cp n 14.Cv n 15.Gamma n 16.kinematic Viscosity n 17.Dynamic Viscosity')


X=int(input('Enter the first choice/X-Axis: n'))
Y=int(input('Enter the Second Choice/Y-Axis: n'))

#Ploting based on user input
plt.plot(float_t[X,:],float_t[Y,:],linewidth=3)
plt.xlabel(parameters[X],fontsize=10)
plt.ylabel(parameters[Y],fontsize=10)
plt.title(parameters[Y]+ 'VS' +parameters[X],fontsize=12)
plt.show()
Code Explanation:
- At first we have to import the modules like math, matplotlib, NumPy, and scipy
- The first task that we have to start with by compatibility checking,For that we are using try and except command .Using the open command we will try opening the file named engine_data.out and that doesn’t found the file then it will be printing ‘file not recognized. Please provide a valid CONVERGE output file’.
- Then we have to take the two quantities to plot,For that we have created the empty arrays for Volume and Pressure so we can store the values of pressure and volume.To extract further details we have used ‘if’ statement,And to store the values of volume and pressure we have used append command.
- For the value of Pressure and Volume from data we have to plot the graph.For that one we used matplotlib module and plotted accordingly
- For the engine performance calculation we have done area under PV diagram,Power and Specific Fuel Consumption were calculated
- And we have converted the column matrix of data into row matrix
- Now we have to take inputs from user and we have to plot graphs accordingly.For that first we have to define the parameters and after that we have to print the user inputs,’n’ will help to create another line.The user inputs should be an integer so int command is used .
- After taking the use inputs we have to plot the graphs accordingly using plt commands
RESULT:
First result is the plot Pressure and Volume
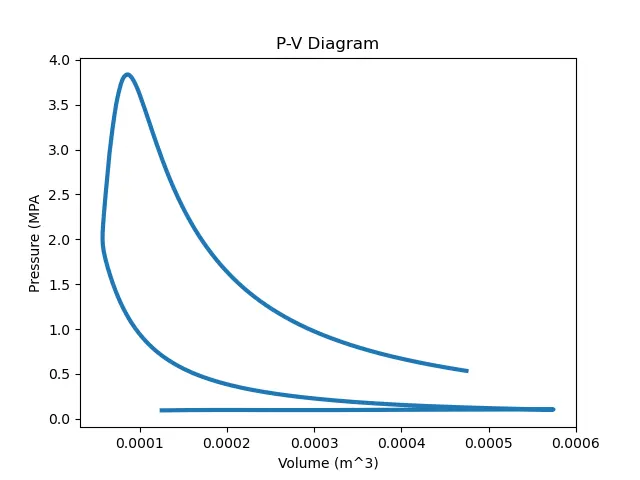
Next we have done the calculation

Next we have done the user input
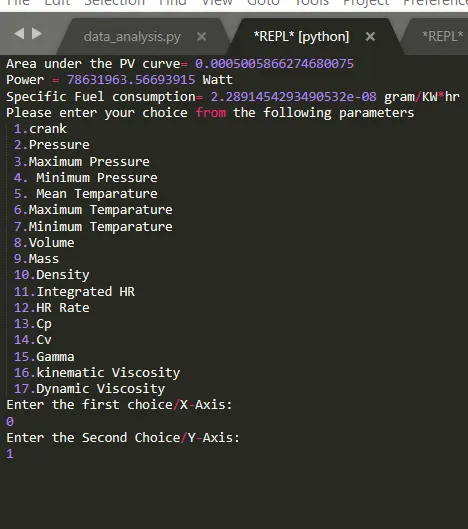
The user Input was crank and pressure,So the plot were genrated
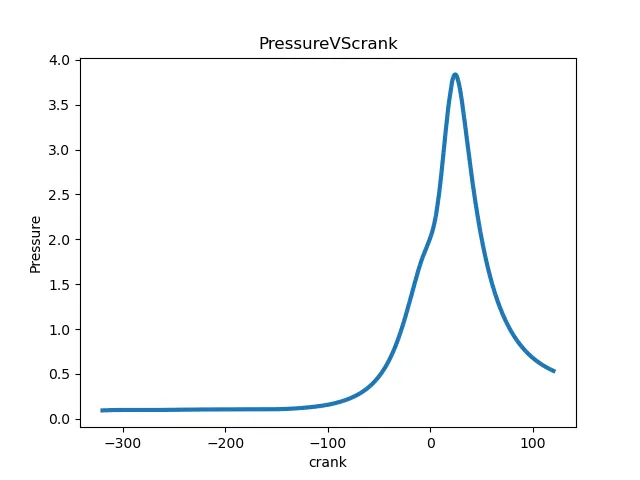
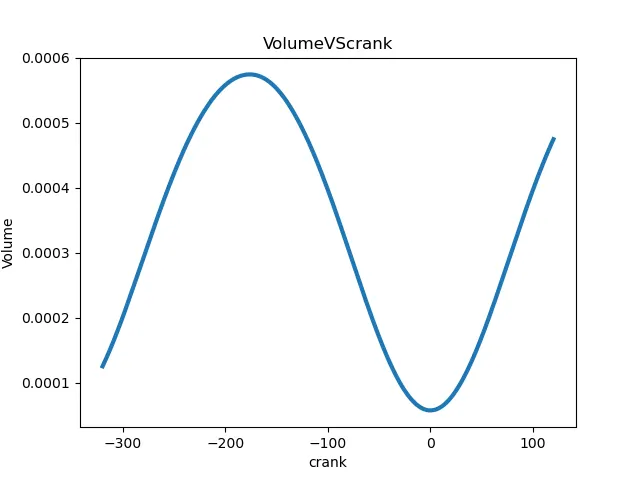
According to user input we were genrated Volume vs Crank diagram
CONCLUSION:
As per the requirement we have checked the compatabibilty and along with that we calculated the area under PV daigram ,Power and SFC.
Along with that we have plotted the daigrams according to user inputs and found clearly