Week 6 - Data analysis
Data analysis
Aim:-
- Code program as column number from data file should take as the input and plot the respective image.
- Each file should be saved by the name of the column.
- The plot label should be extracted from the field. If, requested plot is between column 1 (crank angle) and column 8(volume), then the label information also should automatically be extracted and must appear as labels in the plot.
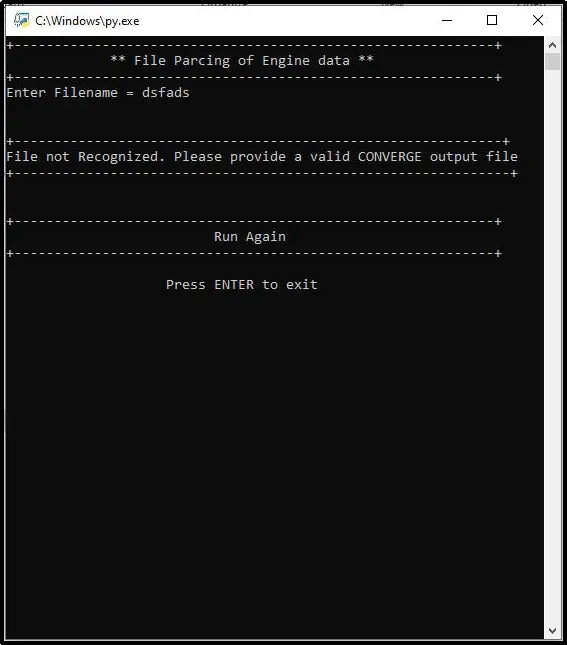
- In case of wrong file name its should say something like “File not recognized. Please provide a valid CONVERGE output file”
- Calculate area under the P-V diagram.
- Calculate the power output of this engine. Assume RPM is 1500.
- This engine consumed 20 micro grams of fuel (per 1 stroke cycle). Calculate its specific fuel consumption.
Objective:-
- Understand the structure of data in “engine_data.out” file.
- Import important library from python that we are going to use in this code.
- Provide input code to Import the file “engine_data.out” file.
- Then create conditional statement using if, else to to show the message "File not Recognized. Please provide a valid CONVERGE output file" in case we put wrong file name.
- Extract the data from file by providing specific array to use to plot the graph and calculation.
- Print input data table in command window for user to know respective number for their particular parameters.
- Generate the input codes for user to pick the right parameter and enter it according to x-axis and y-axis.
- Write the codes to plot the figure.
- Write input codes for user to enter proper RPM and fuel consumption.
- Explain the codes to calculate the area under the P-V diagram (Work Done).
- Study and write code to calculate Engine power output.
- Explain and write code to calculate Specific Fuel consumption.
File Parsing:-
The process of "parsing" can be described as reading in a data stream of some sort and building an in-memory model or representation of the semantic content of that data, in order to facilitate performing some kind of transformation on the data.
Some examples:
- A compiler parses your source code to (usually) build an abstract syntax tree of the code, with the objective of generating object- (or byte-) code for execution by a machine.
- An interpreter does the same thing but the syntax tree is then directly used to control execution (some interpreters are a mashup of byte-code generators and virtual machines and may generate intermediate byte-code).
Starting of the program.
In the very beginning, we are going to import library from python which is required in this project.
#------------------  Importing libraries in python  ------------------#
import matplotlib.pyplot as plt
import numpy as np
import math
from prettytable import PrettyTable
Next, create input code for file name which will ask user to enter file name that he/she wants to parse. Below-mentioned line of code will help us to proceed that way.
# File Compatibility Check
# For Exception Handling we are going to use if and else
File_name = input("Enter Filename =  ")
For the compatibility check that user put the correct file name or not we will use if else command we can put n number of file name which is compatible with our program to work without any interruptions. Following are the line of codes depict the way to run program above-mentioned way.
# Enter list of file name which you want to allow to read
if File_name == ('engine_data.out'):


        """ ------------------------------------------------------------------
        ----------------------------------------------------------------------
        ----------------------------------------------------------------------
	                             Main Program
        ----------------------------------------------------------------------
        ----------------------------------------------------------------------
        -------------------------------------------------------------------"""


# use of except to print is file name is not in mentioned list
else:
	print('nn+-------------------------------------------------------------+')
	print("File not Recognized. Please provide a valid CONVERGE output file")
	print('+--------------------------------------------------------------+')
Now, from hear, we can start to write our man program in above if loop. First we have to create array of properties/parameters of the engine that are mention/provided in the .out file. Then one by one we also have to create array of individual columns which contain data of individual engine parameters as per exhibited in following figure which is screen shot of our engine_data.out file.
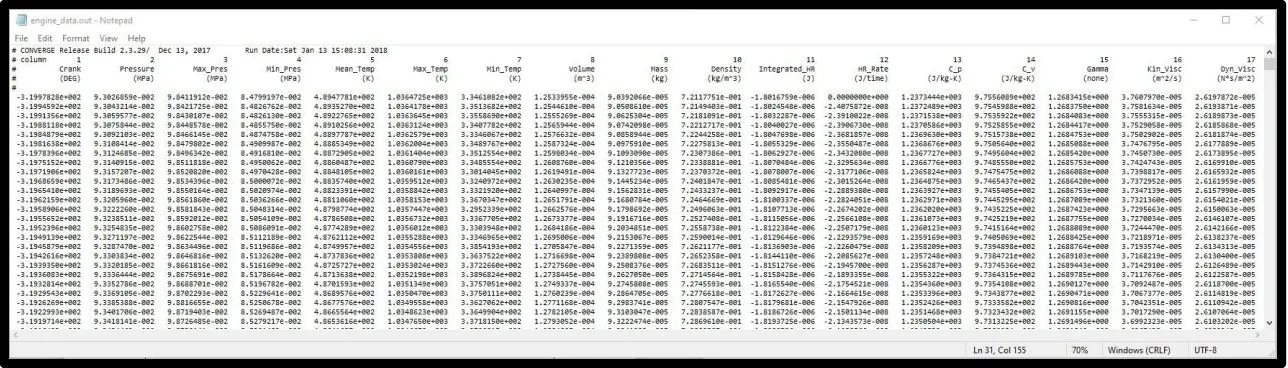
As we take a look at file its contain 8671 number of line of data and 17 columns, so its pretty large data to parse manually line by line. So we are going to create system by using that code user can put proper column number and can extract particular data from that column to plot the result in figure window without worry about providing proper title and labeling x-axis and y-axis.
Therefor, in order to make that possible, we are going to first create empty array of property name and unit and then for individual column by parameter name. Afterwards, we have to create line count to keep track of each line so we can easily mention line number to extract specific data from that specified line number. Following are the line count for overall data, parameters/property name and for units.
	# Line count to specify the particular line number
	line_count = 1
	line_property = 1
	line_Unit = 1
In a bid to read file we are going to create for loop to open input file and read it. As we can see in data file figure first 5 line contain information regarding data with ‘#’ hash-tag symbol using that we are going to first read line which contain has-tag using if command and again using if we are going to extract data from line three as we created line count for property by increasing number “line_property = line_property + 1”, which keep track of the extracted lines in serial order, is going to help us to do that. Using same technique, also extract the unit data line and then break that individual lines using split command by storing it in there respective array which is [P] and [U]. Hence, codes for the above information will be…
	""" ------------------------------------------------------------------
		creating for loop to read the data line by line and store that data
	in empty array. Firstly form line 3 it extraction the parameters name
	and storing it in p=[] array. Same way, units are also store in U=[]
	array.
		Next, using if command it will read data column by column as per
	column number.
	-------------------------------------------------------------------"""

	for line in open(File_name,'r'):
		if '#' in line:                  # read line in which '#' is present
			if line_property == 3:   # rad line 3
				P.append(line.split()) # split line 3 and save data in P[] array

			# increment line count to keep track of line number
			line_property = line_property + 1

			if line_Unit == 4:       # read line 4
				U.append(line.split()) # split and save data in U[] array

			# increment line count to keep track of line number
			line_Unit = line_Unit + 1
Similar way, we are going to read line which not contain “#” and split the data line by line and assign it to their respective column by mentioning their respective column number after splitting data using split command as shown below.
		if '#' not in line:             # skip line which have '#' in it
            # Split sata and save column data in their respective array
			Crank.append(float(line.split()[0]))
			Pressure.append(float(line.split()[1]))
			Max_Pres.append(float(line.split()[2]))
			Min_Pres.append(float(line.split()[3]))
			Mean_Temp.append(float(line.split()[4]))
			Max_Temp.append(float(line.split()[5]))
			Min_Temp.append(float(line.split()[6]))
			Volume.append(float(line.split()[7]))
			Mass.append(float(line.split()[8]))
			Density.append(float(line.split()[9]))
			Integrated_HR.append(float(line.split()[10]))
			HR_Rate.append(float(line.split()[11]))
			C_p.append(float(line.split()[12]))
			C_v.append(float(line.split()[13]))
			Gamma.append(float(line.split()[14]))
			Kin_Visc.append(float(line.split()[15]))
			Dyn_Visc.append(float(line.split()[16]))

			# increment line count to keep track of line number
			line_count = line_count + 1
To assign each column their individual number we are going to create array of the column with same sequence as presented in engine_data.out file.
	# Create intput array of the parameters to specify specific Sr No. to it
	INPUT = [0,Crank,Pressure,Max_Pres,Min_Pres,Mean_Temp,Max_Temp,Min_Temp,Volume,Mass,Density,Integrated_HR,HR_Rate,C_p,C_v,Gamma,Kin_Visc,Dyn_Visc]
In program we assign data to their respective array but in order to put proper column number user do not know which column contain which information. To give that information to the users we have to create table which contain information about which column contain which information according to their serial numbers. So first, create property numbers in first column of table and second column contain parameters name with their units.
We are going to use prettytable library in python to generate more beautiful output results for user by writing below codes.
	# Create data table which help to understand  colums which contain respective Parameters
	# array for Sr No. of columns
	prop_no = [0,1,2,3,4,5,6,7,8,9,10,11,12,13,14,15,16,17,18]

	print('n            Table-[1]:')
	print  ('           +---------+')
	print('Engine Parameters from data File')
	table = PrettyTable(['Sr No.',' Engine Parameters '])

	# for loop with the range of 1 to 18 parameters
	for x in range(1,18):
		table.add_row([prop_no[x],P[0][x]+U[0][x]])
	print(table)
Using table now user know the input value for x-axis and y-axis so next we have to create input codes for user which ask for the data for x-axis and y-axis to plot the results.
	# create inputs for command widow x and y as column number data
	x = input('x-axis data number = ')
	x = int(x)
	y = input('y-axis data number = ')
	y = int(y)
Here we can now, plot the graph of any parameters using matplotlib library using following codes.
	# Plot figure column vs column y
	fig = plt.figure(linewidth=6, edgecolor="k")    # Border and its linewidth for figure window
	plt.plot(INPUT[x],INPUT[y],linewidth=2)         # plot column inputs
	plt.xlabel(P[0][x]+U[0][x],size='12',weight='bold') # x-axis parameter labeling
	plt.ylabel(P[0][y]+U[0][y],size='12',weight='bold') # y axis parameter labeling

	# Title for the plot
	plt.title(P[0][y]+' Vs '+P[0][x],color='m',size='16',weight='bold')
	plt.grid(color='b',linestyle=':',linewidth='0.5')  # grid on
	plt.savefig(P[0][y]+' Vs '+P[0][x]+'.png')         # Save the figure as its name
Output for above codes:
for input [1] x-axis data number =1
[2] y-axis data number =2
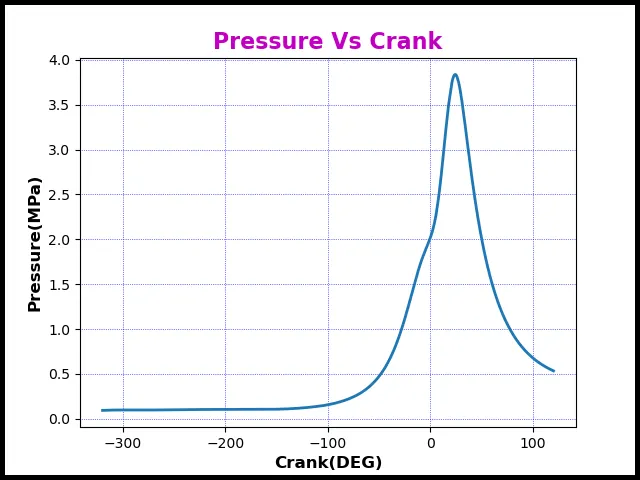
for input [1] x-axis data number =8
[2] y-axis data number =2
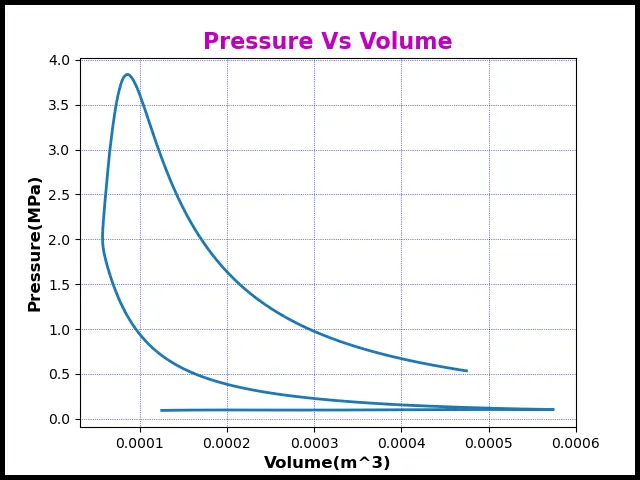
Calculation Part of program
Our next task is to calculate area under the curve (work Done), Engine Power, and Specific fuel consumption
Lest first understand their definitions and how to calculate it.
Area under the PV curve (Work Done):-
The work done during a thermodynamic process is equal to the area under the curve as seen in the diagram below.
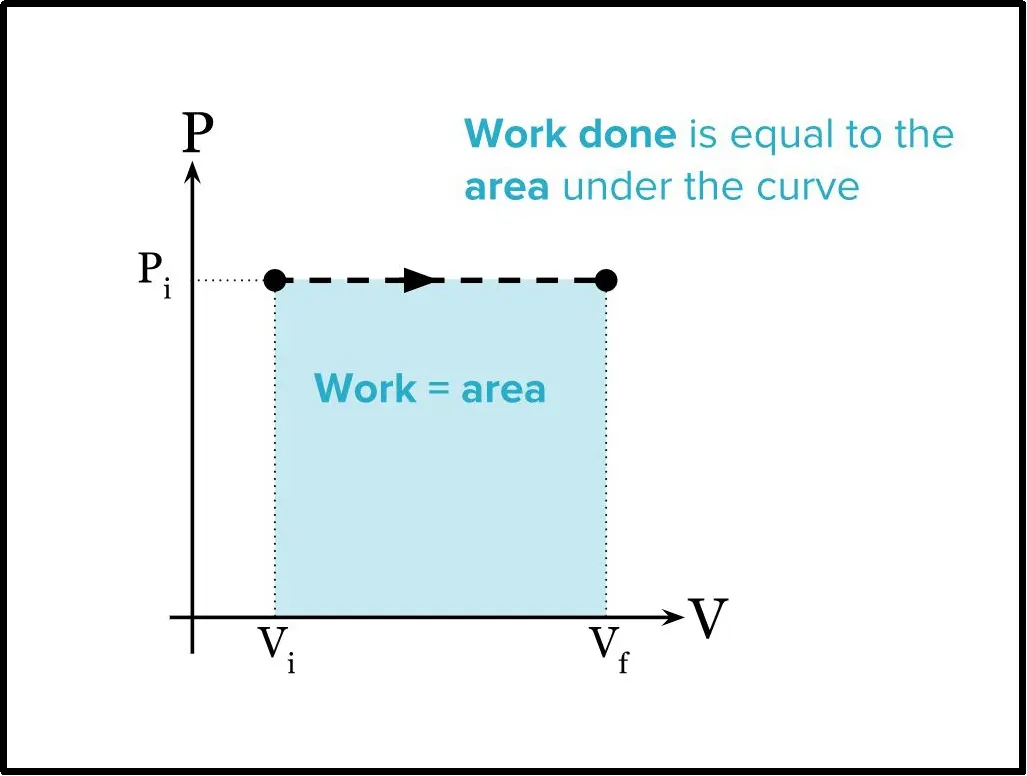
The reason why work is equal to the area under the curve is that,
`W=F Delta x =(PA) Delta x=P(A Delta x)=P Delta V`
And since `P Delta V` is just the height `x` width of the rectangle shown above, the work is equal to the area. If we use pressure units of `m^3` then the energy we find will be in units of joules
We have to be really careful with signs though. If the path on a PV diagram is directed to the left, the volume is decreasing, and positive work is being done on the gas. If the path on a PV diagram is directed to the right (as in the diagram above), the volume is increasing, and negative work is being done on the gas since
`W_(by gas) =W_(on gas)`
It doesn't matter what shape the path takes, the area under the curve will still represent the work done. For any curved path we can imagine breaking the area into an infinite amount of infinitesimally thin rectangles.
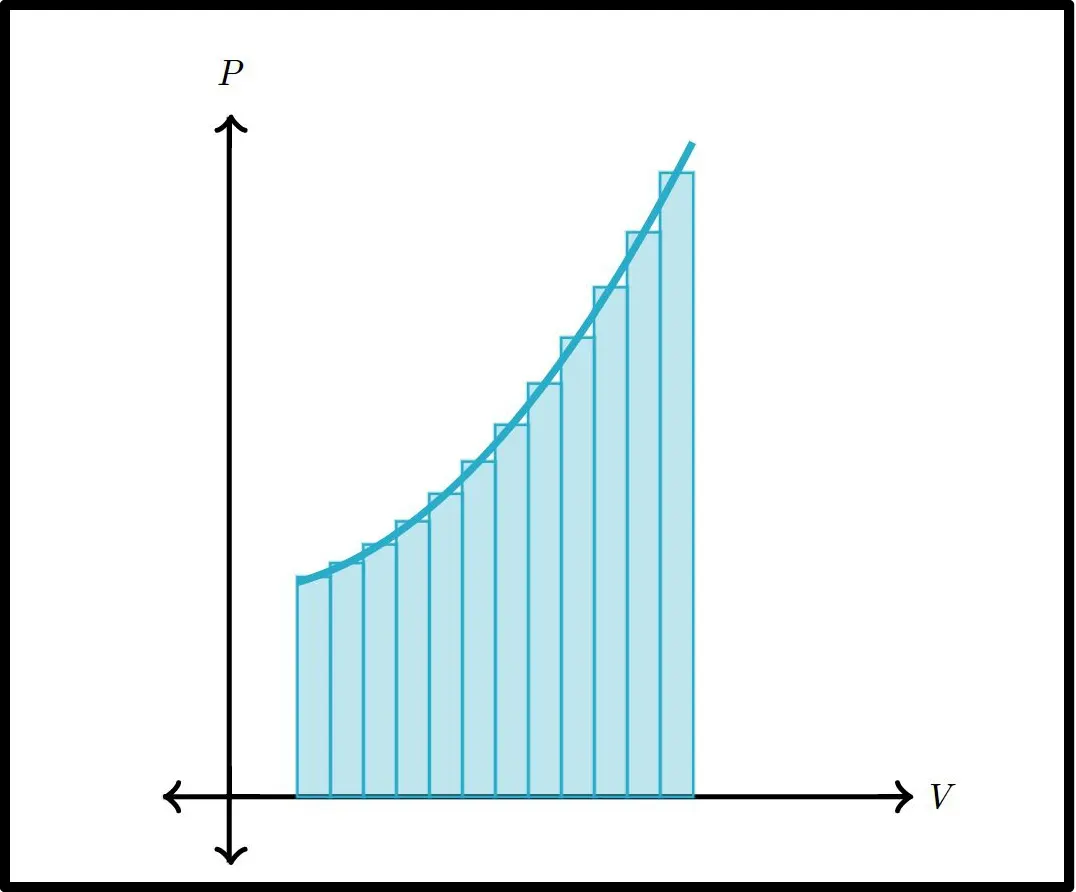
The area of each rectangle would represent the work done during each infinitesimal step, and the sum of the areas would represent the total work done for the entire process.
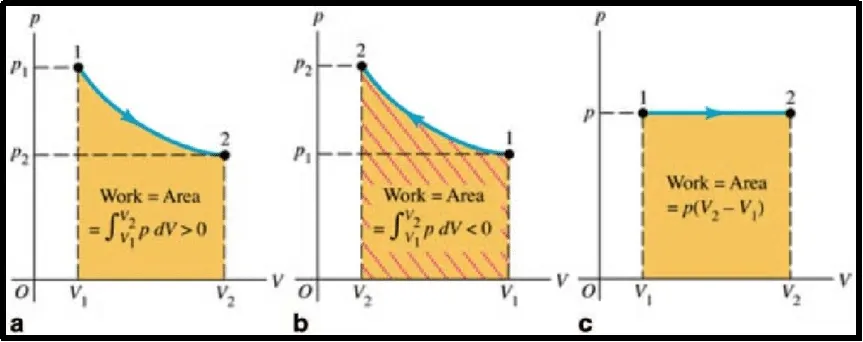
[a] In this case from state 1 to state 2 the volume increases and the work and area are positive
[b] In this change from state 1 to state 2 the volume decreases; the area is taken to be negative to agrees with the sign of W. The two states are reversed from part (a).
[c] The area of the rectangle gives the work done for a constant-pressure process. In this case, volume increases and W.
But this lengthy process of calculation we can perform in single line of code using numpy library trapz command.
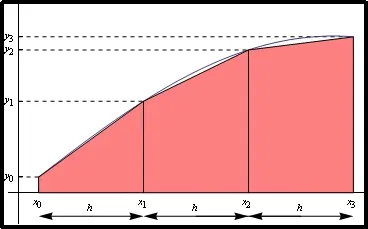
This perform trapezoidal rule to calculate area beneath the curve.
In mathematics, the more specifically in numerical analysis, the trapezoidal rule is a technique for approximating the definite integral.
Following figure best explain the trapezoidal rule.
Numpy.trapz(y ,x=None, dx=1.0, axis=-1)
Integrate along the given axis using the composite trapezoidal rule.
Integrate y(x) along given axis
Parameters:
y(array) : input array o integrate.
x(array) : The sample points corresponding to the y values. If x is None, the sample points are assumed to be evenly spaces dx apart the default is None.
dx : (scalar) The spacing between sample points when x is None. The default is 1.
Axis: (int) The axis along which to integrate.
So, to calculate the area under the curve out codes will look like
    # [1] Area under the PV curve (Work Done)
	Wd   = (np.trapz(INPUT[2],INPUT[8]))*(10**6)
	print("n# Outputs:- ")
	print('[1] Area under the PV curve (Work Done) = %.5f' %(Wd),'J')
In order to calculate engine power and Specific fuel consumption we require inputs of rpm and fuel consumption by the user so create we can ask it by following codes.
	rpm = input('Engine RPM = ')
	rpm = float(rpm)

	fc   = input('Fuel Consumption[mg/s] = ')
	fc   = float(fc)
Engine Power:
In terms of internal combustion engines, the engine power usually describes the rated power, which is a power output that the engine can maintain over a long period of time according to a certain testing method, for example ISO 1585. In general though, an internal combustion engine has a power take-off shaft (the crankshaft), therefore, the rule for shaft power applies to internal combustion engines: Engine power is the product of the engine torque and the crankshaft's angular velocity.
`Power =T o r q u e(T) xx a n g u lar``velocity(ω)`
It can also be calculated as work done per revolution is multiplied by rpm of the engine.
`Power=W o r k` `d o n e xx r p m`
	# [2] Engine Power Output [kW]
	p   = (Wd*(rpm/60))/1000
	print('n[2] Engine Power Output                 = %.5f'%(p), 'kW')
Specific Fuel consumption (SFC):
Specific fuel consumption (SFC) is a measure of the fuel efficiency of any prime mover that burns fuel and produces rotational, or shaft power. It is typically used for comparing the efficiency of internal combustion engine with a shaft output It is the rate of fuel consumption divided by the power produce.
`SFC = (fc)/P`
Where,
`fc` or `r` is the fuel consumption rate in grams per second (g/s)
`P` is the power produce in watts
	# [3] Specific Fuel consumption (SFC)-(mf/p) [Kh/kW.hr]
	# Mass_Of_fuel = fc*3600*10^-6 [kg/hr]
	Sfc = (fc*3600*(10**-6))/p
	print('n[3] Specific Fuel consumption (SFC)     = %.5f'%(Sfc), 'Kg/kW.hr')
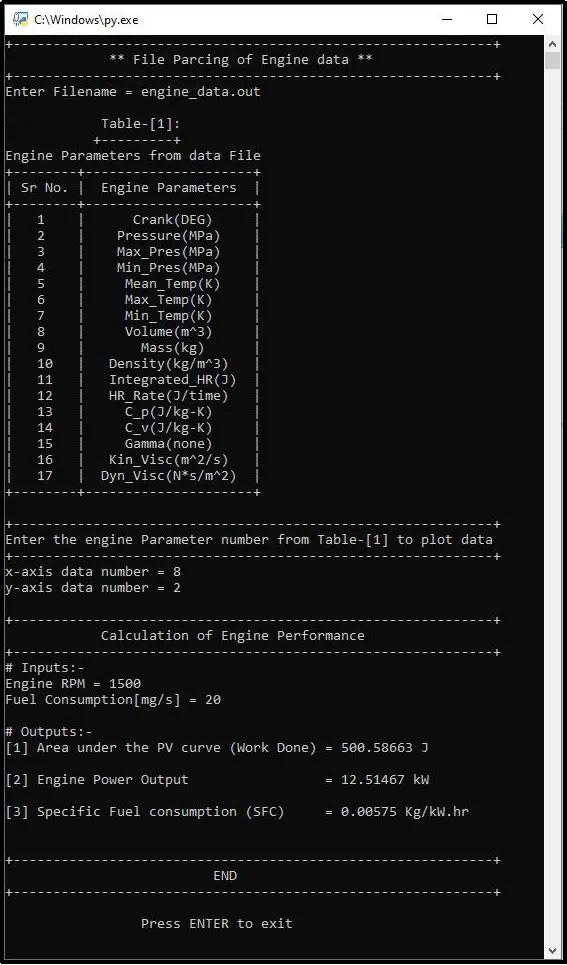
Output of the program
Lastly there will be else statement in case user put the wrong file name.
# use of else to print is file name is not in mentioned list
else:
	print('nn+-------------------------------------------------------------+')
	print("File not Recognized. Please provide a valid CONVERGE output file")
	print('+--------------------------------------------------------------+')
Output of Error massage
Conclusion:-
- Studied about data analysis and Learn to read and extract data from file.
- Understood how to use conditional statement to print warning or any other information if something goes wrong.
- Successfully generated title and label without using any manual input in program.
- Learn to calculate area under the curve using trapezoidal method using numpy library.
- Studied about engine power and specific fuel consumption.
Reference:-
[1] The work done equals the area under the curve - https://www.researchgate.net/figure/The-work-done-equals-the-area-under-the-curve-on-a-pV-diagram-a-In-this-change-from_fig2_299914887
[2] area under the curve-https://www.khanacademy.org/science/physics/thermodynamics/laws-of-thermodynamics/a/what-are-pv-diagrams
[3] Trapezoid rule - https://www.math.ubc.ca/~pwalls/math-python/integration/trapezoid-rule/
[4] Trapezoid rule - https://en.wikipedia.org/wiki/Trapezoidal_rule
[5] Numpy.trapz - https://numpy.org/doc/stable/reference/generated/numpy.trapz.html
[6] Break Horsepower - Reciprocating Engine Power and Efficiency (part three) - https://www.flight-mechanic.com/reciprocating-engine-power-and-efficiencies-part-three/
[7] Brake-specific fuel consumption - https://en.wikipedia.org/wiki/Brake-specific_fuel_consumption
Complete Program
""" ------------------------------------------------------------------
							  File Parcing
-------------------------------------------------------------------"""

print('+------------------------------------------------------------+')
print('             ** File Parcing of Engine data ** ')
print('+------------------------------------------------------------+')


#------------------  Importing libraries in python  ------------------#
import matplotlib.pyplot as plt
import numpy as np
import math
from prettytable import PrettyTable


# File Compatibility Check
# For Exception Handling we are going to use try and except
File_name = input("Enter Filename = ")
# Enter list of file names which you want to allow to read
if File_name == ('engine_data.out'):

	P =[]                     # Empty array to collect property name
	U =[]                     # Empty array to collect Units

	# ---------- Empty array of Parameters in data file  -------- #
	Crank = []
	Pressure = []
	Max_Pres = []
	Min_Pres = []
	Mean_Temp = []
	Max_Temp = []
	Min_Temp = []
	Volume = []
	Mass = []
	Density = []
	Integrated_HR = []
	HR_Rate = []
	C_p = []
	C_v = []
	Gamma = []
	Kin_Visc = []
	Dyn_Visc = []


	# Line count to specify the particular line number
	line_count = 1
	line_property = 1
	line_Unit = 1

	""" ------------------------------------------------------------------
		creating for loop to read the data line by line and store that data
	in empty array. Firstly form line 3 it extraction the parameters name
	and storing it in p=[] array. Same way, units are also store in U=[]
	array.
		Next, using if command it will read data column by column as per
	column number.
	-------------------------------------------------------------------"""
	for line in open(File_name,'r'):
		if '#' in line:                 # read line in which '#' is present
			if line_property == 3:      # read line 3
				P.append(line.split())  # split line 3 and save data in P[] array

			# increment line count to keep track of line number
			line_property = line_property + 1

			if line_Unit == 4:          # read line 4
				U.append(line.split())  # split and save data in U[] array

			# increment line count to keep track of line number
			line_Unit = line_Unit + 1


		if '#' not in line:             # skip line which have '#' in it
			# Split sata and save column data in their respective array
			Crank.append(float(line.split()[0]))
			Pressure.append(float(line.split()[1]))
			Max_Pres.append(float(line.split()[2]))
			Min_Pres.append(float(line.split()[3]))
			Mean_Temp.append(float(line.split()[4]))
			Max_Temp.append(float(line.split()[5]))
			Min_Temp.append(float(line.split()[6]))
			Volume.append(float(line.split()[7]))
			Mass.append(float(line.split()[8]))
			Density.append(float(line.split()[9]))
			Integrated_HR.append(float(line.split()[10]))
			HR_Rate.append(float(line.split()[11]))
			C_p.append(float(line.split()[12]))
			C_v.append(float(line.split()[13]))
			Gamma.append(float(line.split()[14]))
			Kin_Visc.append(float(line.split()[15]))
			Dyn_Visc.append(float(line.split()[16]))

			# increment line count to keep track of line number
			line_count = line_count + 1

	# Create data table which help to understand  colums which contain respective Parameters
	# array for Sr No. of columns
	prop_no = [0,1,2,3,4,5,6,7,8,9,10,11,12,13,14,15,16,17,18]

	print('n            Table-[1]:')
	print  ('           +---------+')
	print('Engine Parameters from data File')
	table = PrettyTable(['Sr No.',' Engine Parameters '])

	# for loop with the range of 1 to 18 parameters
	for x in range(1,18):
		table.add_row([prop_no[x],P[0][x]+U[0][x]])
	print(table)


	# Create intput array of the parameters to specify specific Sr No. to it
	INPUT = [0,Crank,Pressure,Max_Pres,Min_Pres,Mean_Temp,Max_Temp,Min_Temp,Volume,Mass,
	Density,Integrated_HR,HR_Rate,C_p,C_v,Gamma,Kin_Visc,Dyn_Visc]

	print('n+------------------------------------------------------------+')
	print('Enter the engine Parameter number from Table-[1] to plot data')
	print('+------------------------------------------------------------+')

	# create inputs for command widow x and y as column number data
	x = input('x-axis data number = ')
	x = int(x)
	y = input('y-axis data number = ')
	y = int(y)

	# Plot figure column vs column y
	fig = plt.figure(linewidth=6, edgecolor="k")    # Border and its linewidth for figure window
	plt.plot(INPUT[x],INPUT[y],linewidth=2)         # plot column inputs
	plt.xlabel(P[0][x]+U[0][x],size='12',weight='bold') # x-axis parameter labeling
	plt.ylabel(P[0][y]+U[0][y],size='12',weight='bold') # y axis parameter labeling

	# Title for the plot
	plt.title(P[0][y]+' Vs '+P[0][x],color='m',size='16',weight='bold')
	plt.grid(color='b',linestyle=':',linewidth='0.5')  # grid on
	plt.savefig(P[0][y]+' Vs '+P[0][x]+'.png')         # Save the figure as its name


	print('n+------------------------------------------------------------+')
	print('            Calculation of Engine Performance')
	print('+------------------------------------------------------------+')
	print("# Inputs:- ")

	rpm = input('Engine RPM = ')
	rpm = float(rpm)

	fc   = input('Fuel Consumption[mg/s] = ')
	fc   = float(fc)


    # [1] Area under the PV curve (Work Done)
	Wd   = (np.trapz(INPUT[2],INPUT[8]))*(10**6)
	print("n# Outputs:- ")
	print('[1] Area under the PV curve (Work Done) = %.5f' %(Wd),'J')


	# [2] Engine Power Output [kW]
	p   = (Wd*(rpm/60))/1000
	print('n[2] Engine Power Output                 = %.5f'%(p), 'kW')


	# [3] Specific Fuel consumption (SFC)-(mf/p) [Kh/kW.hr]
	# Mass_Of_fuel = fc*3600*10^-6 [kg/hr]
	Sfc = (fc*3600*(10**-6))/p
	print('n[3] Specific Fuel consumption (SFC)     = %.5f'%(Sfc), 'Kg/kW.hr')


# use of except to print is file name is not in mentioned list
else:
	print('nn+-------------------------------------------------------------+')
	print("File not Recognized. Please provide a valid CONVERGE output file")
	print('+--------------------------------------------------------------+')


print('nn+------------------------------------------------------------+')
print('                          END')
print('+------------------------------------------------------------+')
input('n                 Press ENTER to exit')
Output of the above codes:-
plot for input [1] x-axis data number =1
[2] y-axis data number =2
plot for input [1] x-axis data number =8
[2] y-axis data number =2
Output of Error massage