Performing Data analysis and Data visualization of the data file of the Engine
AIM :-
To perform Data Analysis of an given data using Python.
OBJECTIVE :-
- To perform Data Analysis.
- Plot a graph between any two Column vector.
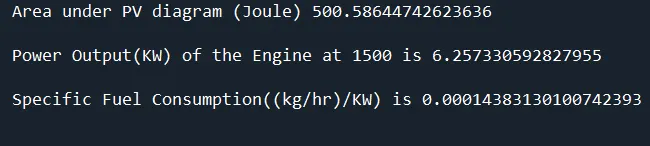
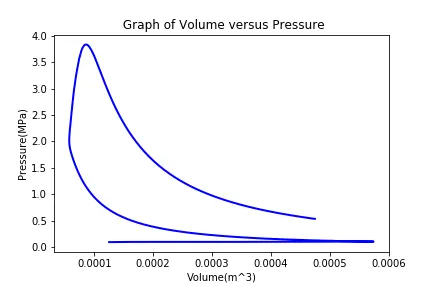
- Calculate the area under the P-V diagram.
- Calculate the power output of this engine.
- Calculate engine specific fuel consumption.
PROBLEM STATEMENT :-
Data visualizer:-
- Script should take column numbers as the input and plot the respective columns as separate images
- Each file should be saved by the name of the column
- The plot labels should be extracted from the file. If, I request for a plot between column 1 (crank angle) and column 8(volume), then the label information should automatically be extracted and must appear as labels in the plots. THIS SHOULD NOT BE DONE MANUALLY.
Compatability check:-
- Code should exit gracefully, if a non-compatible file is provided as an input. It should say something like "File not recognized. Please provide a valid CONVERGE output file"
Basic performance calculation:-
- Calculate the area under the P-V diagram. P is in column 2 and V is in column 8.
- Calculate the power output of this engine. Assume that RPM is 1500
- This engine consumed 20 micro grams of fuel (per 1 stroke cycle). Calculate its specific fuel consumption.
THEORY:-
What is Data Analysis?
Data analysis is defined as a process of cleaning, transforming, and modeling data to discover useful information for business decision-making. The purpose of Data Analysis is to extract useful information from data and taking the decision based upon the data analysis.
Whenever we take any decision in our day-to-day life is by thinking about what happened last time or what will happen by choosing that particular decision. This is nothing but analyzing our past or future and making decisions based on it. For that, we gather memories of our past or dreams of our future. So that is nothing but data analysis. Now same thing analyst does for business purposes, is called Data Analysis.
The process of data analysis has following steps -
i) Data Collection
ii) Data Processing
The process of data analysis has following steps -
i) Compatibility check of the data file.
ii) Initialization of necessary inputs.
iii) Data Preparation (Opening the data file and reading from the data file and extraction of required data).
iv) Data Analysis (Performing the required operations on the data like plotting, calculation of new variables from the data resulting from the data preparation step).
FORMULA USED :-
Power Output of the Engine :-
2. Specific Fuel Consumption -
CODE :-
# PERFORMING DATA ANALYSIS
# Calculating Power of engine, area under PV diagram and specific fuel consumption
# Importing nescesarry libraries
import matplotlib.pyplot as plt
from scipy.integrate import simps


# Checking compatability of the file
try:
    f1 = open('engine_data.out')


# This commamd will helps to throw an when desired file not present
except:
    print('File not recognised')

else:

    # Inputs

    # Assigning an empty array for finding column number
    column_num = []

    # Assigning an empty array for finding column name
    column_name = []


    # Assigning an empty array for finding column input units
    column_units = []

    # Assigning countor variable
    count = 1

    # Creating empty array  to store values of column_name for making plots
    term1 = []
    term2 = []

    # Initialising the column
    t1 = 0
    t2 = 7

    # Reading the data of our input file line by line
    for line in open('engine_data.out'):


        # Reading the line 2 of the data file and storing its value in column_num
        for i in range(0, 19):

            # Reading row of the line 2 except the '#' and column string
            if i >= 2:

                # Reading the line 2 of the data file and storing it into column_num array
                if count == 2:
                    column_num.append(int(line.split()[i]))


         # Reading the line 3 and line 4 of the data file and storing its value in column_name and units
        for j in range(0, 18):

            # Reading row of the line 3 and line 4 except the '#'
            if j >= 1:

                # Reading the line 3 of the data file and storing it into column_name string
                if count == 3:
                    column_name.append(line.split()[j])

                 # Reading the line 4 of the data file and storing it into column_units string
                elif count == 4:
                    column_units.append(line.split()[j])

         # Avoiding "#' in tha data file
        if '#' not in line:

            if count >= 6:
                term1.append(float(line.split()[t1]))
                term2.append(float(line.split()[t2]))

         # Incrementing countor variable
        count = count +1

    # PLOTTING OF DESIRED GRAPH

    # Creating an empty figure
    plt.figure()

    # Creating plot
    plt.plot(term1, term2, linewidth = 2, color = 'b')

    # Creating title for different desired Inputs
    plt.title(' Graph of ' + str(column_name[t1]) + ' versus ' + str(column_name[t2]))

    # Creating x and y labels for different desired inputs
    plt.xlabel(str(column_name[t1]) + str(column_units[t1]))
    plt.ylabel(str(column_name[t2]) + str(column_units[t2]))

    # Saving the plot of image
    plt.savefig(str(column_name[t2]) + ' vs ' + str(column_name[t1]) + ' for Engine ')

    # Showing of the desired plots
    plt.show()
STEPS :-
1. Import the basic modules matploltib, and scipy.
2. Now, we will check compatibility of the data file with the help of try command and except for execution of any error in the data file
3. In the else command, desired inputs are assigned to read column number, column name and column units as a empty array.
4. Now,, we will execute for loop is used for reading the file line by line and storing the required data using open command. Also, one more variable count is used for keeping the count of the line number which is incremented at the end of every iteration. Inside the primary 'for' loop, two secondary 'for' loops one for storing the column number and the other for storing the column name and units and these loops if is used for storing desired data
5. Now, the first 'for' loop which varies from 0 to 18 with 19 iterations, a 'if' condition is used upto greater than or equal to 2 to avoid storing of the non-required characters. Then secondary 'if' condition is used, upto 'count' is equal to 2 then, an empty array 'column_num' gets appended with the values having integer data.
6. Similarly, another 'for' loops execute in the first for loop upto 0 to 17 with 18 iterations. The for loop runs only for 17 times due to condition provided in the primary 'if' condition provide iside this 'for' loop. Inside this' loop, a 'if' condition is used upto greater than or equal to 1 to avoid storing of the non-required characters. Then, an 'if else' condition is used, firstly an 'if' condition used which executes 'lcount' is equal to 3 then, an empty array 'column_name' gets appended with the values having string data type. Now an 'elif' condition used to executes 'lcount' is equal to 4 then, an empty array 'column_units' gets appended with the values having string data type.
7. Now, another loop of 'if' condition executes which says that if there is not a hashtag ('#') symbol at the start of the line then, then inside this loop secondary 'if' condition is used, which says that if the variable count is greater than or equal to 6 then, the empty arrays term1 and term2 gets appended with the required values having float data type which means that the empty arrays gets appended with values (for the required two parameters) only from the corresponding line of the data file.
8. Then the countor variable is incremeted the end of every iteration. Then, we will plot between the two required parameters is obtained using the plt.plot command. The plot is titled using the plt.title command. Also, the axes are labelled using the plt.xlabel and plt.ylabel commands. The figure window or plot is saved using the plt.savefig command.
ERRORS FACED DURING EXECUTION :-
#1:-
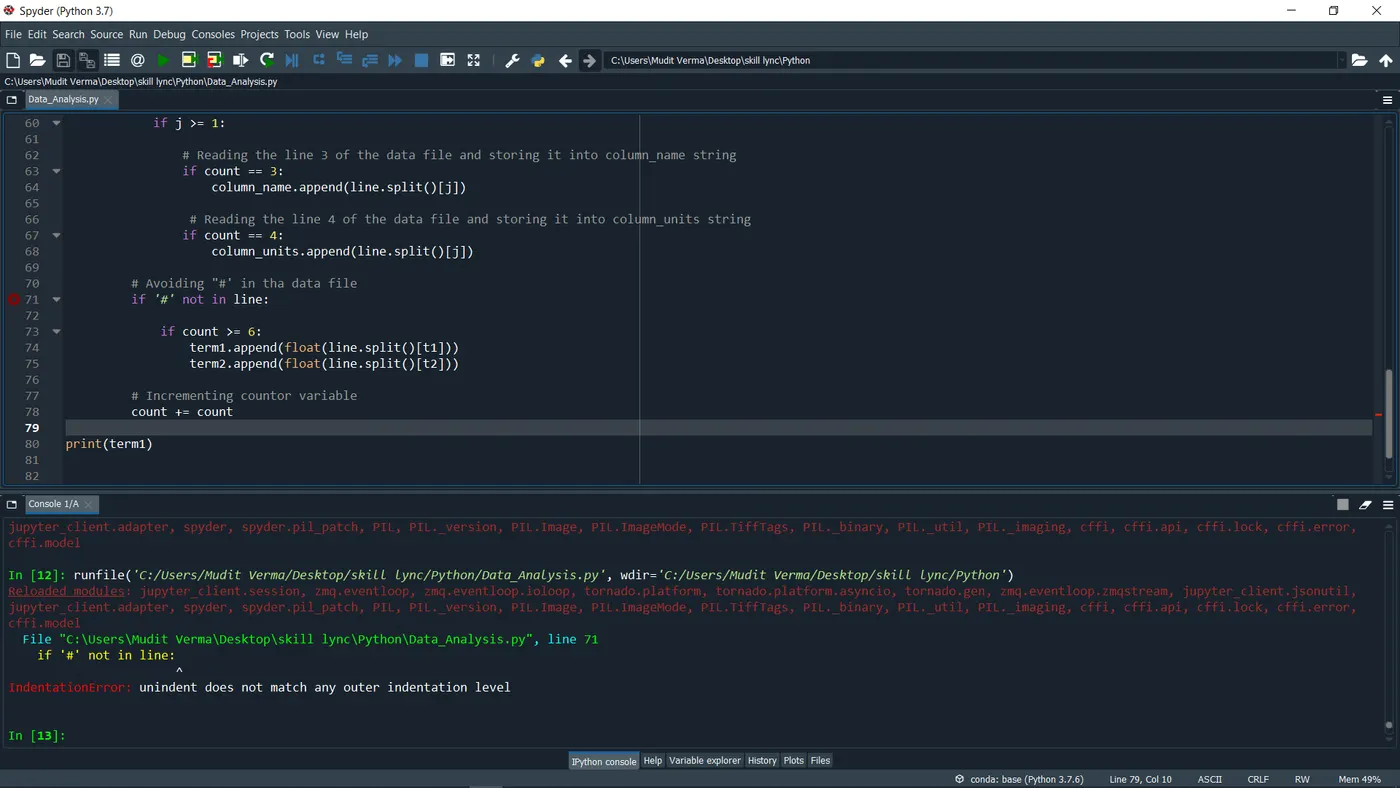
Due to incorrect syntax used while assining inside the loop and it is corrected by doing correct spaces.
#2:-
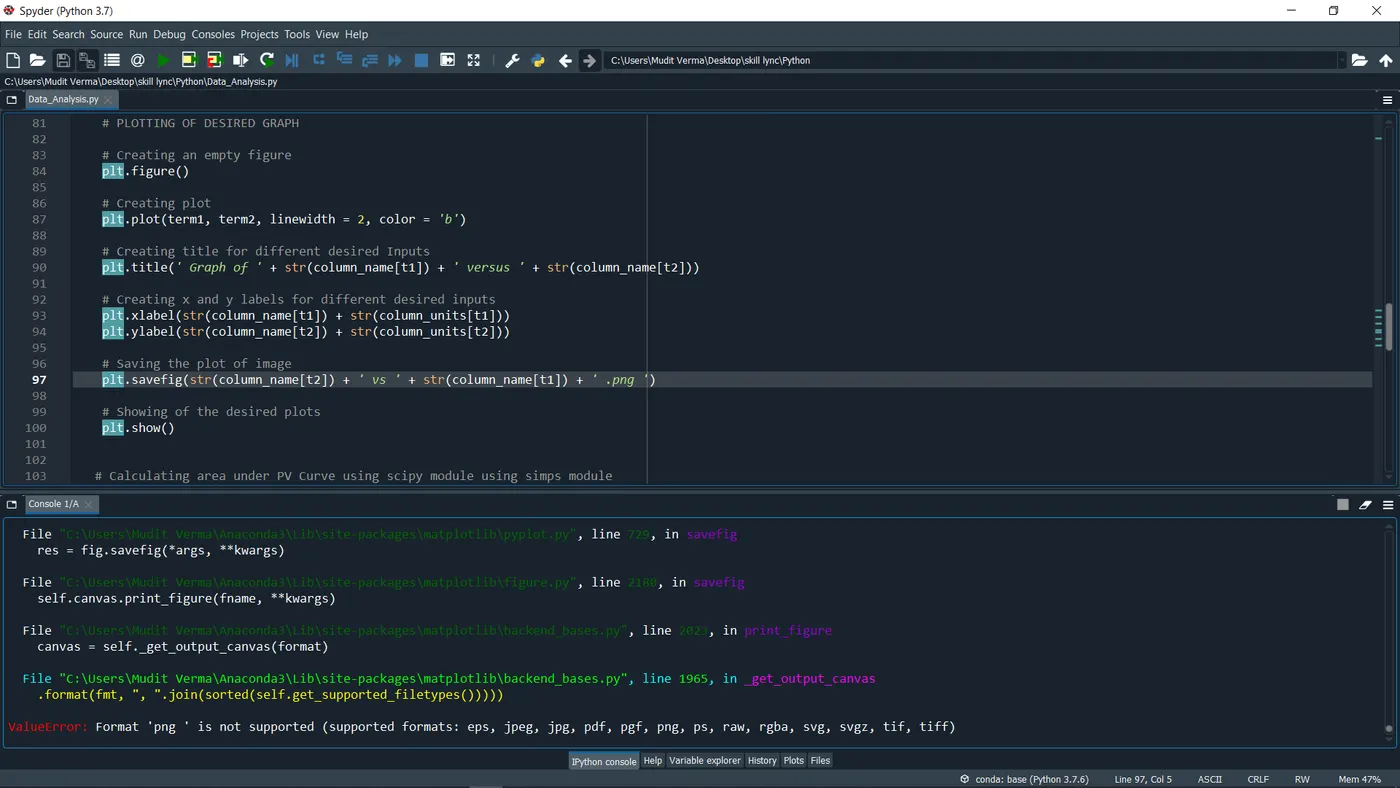
Due to invalid syntax used in the plt.savefig as used .png inside the this command which throws an error because it saves the image automaticaaly in .png .
CODE :- To calculate Area of PV Curve, Output Power and Specific Fuel Consumption of the engine
# PERFORMING DATA ANALYSIS
# Calculating Power of engine, area under PV diagram and specific fuel consumption

# Importing nescesarry libraries
import matplotlib.pyplot as plt
from scipy.integrate import simps


# Checking compatability of the file
try:
    f1 = open('engine_data.out')


# This commamd will helps to throw an when desired file not present
except:
    print('File not recognised')

else:

    # Inputs

    # Assigning an empty array for finding column number
    column_num = []

    # Assigning an empty array for finding column name
    column_name = []


    # Assigning an empty array for finding column input units
    column_units = []

    # Assigning countor variable
    count = 1

    # Creating empty array  to store values of column_name for making plots
    term1 = []
    term2 = []

    # Initialising the column
    t1 = 0
    t2 = 7

    # Reading the data of our input file line by line
    for line in open('engine_data.out'):


        # Reading the line 2 of the data file and storing its value in column_num
        for i in range(0, 19):

            # Reading row of the line 2 except the '#' and column string
            if i >= 2:

                # Reading the line 2 of the data file and storing it into column_num array
                if count == 2:
                    column_num.append(int(line.split()[i]))


         # Reading the line 3 and line 4 of the data file and storing its value in column_name and units
        for j in range(0, 18):

            # Reading row of the line 3 and line 4 except the '#'
            if j >= 1:

                # Reading the line 3 of the data file and storing it into column_name string
                if count == 3:
                    column_name.append(line.split()[j])

                 # Reading the line 4 of the data file and storing it into column_units string
                elif count == 4:
                    column_units.append(line.split()[j])

         # Avoiding "#' in tha data file
        if '#' not in line:

            if count >= 6:
                term1.append(float(line.split()[t1]))
                term2.append(float(line.split()[t2]))

         # Incrementing countor variable
        count = count +1

    # PLOTTING OF DESIRED GRAPH

    # Creating an empty figure
    plt.figure()

    # Creating plot
    plt.plot(term1, term2, linewidth = 2, color = 'b')

    # Creating title for different desired Inputs
    plt.title(' Graph of ' + str(column_name[t1]) + ' versus ' + str(column_name[t2]))

    # Creating x and y labels for different desired inputs
    plt.xlabel(str(column_name[t1]) + str(column_units[t1]))
    plt.ylabel(str(column_name[t2]) + str(column_units[t2]))

    # Saving the plot of image
    plt.savefig(str(column_name[t2]) + ' vs ' + str(column_name[t1]) + ' for Engine ')

    # Showing of the desired plots
    plt.show()


   # Calculating area under PV Curve using scipy module using simps module
    area = simps(term2, term1)*pow(10, 6)
    print(' Area under PV diagram (Joule) ' + str(area))
    print('t')


    # Calculating Power Output of the Engine

    # Given Speed of the Engine(RPM)
    N = 1500


    # No. of cylinder in the engine
    n = 1

    # No. f stroke of engine
    stroke = 4

    # As this is the four stroke engine so it will stroke in every two revolutions
    # Therefore
    x = 2


    # Power output(KW) as refered from the formula in this project
    P = n*area*N/(60*1000*x)
    print(' Power Output(KW) of the Engine at 1500 is ' + str(P))
    print('t')


    # Calculating specific fuel consumption of the Engine

    # Given Mass(mg) of fuel burnt in 1 complete cycle
    mass = 20

    # Fuel consumption(Kg/hours)
    FC = N*60*(mass*pow(10, -9)/2)

    # Specific Fuel Consumption((kg/hr)/KW)
    SFC = FC/P
    print(' Specific Fuel Consumption((kg/hr)/KW) is ' + str(SFC))
    print('n')
STEPS :-
1. Import the basic modules matploltib, and scipy.
2. Now, we will check compatibility of the data file with the help of try command and except for execution of any error in the data file
3. In the else command, desired inputs are assigned to read column number, column name and column units as a empty array.
4. Now,, we will execute for loop is used for reading the file line by line and storing the required data using open command. Also, one more variable count is used for keeping the count of the line number which is incremented at the end of every iteration. Inside the primary 'for' loop, two secondary 'for' loops one for storing the column number and the other for storing the column name and units and these loops if is used for storing desired data
5. Now, the first 'for' loop which varies from 0 to 18 with 19 iterations, a 'if' condition is used upto greater than or equal to 2 to avoid storing of the non-required characters. Then secondary 'if' condition is used, upto 'count' is equal to 2 then, an empty array 'column_num' gets appended with the values having integer data.
6. Similarly, another 'for' loops execute in the first for loop upto 0 to 17 with 18 iterations. The for loop runs only for 17 times due to condition provided in the primary 'if' condition provide iside this 'for' loop. Inside this' loop, a 'if' condition is used upto greater than or equal to 1 to avoid storing of the non-required characters. Then, an 'if else' condition is used, firstly an 'if' condition used which executes 'lcount' is equal to 3 then, an empty array 'column_name' gets appended with the values having string data type. Now an 'elif' condition used to executes 'lcount' is equal to 4 then, an empty array 'column_units' gets appended with the values having string data type.
7. Now, another loop of 'if' condition executes which says that if there is not a hashtag ('#') symbol at the start of the line then, then inside this loop secondary 'if' condition is used, which says that if the variable count is greater than or equal to 6 then, the empty arrays term1 and term2 gets appended with the required values having float data type which means that the empty arrays gets appended with values (for the required two parameters) only from the corresponding line of the data file.
8. Then the countor variable is incremeted the end of every iteration. Then, we will plot between the two required parameters is obtained using the plt.plot command. The plot is titled using the plt.title command. Also, the axes are labelled using the plt.xlabel and plt.ylabel commands. The figure window or plot is saved using the plt.savefig command.
9. Now, we will calculate area under PV daigram using scipy.integrate module namely as simps in which we pass both the term1 and term2 arguments with desired initialisation.
10. Then we will calculate and print the value of the power output of the engine and the specific fuel consumption of the engine.
RESULTS :-
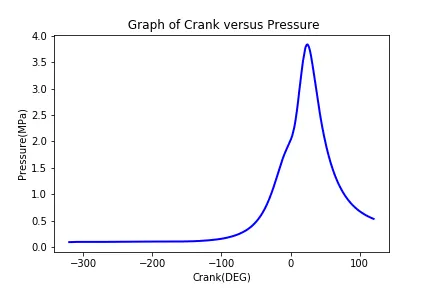
Different plots between data:-
#1:-
Pressure vs Crank:-
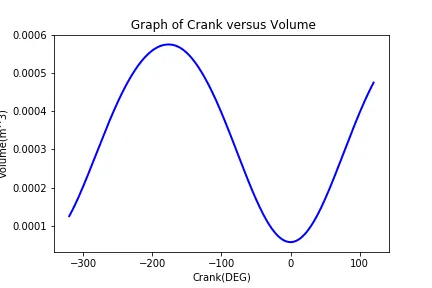
Volume vs Crank:-
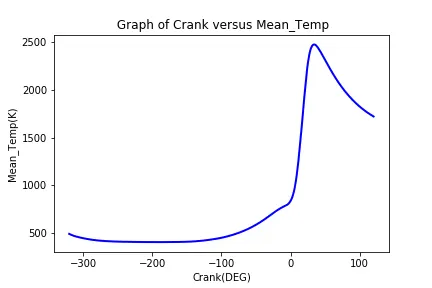
Mean Temperature vs Crank:-
#2:-
Pressure vs Volume (PV Daigram) :-
Desired Results :-