Week 6: Conjugate Heat Transfer Simulation
Objective:
To simulate the Sow through the solid pipe "Conjugate heat transfer" and understand super cycling.
We have to perform the following tasks:
Baseline configuration
• Setup a flow simulation through a pipe
• Inlet Reynolds number should be 7,000
HINT: Use the below formula to calculate velocity for the corresponding value of REYNOLD NUMBER and give
DRICHLET BC for the velocity at the inlet and specify the value for velocity calculated at INLET BC using below
formula,
Re = (rho * V * D) / ( Dynamic viscosity)
• Turbulence modeling - K- Epsilon
• Supercycling parameters
Additional 3D outputs
• Add y+ to your post.in file
Grid dependence test
• Start with an initial base grid
• Run grid dependence test on 3 grids and show that the outlet temperature converges to a particular value
Effect of supercycle stage interval
• Set supercycle stage intervalsdsds to 0.01,0.02 and 0.03
• For these three values, how does the total simulation time compare against the baseline configuration
Brief description of why and where a CHT analysis is used.
The term conjugate heat transfer (CHT) is used to describe processes that involve variations of temperature within solids and fluids, due to thermal interaction between the solids and fluids. The exchange of thermal energy between the two physical bodies is called a study of Heat Transfer, the rate of transferred heat is directly proportional to the temperature difference between the bogies. A typical example is the heating or cooling of a solid object by the flow of air in which it is immersed and some other example includes conduction through solids, free and forced convection in the gases/fluids, and thermal radiation. Typical applications of this analysis type exist as, but are not ed to, the simulation of heat exchangers, cooling of electronic equipment, and general-purpose cooling and heating systems.
Conjugate heat transfer corresponds with the combination of heat transfer in solids and heat transfer in fluids. In solids, conduction often dominates whereas, in fluids, convection usually dominates. Efficiently combining heat transfer in fluids and solids is the key to designing effective coolers, heaters, or heat exchangers. Forced convection is the most common way to achieve a high heat transfer rate. In some applications, the performances are further Improved by combining convection with phase change (for example liquid water to vapor phase change). Heat transfer in solids and heat transfer in fluids are combined in the majority of applications. This is because fluids flow around solids or between solid walls and because solids are usually immersed in a fluid.
Modes of heat transfer
• Conduction: It is a mode of heat transfer due to the transfer of heat from higher energy particles to low energy particles. Only solid to a solid medium.
• Convection: Convection is the mode of heat transfer due to that occurs motion of molecules carrying heat energy from higher energy particle to lower energy particle.
It is solid and fluid communication.
• Radiation: The energy emitted or received by a body when it's above absolute zero Kelvin temperature in the form of electromagnetic waves.
An accurate description of heat transfer modes, material properties, flow regimes, and geometrical configurations enables the analysis of temperature fields and heat transfer.
Typical design problems involve the determination of:
• Overall heat transfer coefficient, e.g. for a car radiator.
• Highest (or lowest) temperature in a system, e.g. in a gas turbine, chemical reaction vessels, food ovens.
• Temperature distribution (related to thermal stress), e.g. in the walls of a spacecraft.
• Temperature response in time-dependent heating/cooling problems, e.g. engine cooling, or how fast does a car heat up in the sun and how is it affected by the shape of the windshield?
The fluid flow and heat transfer problems can be tightly coupled through the convection term in the energy equation and when physical properties are temperature-dependent. While analytical solutions exist for some simple problems, we must rely on computational methods to solve most industrially relevant applications.
CHT can be performed to improve the cooling performance of the water jacket and increase engine life. Advancements in cooling for applications such as gas turbine components require an improved understanding of the complex heat transfer mechanisms and the interactions between those mechanisms, which our engineers can perform without hassle. Critical cooling applications often rely on multiple thermal protection techniques, including internal cooling, external film cooling, etc. which are efficiently used by our analysis to cool components and limit the use of coolant. We do extensive support for Motor and Battery CHT Analysis to get an optimized design for high voltage systems. external film cooling, etc. which are efficiently used by our analysis to cool components and limit the use of coolant. We do extensive support for Motor and Battery CHT Analysis to get an optimized design for high voltage systems. We do extensive support for Motor and Battery CHT Analysis to get an optimized design for high voltage systems. Conjugate Heat Transfer analysis provides the temperature distribution in solid and coolant of the engine and clear insight on velocity distribution and mechanism of heat transfer of coolant. Results of CHT analysis become input to structural simulations as thermal loads.
We have a wide experience in Engine CHT Analysis for various types of engines like Bikes, Passenger Cars, Racing cars, Commercial Vehicles, Marine, Agricultural equipment and Earth-moving equipment etc.
Mathematical Modeling:
Conduction
Convection
Radiation
Super Cycling Concept:
Super cycling is a technique that is used in Converge studio in the case of conjugate heat Dane( solid and liquid regions. The main problem is that both solvers cannot run at the same speed since solves much faster owing to the time scale difference for heat transfer in liquids as compared to the so problems during the solution given that the solid side solver would not have reached a steady stat the time the liquid solver does. This is where the concept of super cycling is based. The basic idea of super cycling is that the solver for the fluid domain is paused until the solver for the converges. The following steps are involved in performing the super cycling.
1. Solve the fluid and the solid together with the transient solver. store the instantaneous Heat ti
and temperature on the interface during the process.
2. freeze the fluid solver. Time-averages the Heat transfer coefficients and temperatures and
boundary conditions at the interface.
3. Solves the solid temperature until it reaches a steady state.
4. Update the solid temp field and unfreezes the fluid solver.
5. Repeats until the solid temp converges.
Calculate velocity at inlet based on Reynold numbers:
Given:
Re No = 7000
Density = 1.161 kg /m^3
dynamic viscosity = 0.00001846 kg /ms
Velocity calculation based on Reynold numbers
V= 3.71 m/s
Skin friction drag co-efficient Cf = 0.058Re^-1/5
C_f (0.058)(700o ^-1/5) = 0.0098720736
Frictional velocity = uv = 0.2606532261
Assume the desired Y + = 32
The first cell center to boundary distance = Y+
= 32 * 0.000015859/0.2606532261 = 0.0019469853m
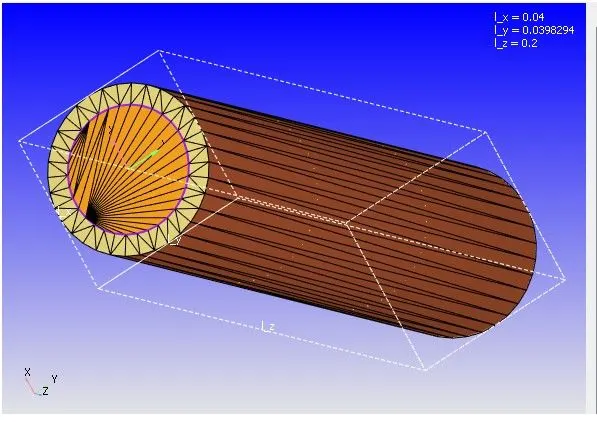
Geometry dimensions:
Inner diameter = 0.03 m
Thickness diameter = 0.01 m
Length of pipe = 0.2 m
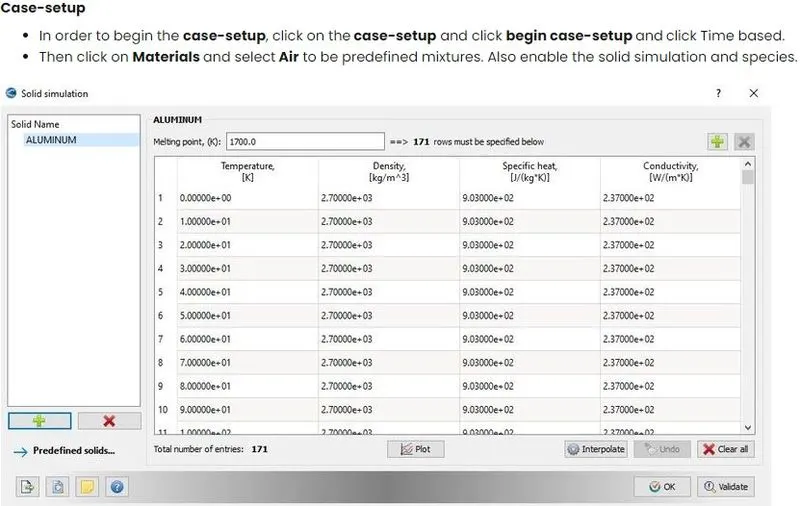
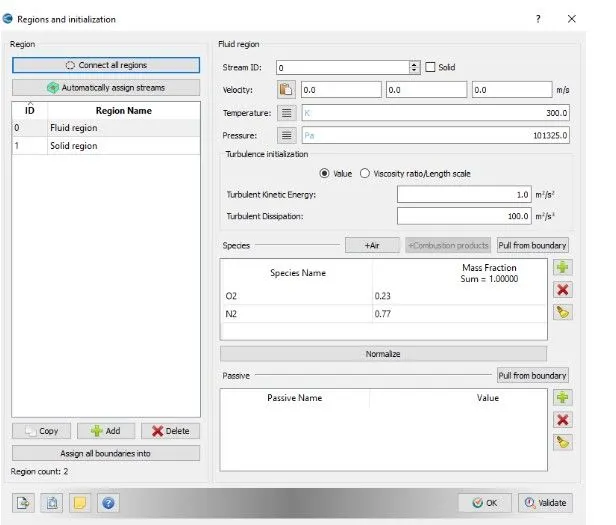
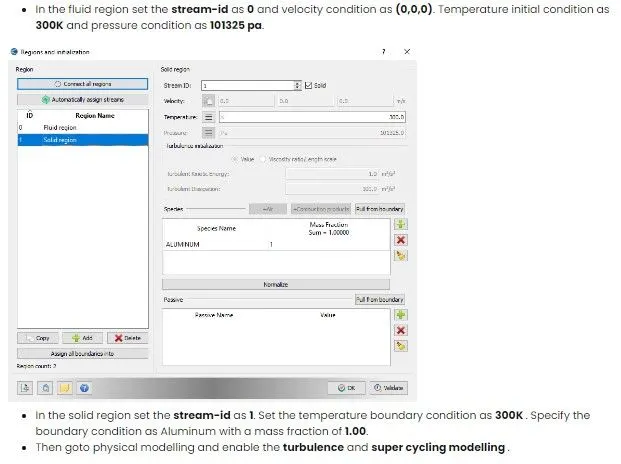
• Then open the Gas simulation and Global transport parameters and retain the default setting. Then open the
species tab, in the Query available list choose the Aluminum as a solid species. Then goto gas and in the
Query the available list, and choose N2 and 02 as a gas species.
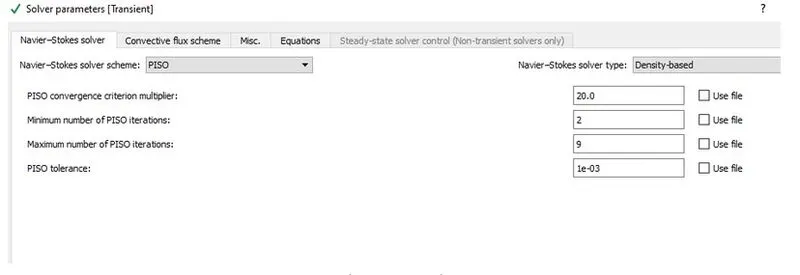
• Then click on the Run Parameter under the Simulation Parameter and choose the transient solver under
the solver tab and then choose the Full Hydrodynamic under the simulation model. And then choose
the Compressible under the Gas flow solver.
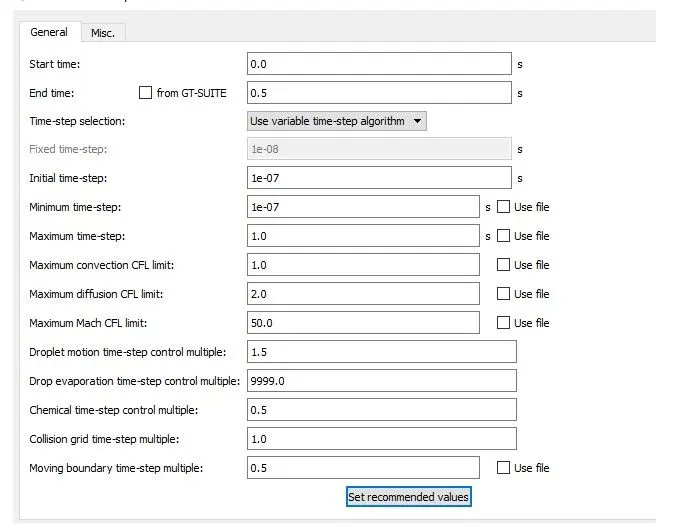
• In the simulation time parameter do the following changes.
Add the boundaries by clicking create multiple boundaries to create all boundaries at a once and name them like Outer_solid_wall, Solid_wall, inlet, outlet, and interface by selecting the respective triangles. like Outer_solid_wall, Solid_wall, inlet, outlet, and interface by selecting the respective triangles.
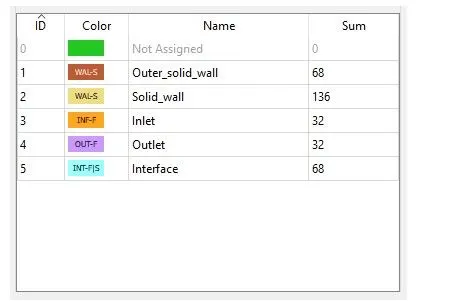
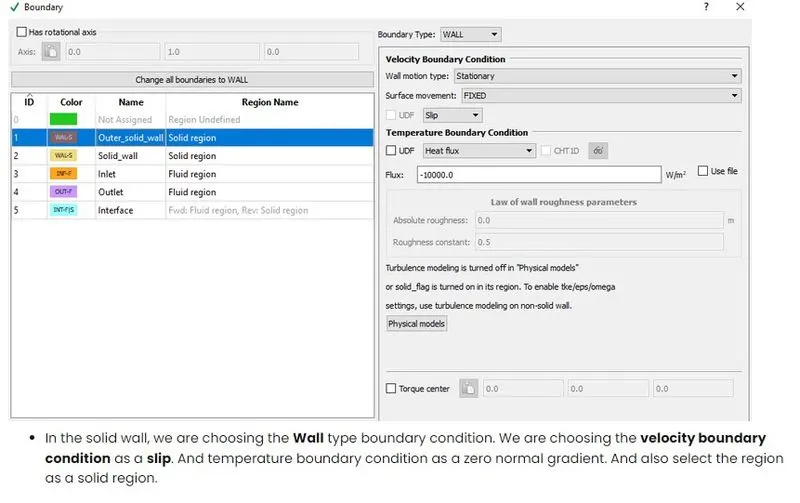
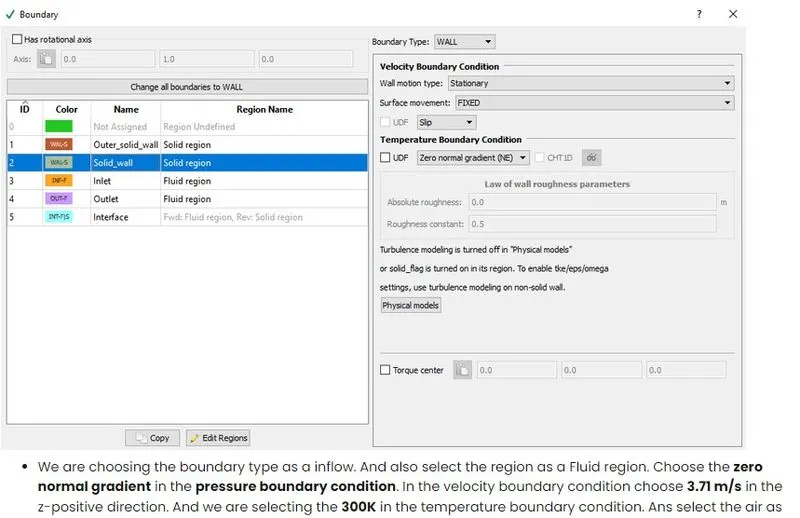
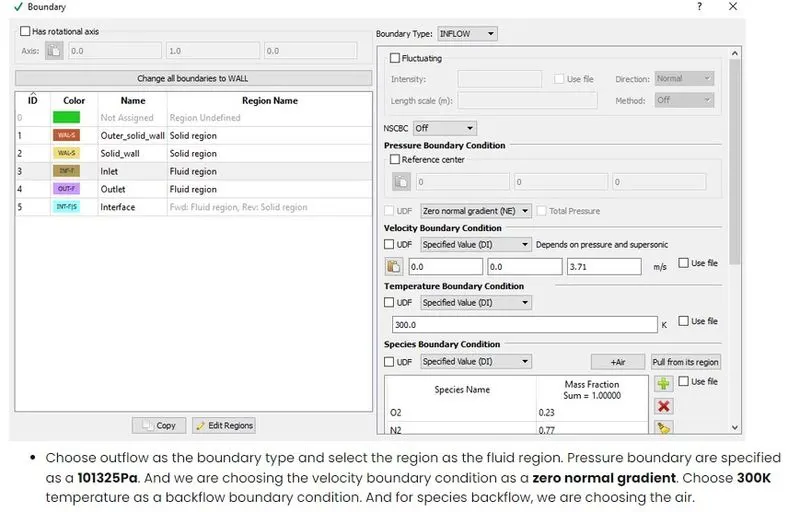
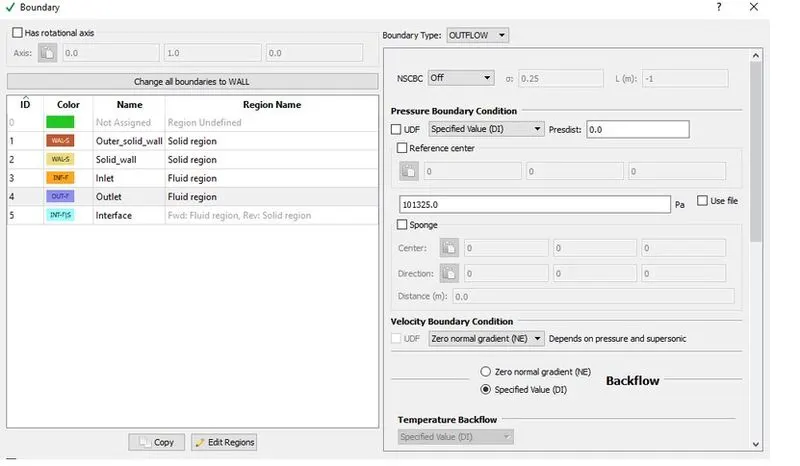
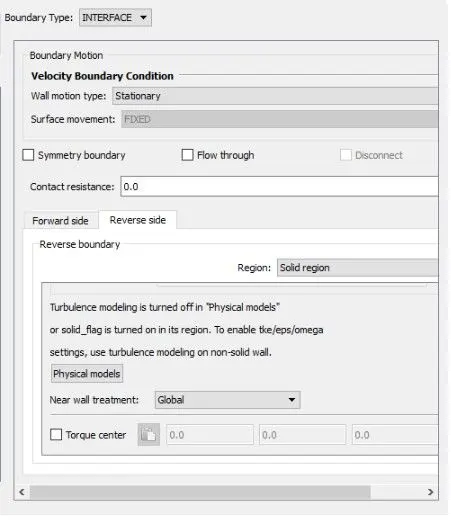
• In interface, it has forward and reverse direction.
• If you have hide the inlet boundary, we can see that normals are pointing towards the fluid domain that
direction is called the forward direction for an interface boundary.
• If the normals pointing towards the solid, then the foward direction indicates the solid region.
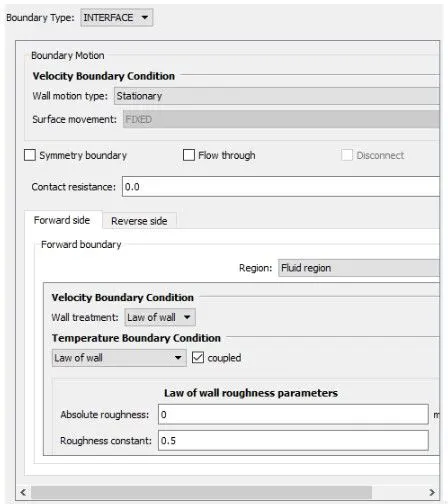
• Internally we are going to say that we have two boundaries forward and reverse boundary. Internally when
converge runs, its going to create the copy of the interface boundary, one belonging to the fluid side and other
belonging to the other side.
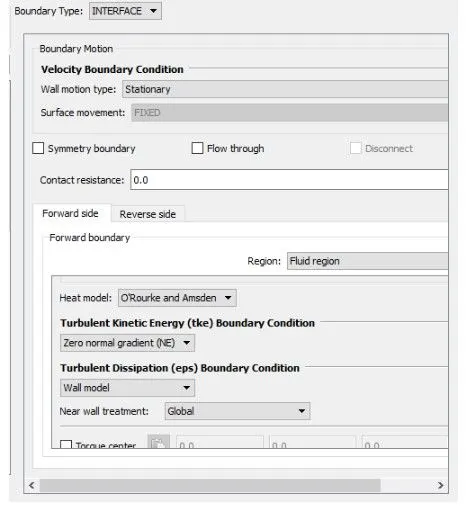
• So far the Forward boundary that is toward the fluid region. And for the fluid region the boundary need the law
of wall boundary condition.
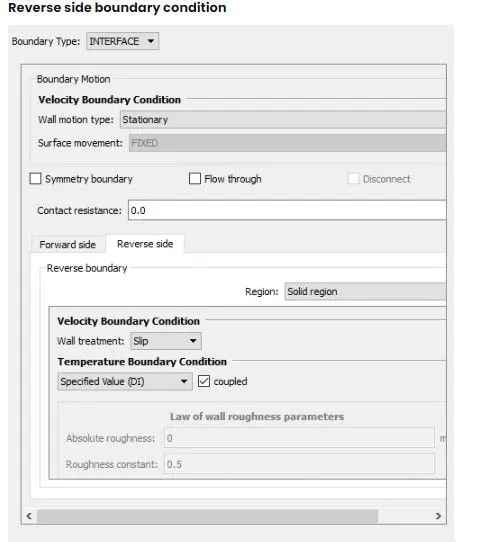
• And for the reverse region pointing toward the solid region.
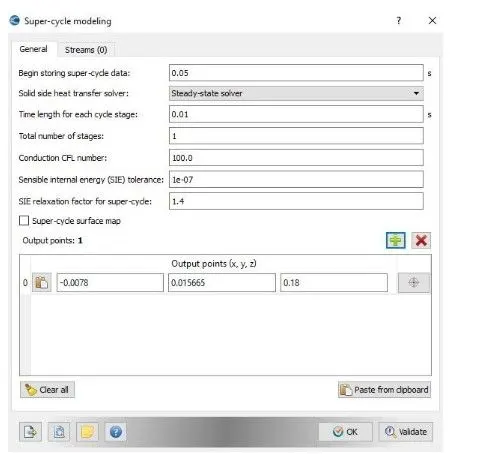
• The first option is to set the initial time at which the super-cycle begins storing data. This can be set from 0 to
any value less than or equal to the total simulation time.
• The solvers used for the solid region can be a steady or transient solver that is independent of the solver set in
the run parameters window and can be steady or transient.
• The time length of each cycle determines the intervals at which the fluid domain is paused and the solid
domain solved for. This interval is taken into account after the initial pause of the fluid solver at 1.
• The CFL number, SIE tolerance, and relaxation factors are solver parameters that are given for the purpose of
accuracy and speed of the solver.
• An output point must be defined in the solid region to let the solver know at which the temperature data must
be calculated. This point must be given in the solid domain as the solver runs for the solid domain and once this
value converges, the fluid domain solver is continued.
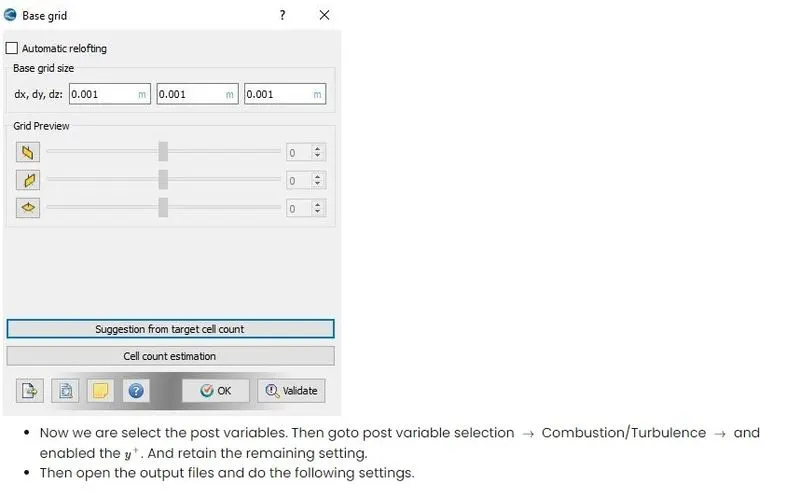
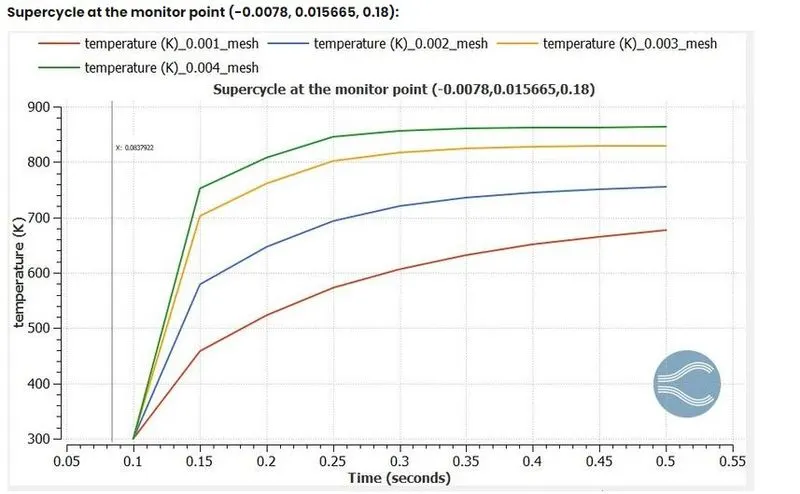
• We are running the simulation using three base grid which is 0.0W, 0.002, 0.003, and 0.004.
Mesh representation is 0.01
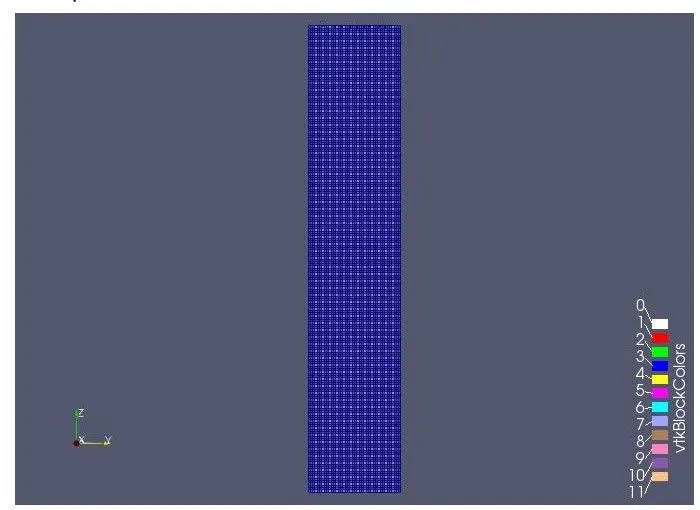
Mesh representation is 0.02 :
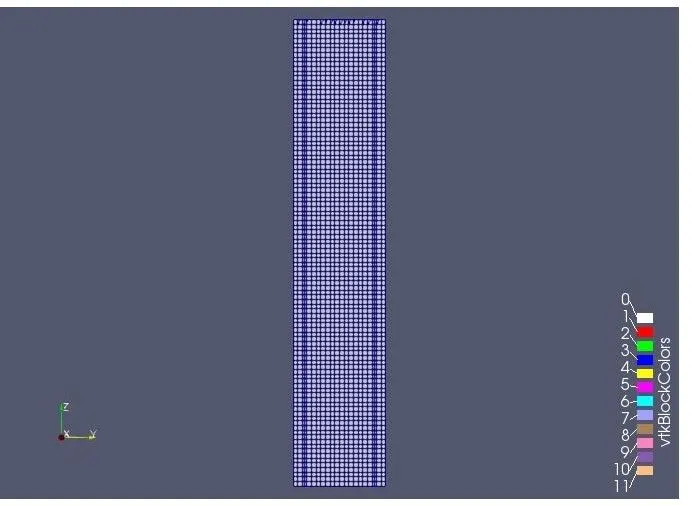
Mesh representation is 0.03:
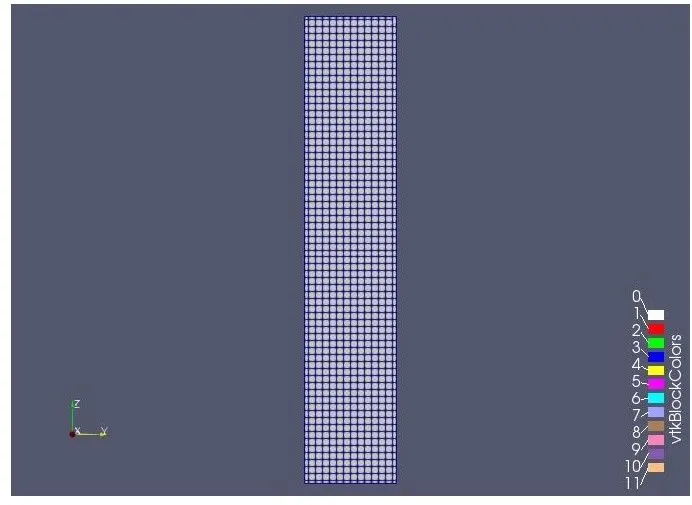
Mesh representation is 0.04:
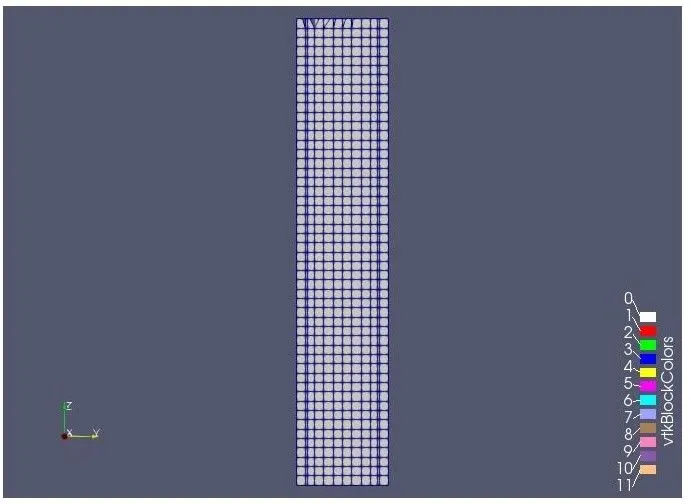
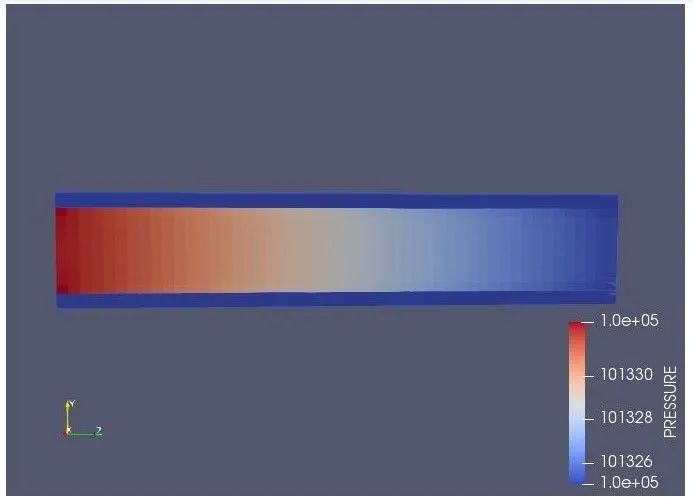
Pressure contour at 0.01 mesh:
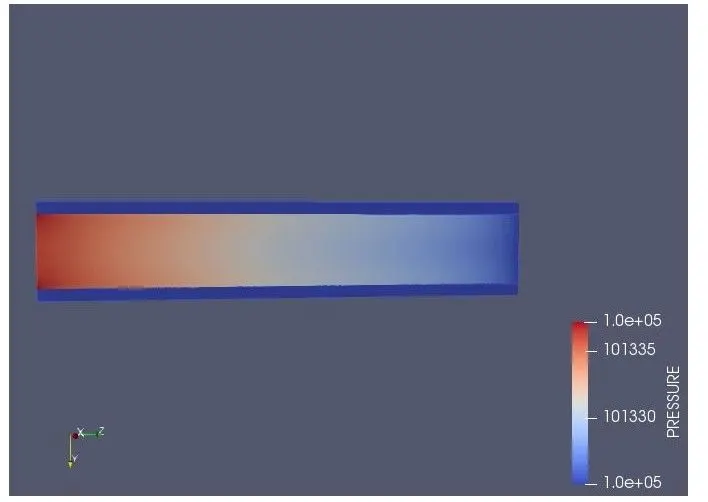
Pressure contour at 0.02 mesh:
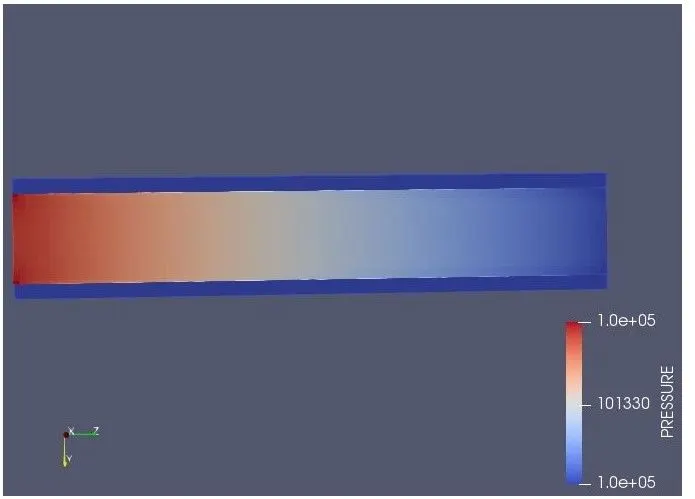
Pressure contour at 0.03 mesh:
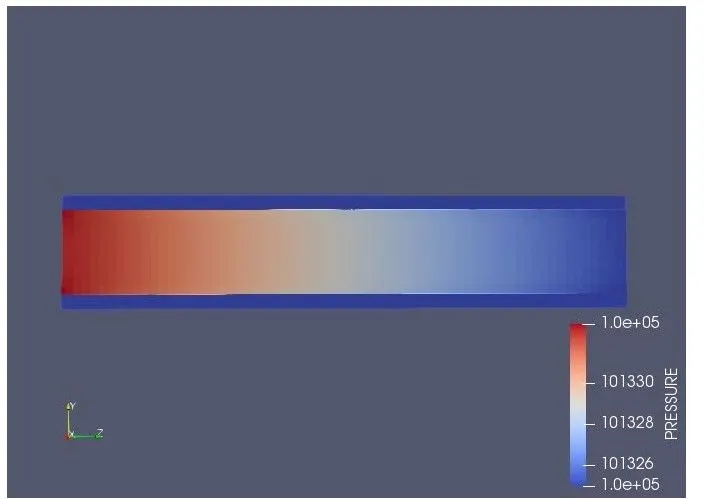
Pressure contour at 0.04 mesh:
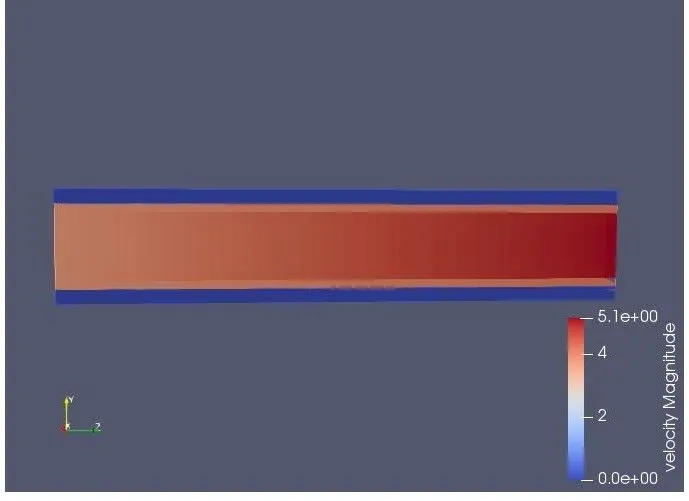
Velocity contour at 0.001 mesh:
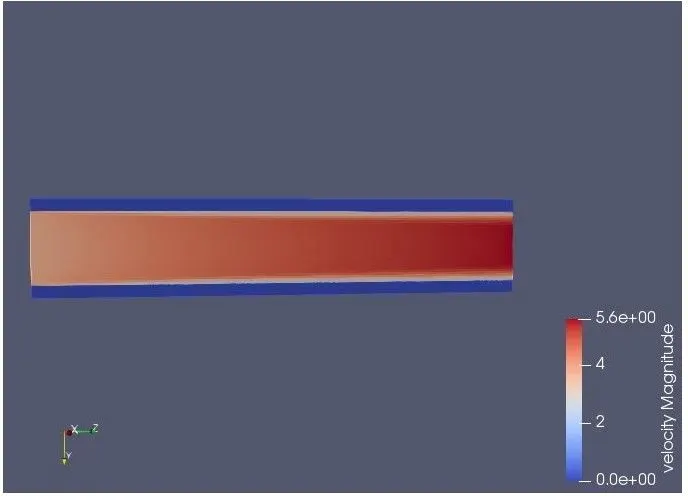
Velocity contour at 0.002 mesh:
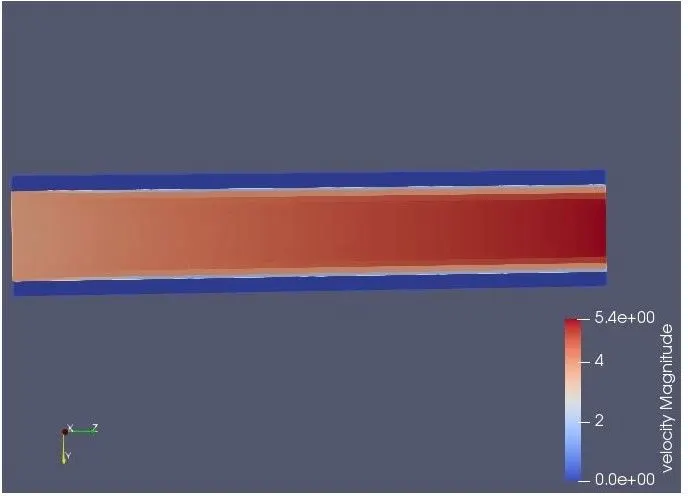
Velocity contour at 0.003 mesh:
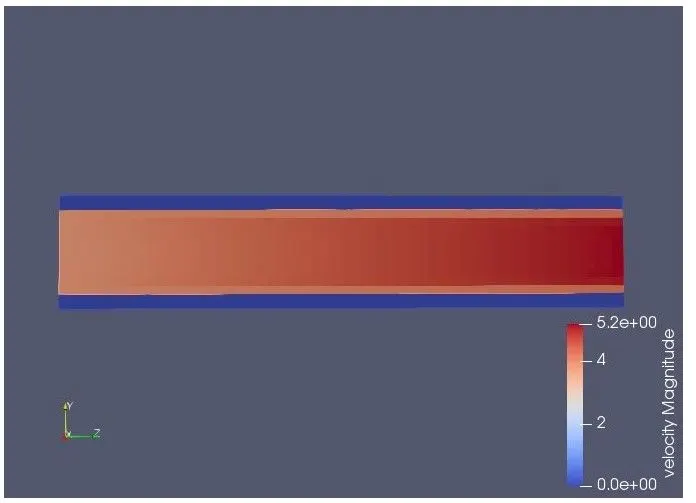
Velocity contour at 0.004 mesh:
Y plus contour at 0.001 mesh:
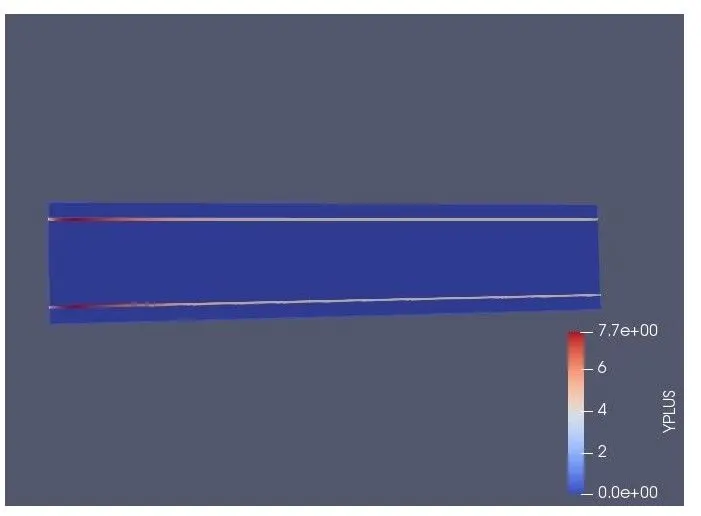
Y plus contour at 0.002 mesh:
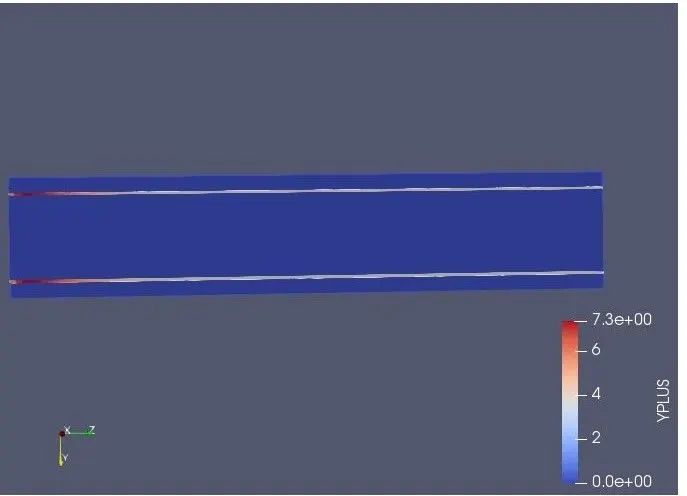
Y plus contour at 0.003 mesh:
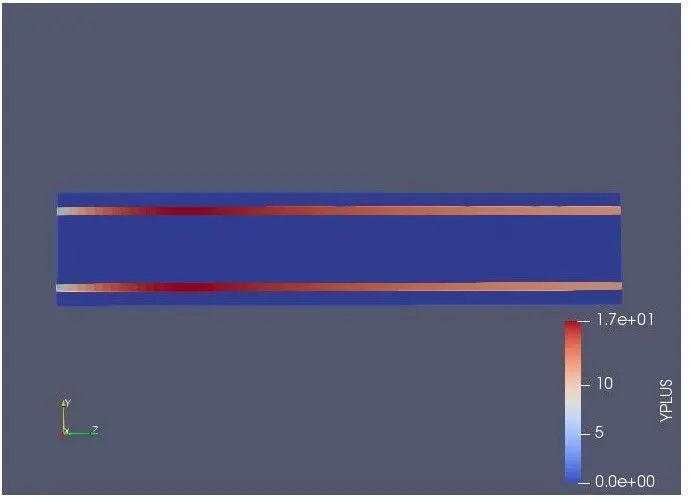
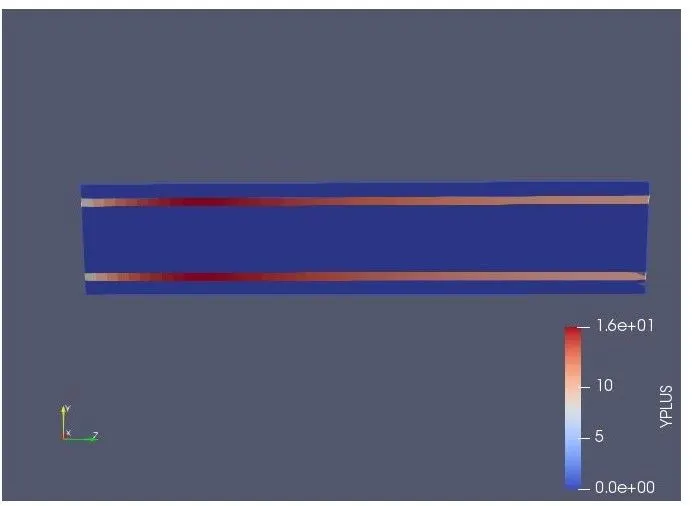
Y plus contour at 0.004 mesh:
Near wall modelling it is well-known that the mesh size should be small enough because near wall regions have
large gradients in the solution variables. The wall y' is a non-dimensionalized distance similar to local Reynolds. When
you are solving your CFD simulations, you need to provide boundary conditions. And for your turbulence equations
to perform correctly, you need to make sure that your first cell height is in the right location. Inside the boundary layer that y- plus is useful here is a simple example. If you take the k-epsilon equation that is called the high Reynold number equation.
y- plus is useful here is a simple example. If you take the k-epsilon equation that is called the high Reynold number equation.
It is not applicable in the scenario where flow is laminar and flow is laminar inside the viscous sublayer. And the value
of y-plus is between land 10. k-epsilon model is only used in the outer region, where y-plus is between 30 and 100. And
y-plus of 30 means that you are 30 times this characteristics length away from the wall.
In the above y-plus contours we can easily observe that the for the different sizes of mesh the values of the y-plus are
given in the following table.
Mesh size Y-plus
0.001m 7.7
0.002m 7.3
0.003m 17
0.004m 16
At the finer mesh, we got the low value of mesh and at the coarser mesh, we got the high value of mesh.
Temperature contour at 0.001 mesh:
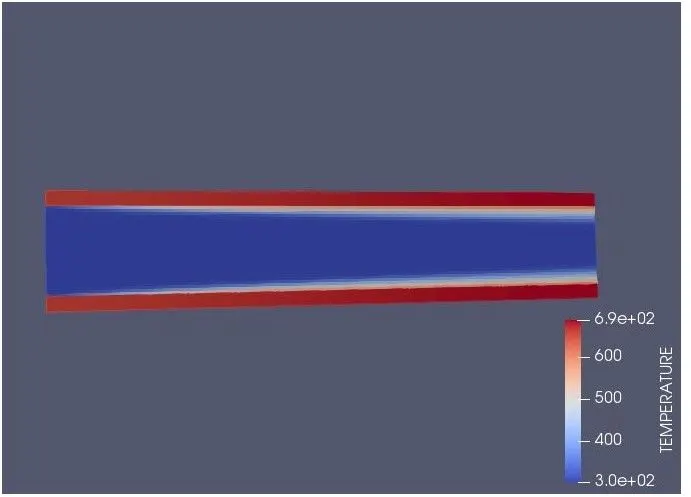
Temperature contour at 0.002 mesh:
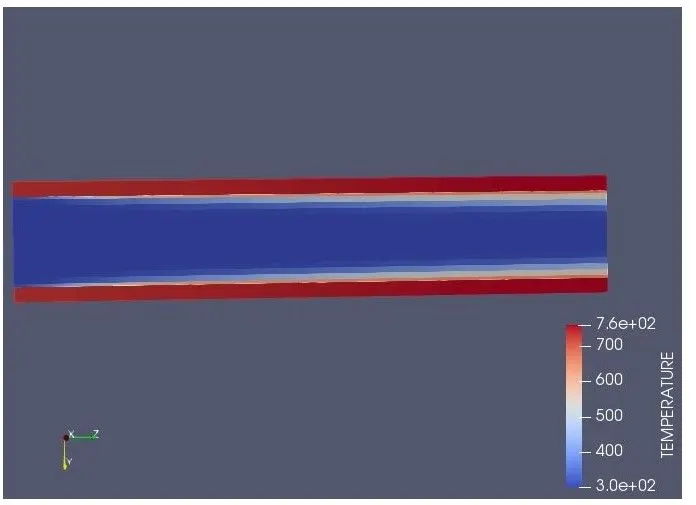
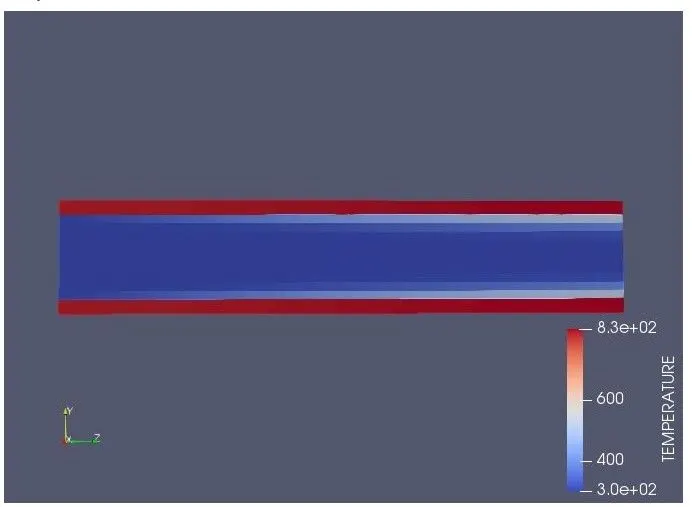
Temperature contour at 0.003 mesh:
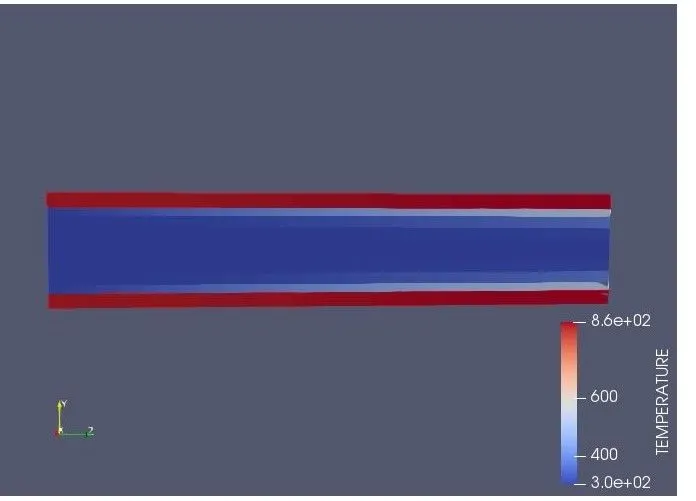
Temperature contour at 0.004 mesh:
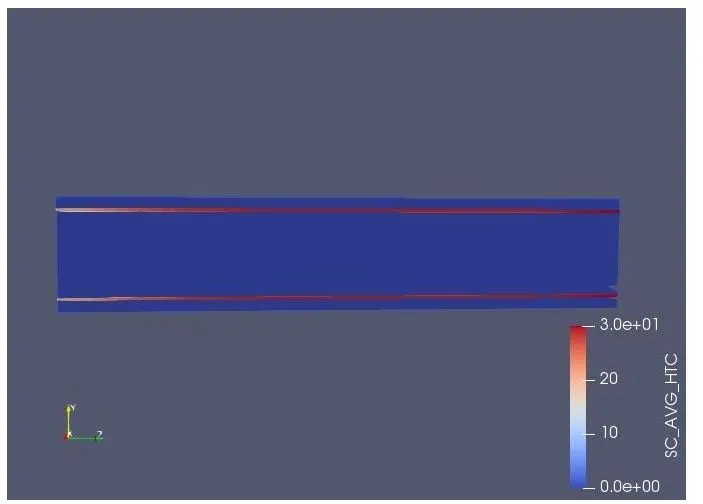
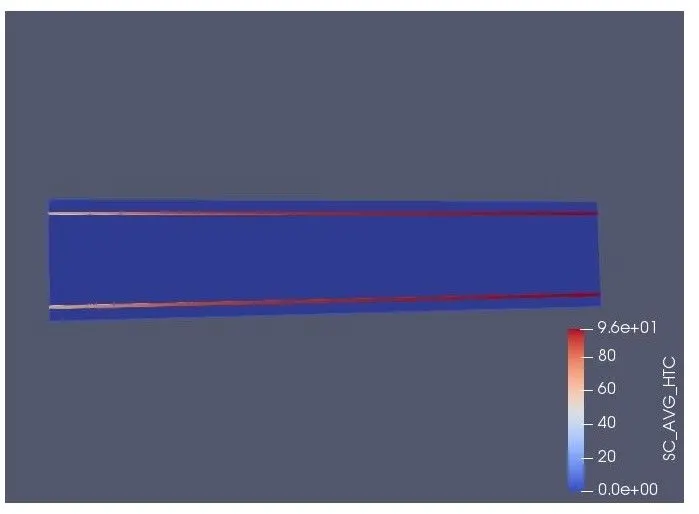
SC_AVG_ HTC at Mesh 0.001:
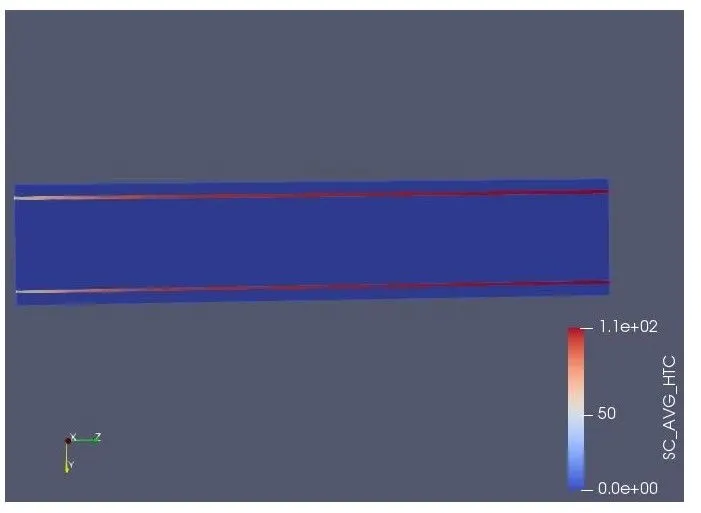
SC_AVG_ HTC at Mesh 0.002:
SC_AVG_ HTC at Mesh 0.003:
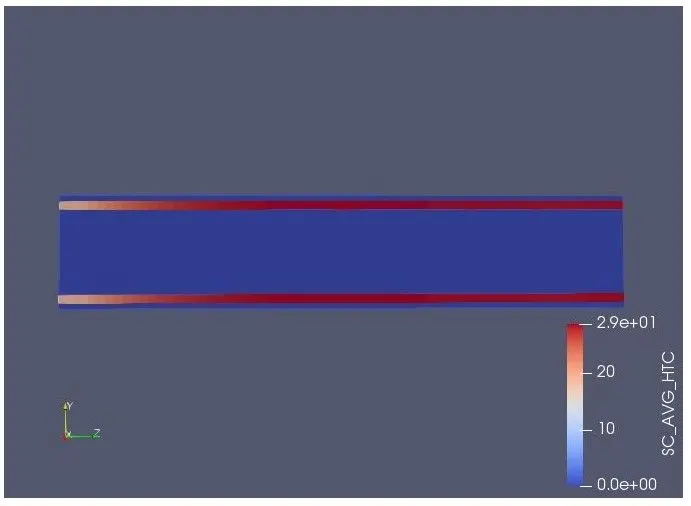
SC_AVG_ HTC at Mesh 0.004:
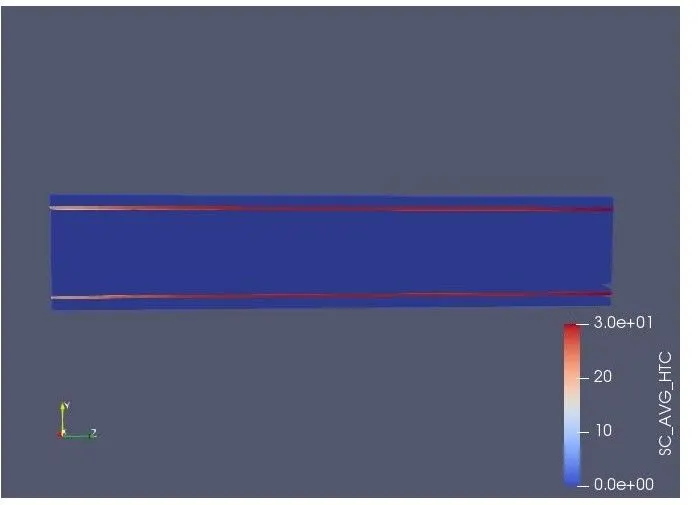
SC_AVG_ Temperature at Mesh 0.001:
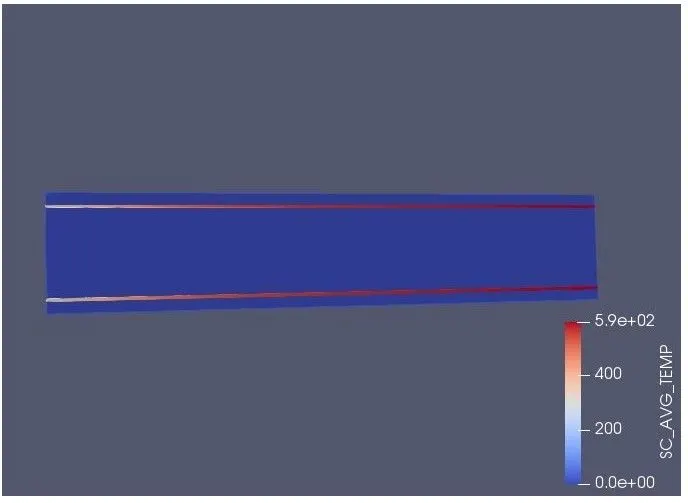
SC_AVG_ Temperature at Mesh 0.002:
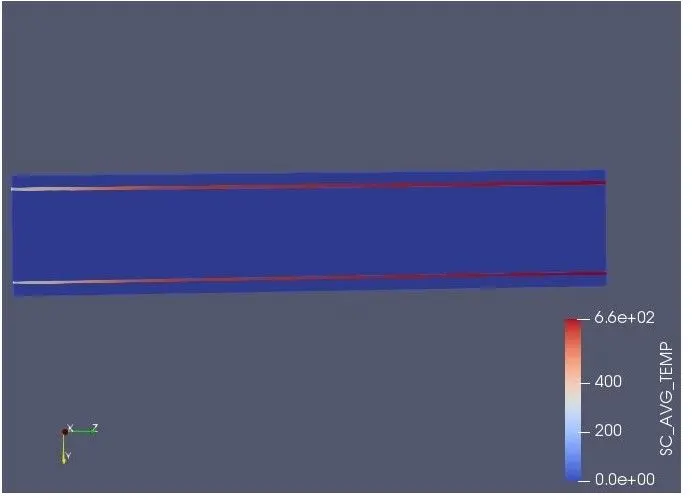
SC_AVG_ Temperature at Mesh 0.003:
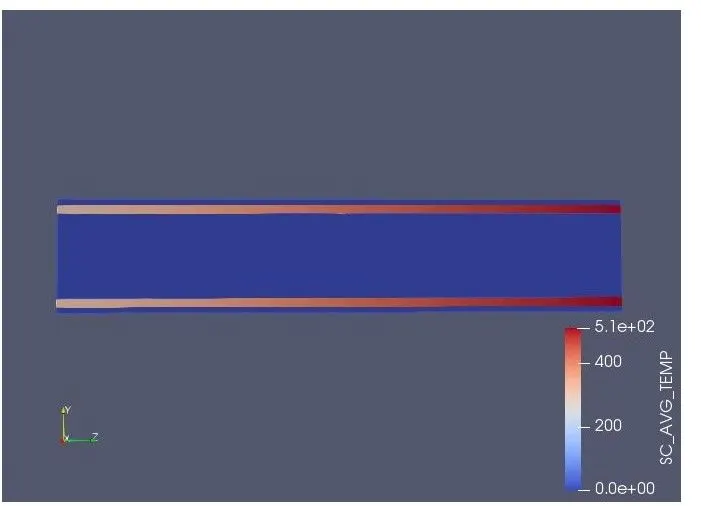
SC_AVG_ Temperature at Mesh 0.004
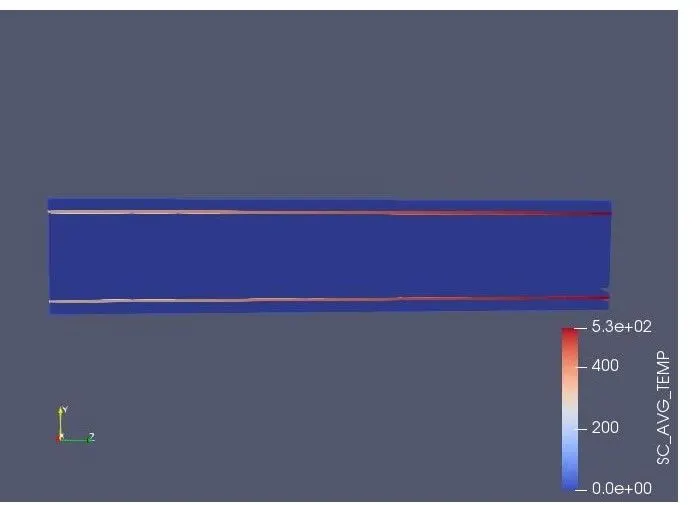
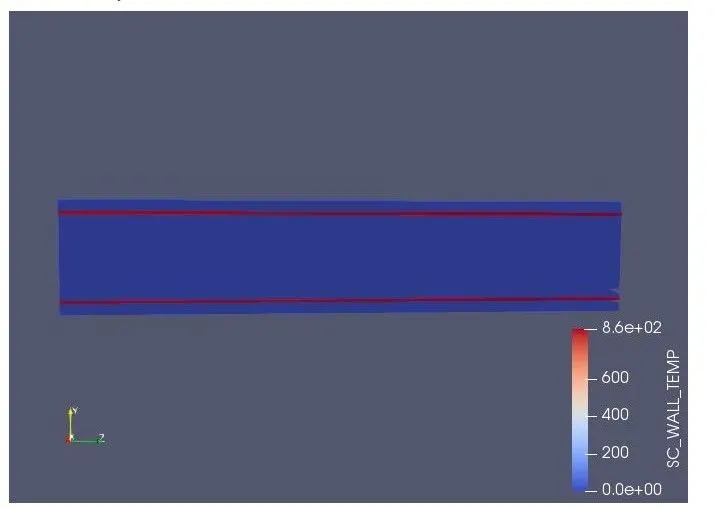
SC _ Wall_ Temperature at Mesh 0.001:
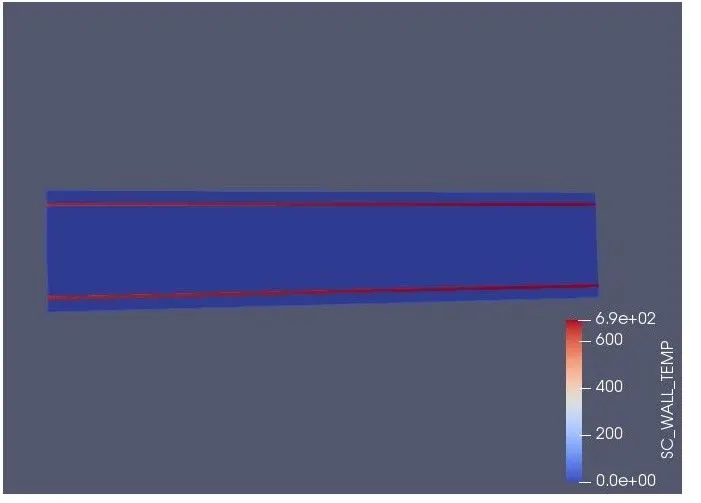
SC _ Wall_ Temperature at Mesh 0.002:
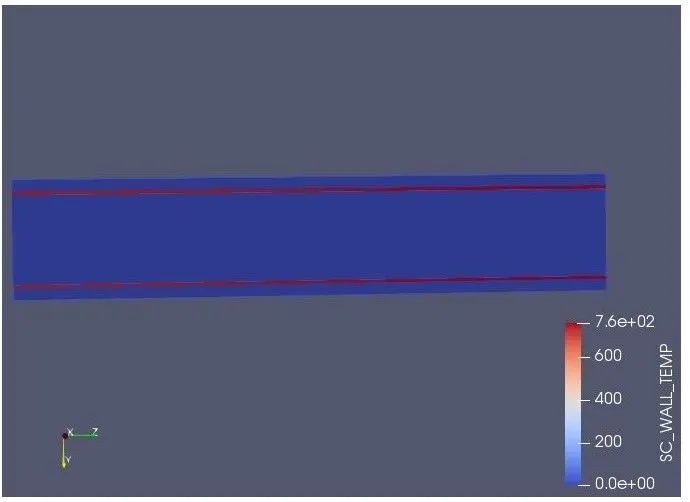
SC _ Wall_ Temperature at Mesh 0.003:
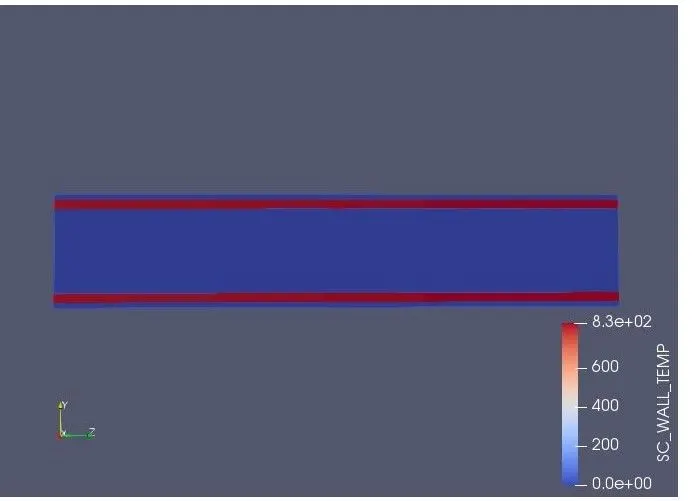
SC _ Wall_ Temperature at Mesh 0.004:
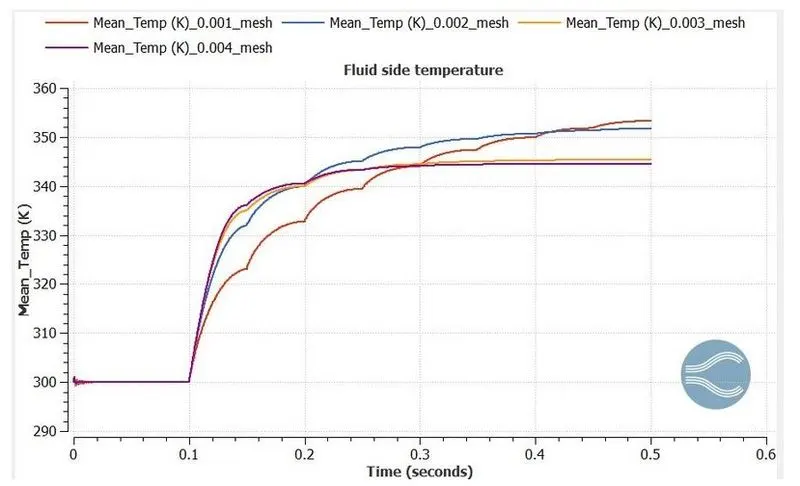
Results
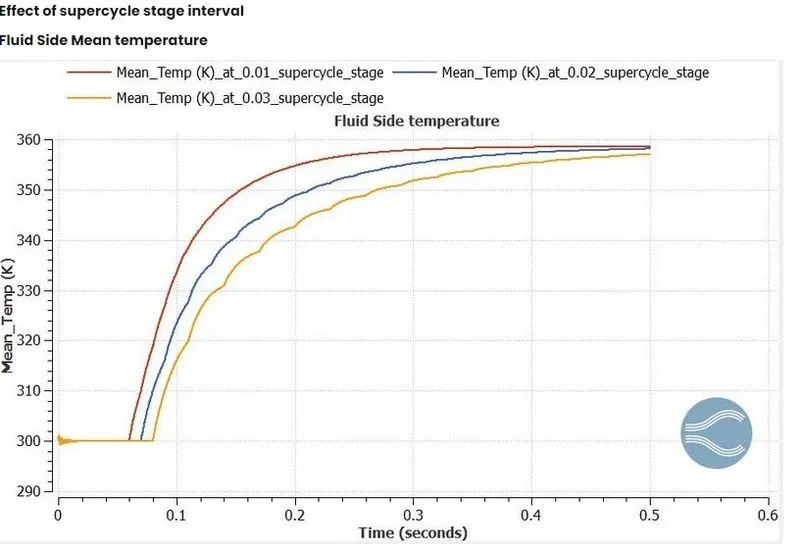
Fluid side tempearture:
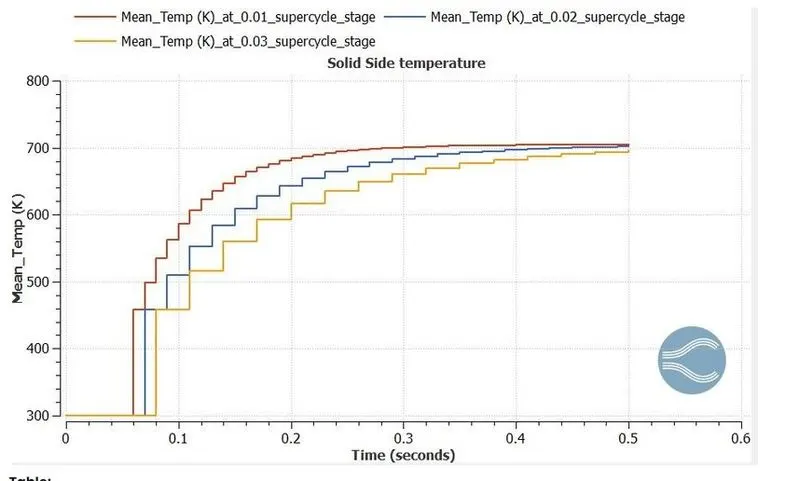
Soild side temperature:
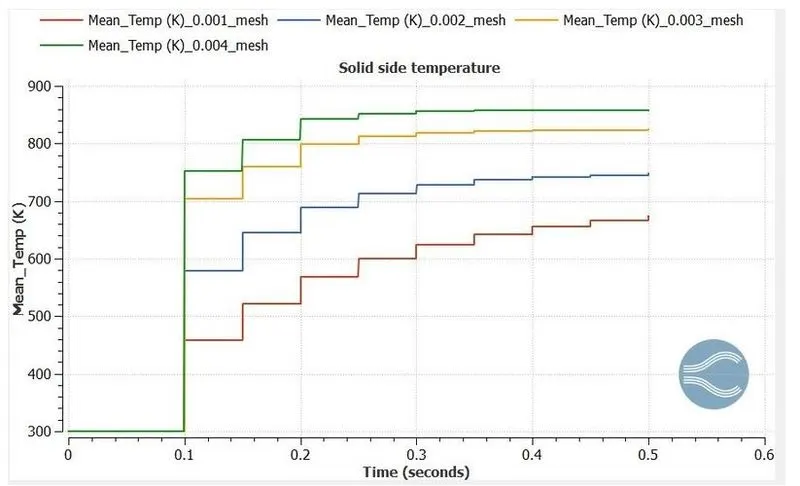
Solid side Mean temperature:
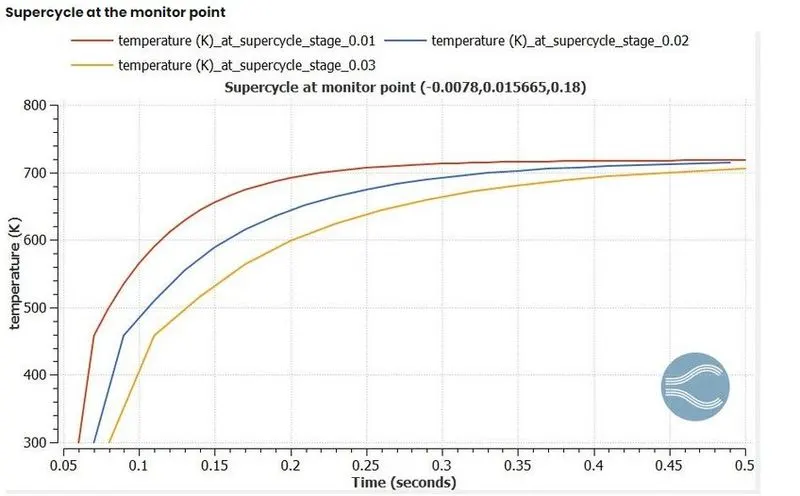
Supercycle stage Temperature
interval Value
0.01 717.875
0.02 714.077
0.03 704.367
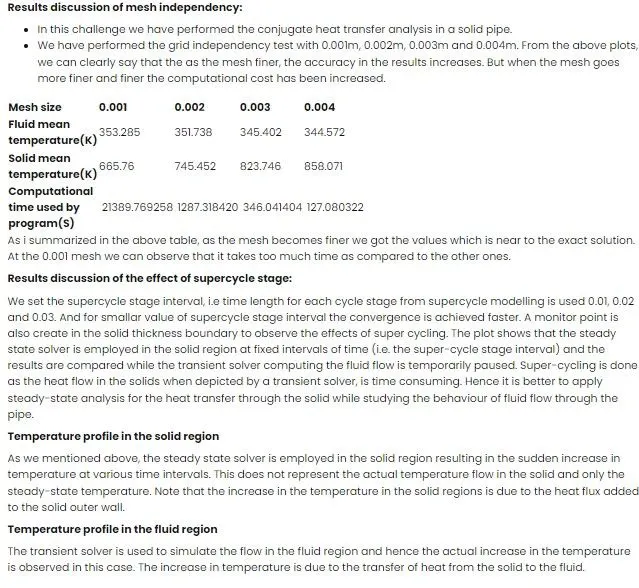
In the above results, we set the different values of supercycle stage intervals. The time length for each cycle stage from super cycling modeling to 0.01, 0.02, and 0.03. In the supercycle, mode converges continue to solve both the fluid and solid equations and store the heat transfer coefficient and near-wall fluid cell temperatures for a time equal to the supercycle stage interval. In the start converge solves both fluid and solid equations together using the transient solver (but does not store the solid heat transfer data ) from the start of the simulation until the supercycle start time in order to develop the fluid flow field. At supercycle start time converge begins storing values for a heat transfer coefficient and near-wall temperature for each cell at the solid/fluid interface, one value for each time-step. In the above plots, we can easily observe that setting the lower value of the supercycle stage interval converges to the exact values of temperatures. Basically we increase the value of supercycle stage interval from 0.01 to 0.03. we got the more exact values at 0.03 supercycle stage interval.
Time at Mesh 0.001: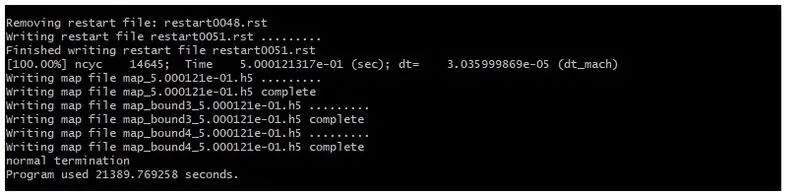
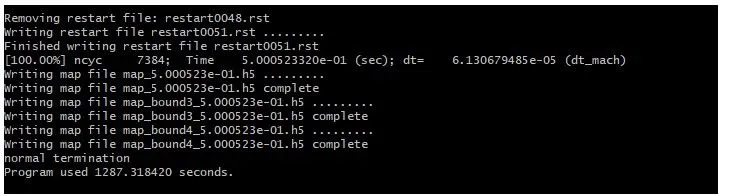
Time at Mesh 0.002:
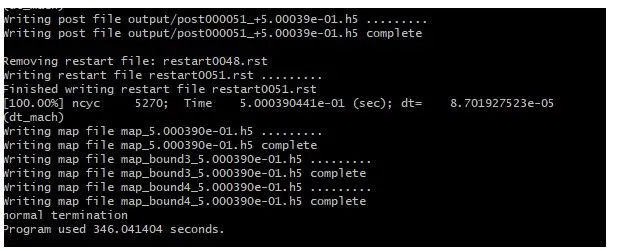
Time at Mesh 0.003:
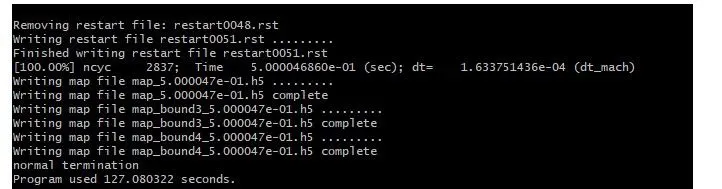
Time at Mesh 0.004:
SC_AVG_ HTC at Mesh 0.001:
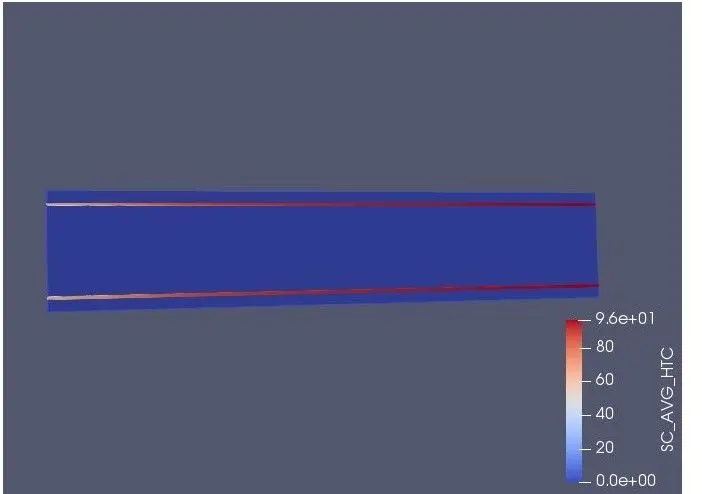
SC_AVG_ HTC at Mesh 0.002:
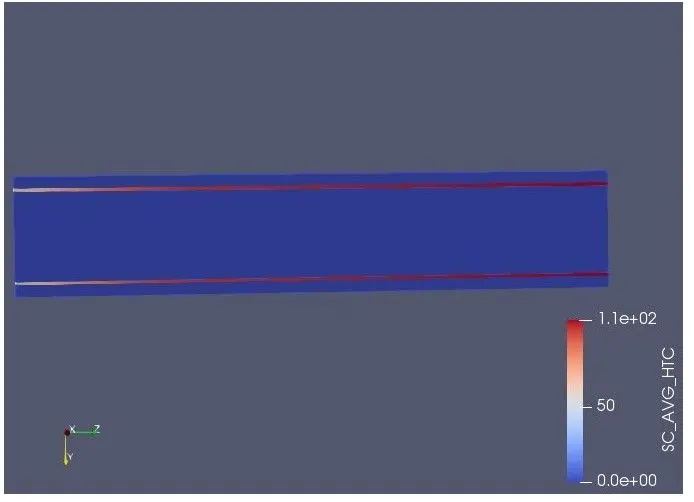
SC_AVG_ HTC at Mesh 0.003:
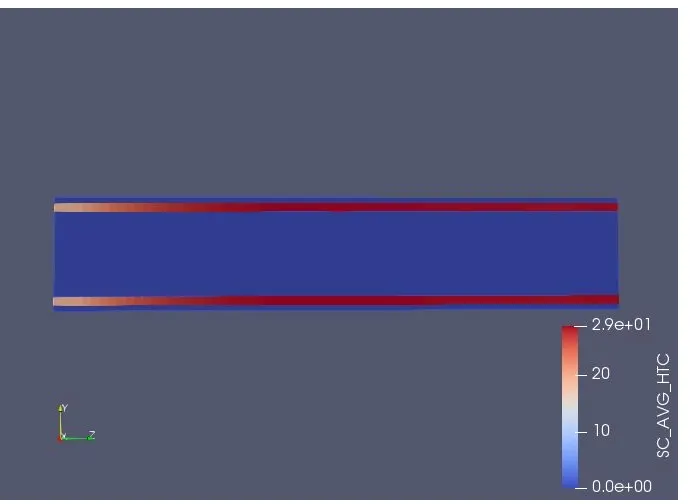
SC_AVG_ HTC at Mesh 0.004: