Week 6 - CHT Analysis on a Graphics card
AIM
To perform steady state Conjugate Heat Transfer analysis on a model of a graphics card using ANSYS software.
OBJECTIVE
- To run the simulation by varying the inlet fluid velocity from 1m/sec to 5m/sec for at least three velocities.
- To find out the maximum temperature and heat transfer coefficient attained by the processor.
- To identify the potential hot spots in the model.
THEORY
The Conjugate Heat Transfer (CHT) analysis is the study of the heat transfer between a fluid-solid interface. In this method the thermal energy is exchanged between the interfaces. This method is useful in combining the heat transfer in fluids and heat transfer in solids.
The advantage of CHT analysis over conventional heat transfer analysis is that simultaneous solution of flow field of the fluid and temperature field of solid are carried out. Hence the CHT analysis gives accurate predictions in practical coupled heat transfer situations.
PROCEDURE
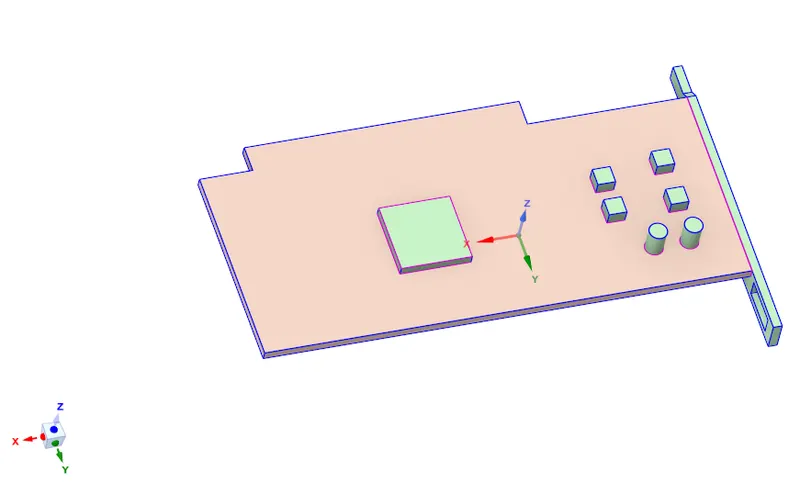
- The geometry was made using the space-claim software in ANSYS. The 3-D geometry created using this software is shown below ,
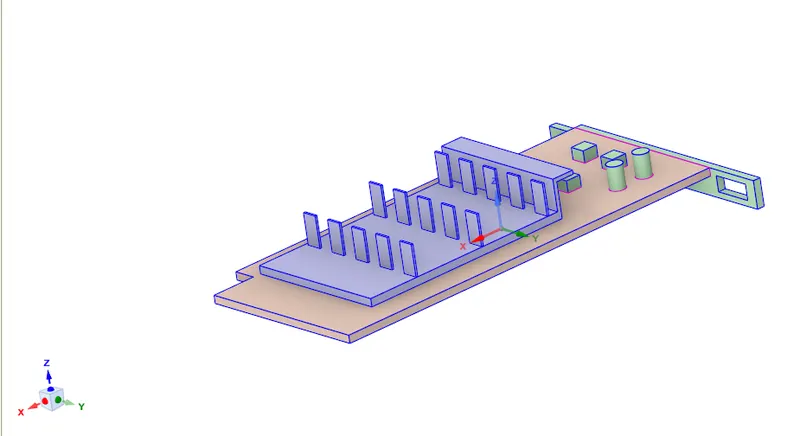
- A heat sink is placed on top of this graphics card as shown below,
- An enclosure is placed around this graphics card geometry. This enclosure represents the fluid volume. This is as shown below,

- The share topology tool has been used to get conformal mesh.
- To mesh this geometry ANSYS meshing software is used.
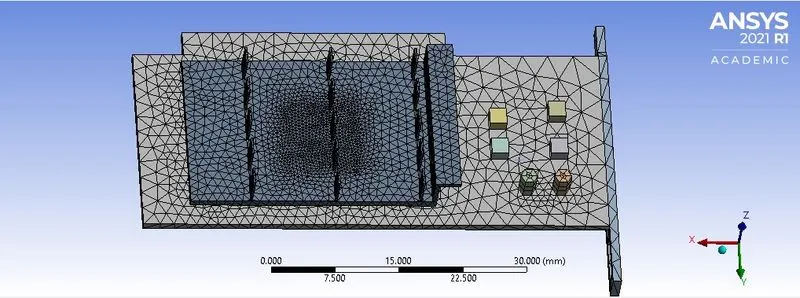
- To refine the mesh at the locations of interest , body sizing has been applied.
- The enclosure is given a body sizing with element size of 3mm , for the heat sink body sizing was done with element sizing of 1mm and for the processor the element size given was 0.2mm .
- The meshed geometry is shown below,
Cross-sectional veiw ,
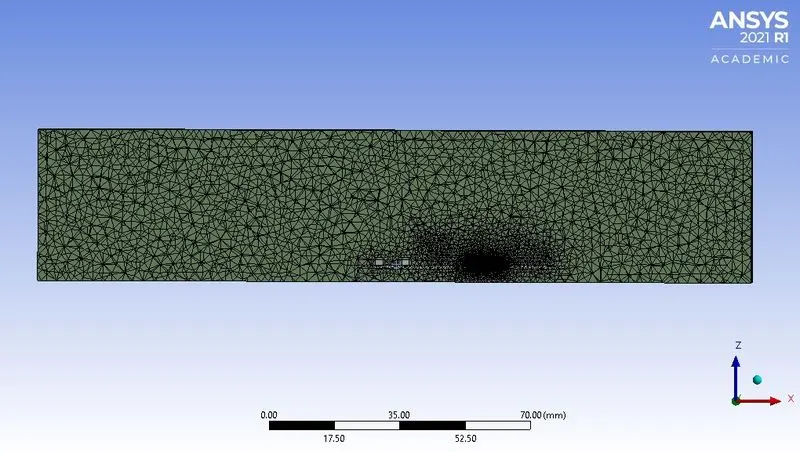
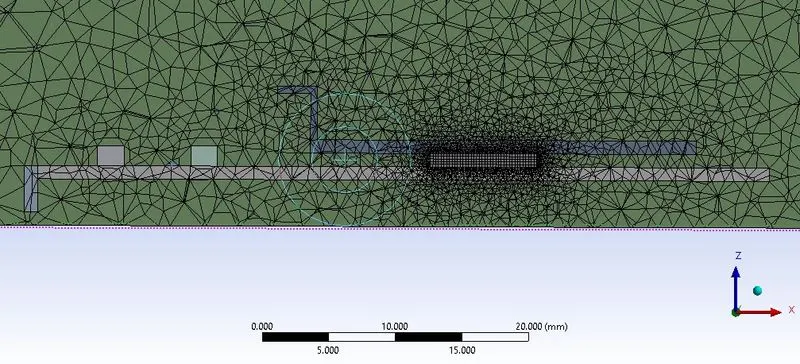
- This generated mesh has 398039 cells in total.
- Also different parts are given the names so as to identify those parts.
SIMULATION SET-UP
- Pressure based steady state solver is used and the solution scheme is Coupled pressure-velocity coupling.
- The turbulence model used is standard k-epsilon.
- The energy equations are used.
- The material used for the fluid is air , for the processor it is aluminium , for the base of the graphics card it is wood and for that of heat sink the material used is copper.
- The materials used for different parts are as follows,
Fluid enclosure :- Air
Graphics card processor :- Aluminium
Heat sink :- Copper
Graphics card base :- Wood
- The heat source is the processor and a source term is defined for the same. The power density value is `3.125"*"10^8W/m^3`. This value is calculated by dividing the heat generated in watts by volume of the processor.
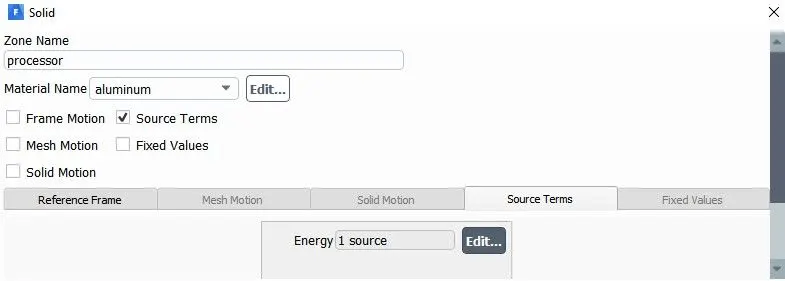
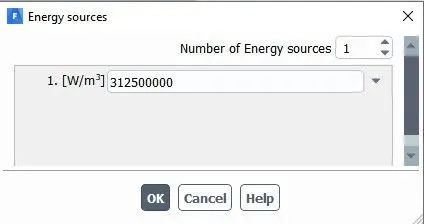
- The simulations are carried out for three different inlet velocities of 1m/s , 3m/s and 5m/s. The temperature of this fluid is given as 300K.
- The outlet boundary condition is given as 1 atm pressure.
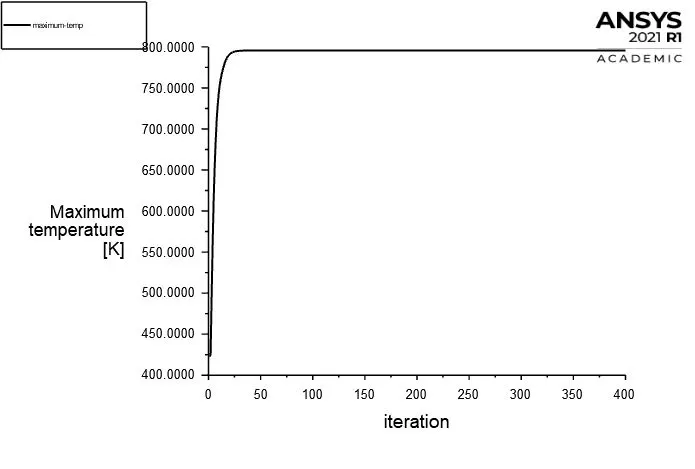
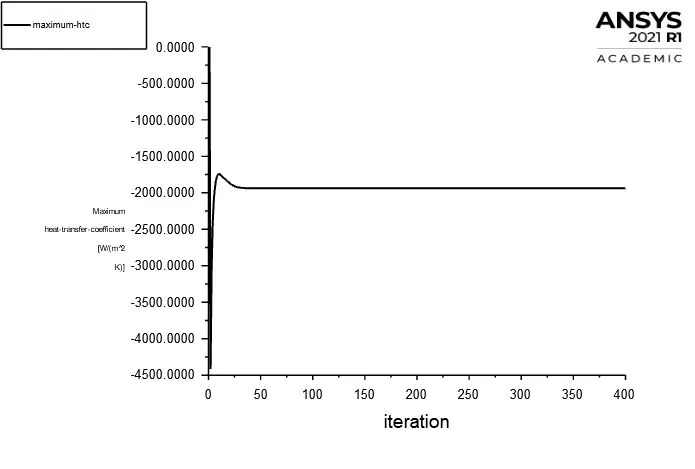
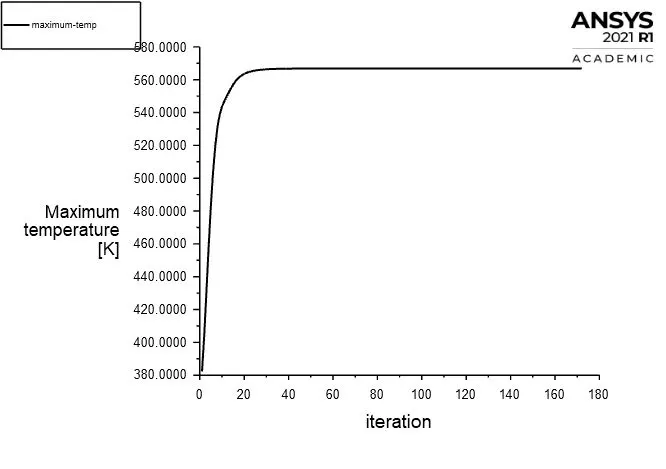
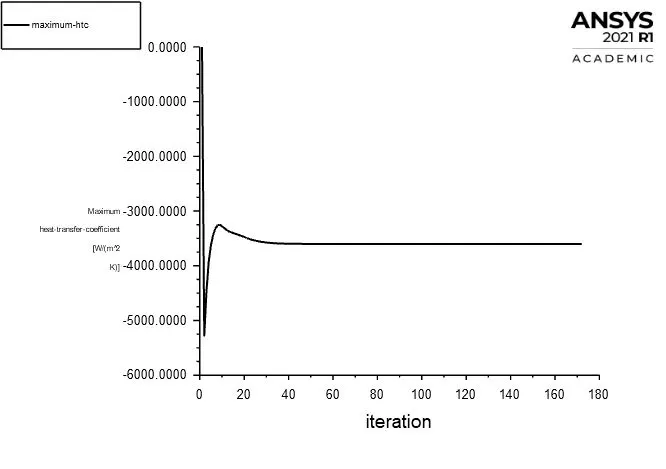
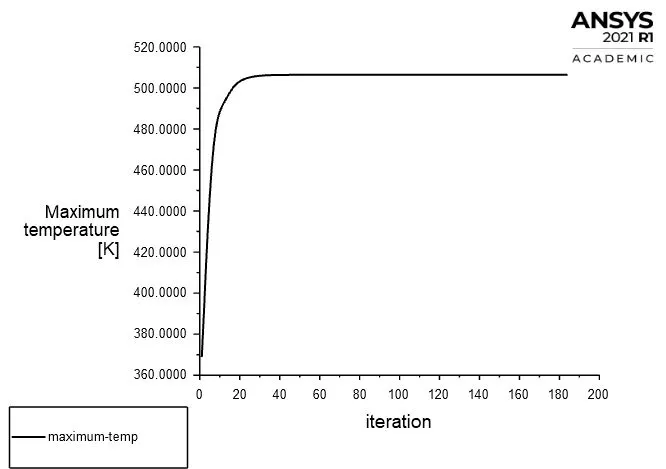
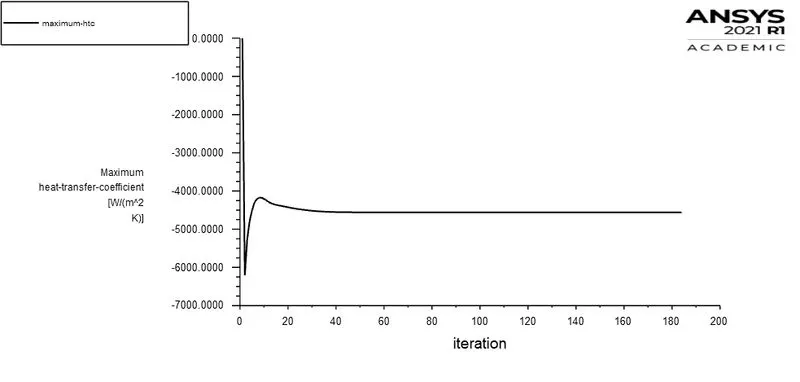
- For the maximum temperature and heat transfer coefficient plots at the processor , solution definition plots has been created using facet maximum and facet minimum respectively.
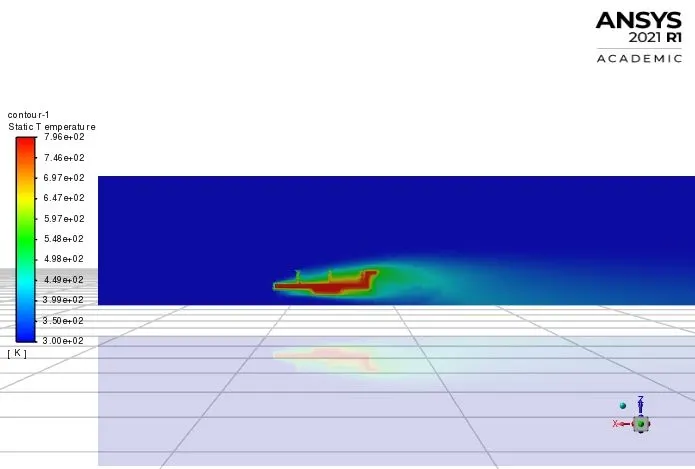
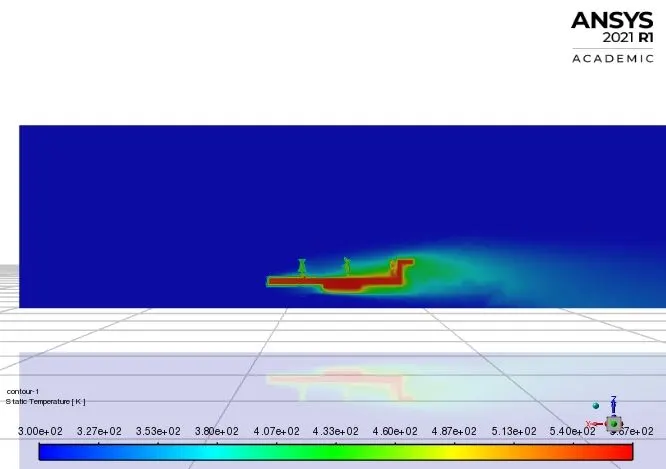
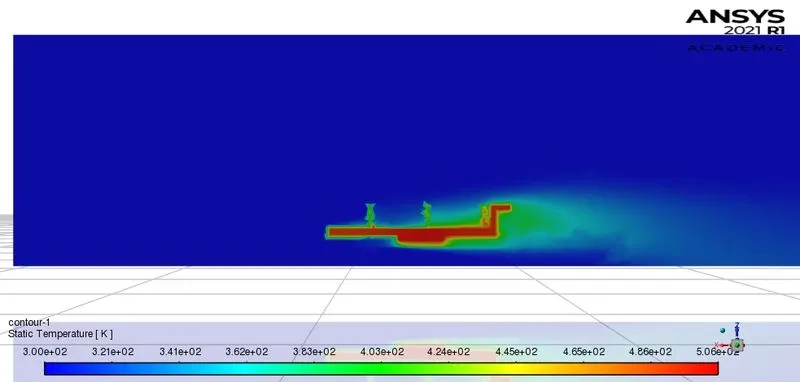
- A plane has been created on the XZ coordinate plane on which the temperature contour will be made.
RESULTS
For inlet Velocity 1m/s,
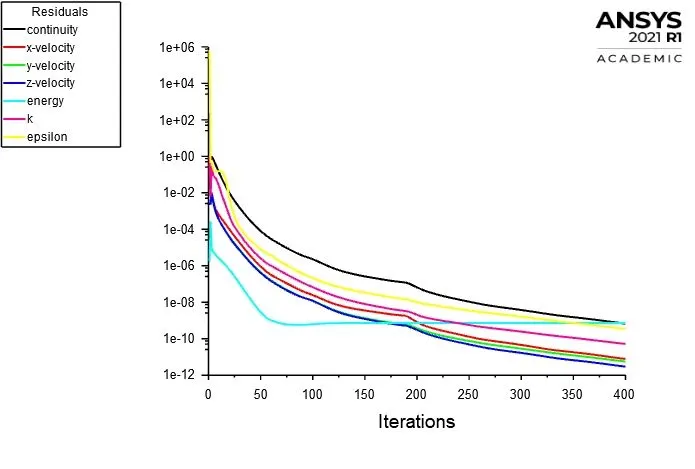
Convergence plot,
Maximum temperature plot,
Maximum Heat Transfer Coefficient plot,
Temperature contour,
For inlet velocity 3m/s,
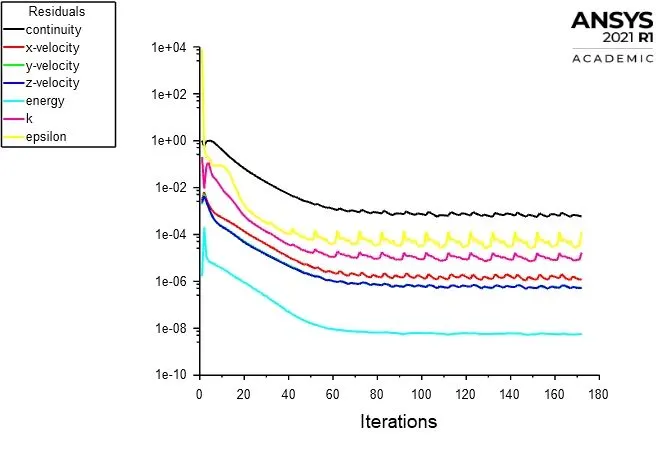
Convergence plot,
Maximum temperature plot,
Maximum Heat Transfer Coefficient plot,
Temperature contour,
For inlet velocity 5m/s,
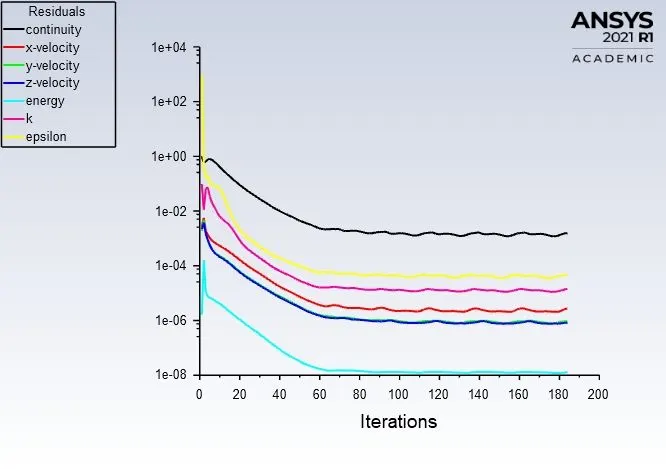
Convergence plot,
Maximum temperature plot,
Maximum Heat Transfer Coefficient plot,
Temperature contour,
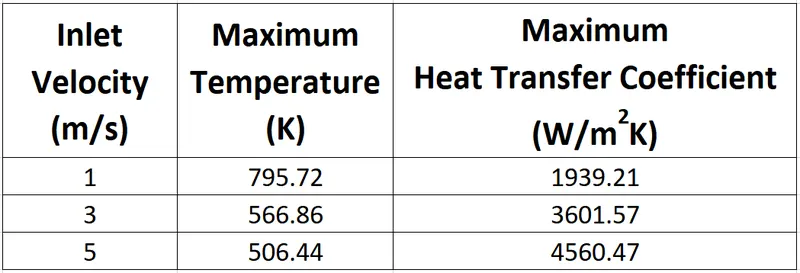
Comparing the results for three different inlet velocities,
CONCLUSION
The steady state Conjugate Heat Transfer analysis on a model of a graphics card using ANSYS software has been done successfully. Also the maximum temperature and Heat Transfer Coefficient attained by the processor has been found out.
The mesh was refined for the fluid enclosure , heat sink and the processor geometries as these are the parts on which the analysis is done. The element size was chosen such that maximum refinement is attained at each of the earlier mentioned parts without exceeding the total number of cells allowed by the software.
All three of the simulations have achieved convergence and this has been verified by the residuals graph.
From the temperature contour plot it could be seen that the maximum heat is at the heat sink and processor interface.
On increasing the inlet velocity of the fluid the maximum temperature attained by the processor of the graphics card has decreased drastically. Almost 40% reduction in temperature was achieved on increasing the velocity from 1m/s to 5m/s.
The Heat Transfer Coefficient of the processor increased as the velocity was increased , which caused the temperature to decrease.
Hence it could be concluded that as the cold fluid velocity flowing around the heat source is increased , the heat removal takes place much faster and a optimum temperature can be maintained. So the graphics card can be kept at a lower temperature by increasing the fluid velocity.