Week -2
DOOR BELL USING SOLENOID
AIM
To make a simulink model of doorbell using solenoid block.
BLOCK DIAGRAM
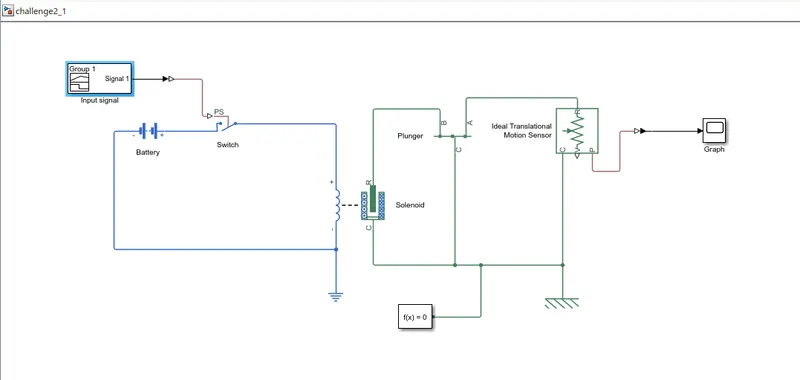
The simulink blocks used here are as follows ,
Signal builder
Simulink to PS converter
Switch
Battery
Solenoid
Electrical reference
Lever
Ideal translational motion sensor
PS to simulink converter
Mechanical translational reference
Solver configuration
Scope
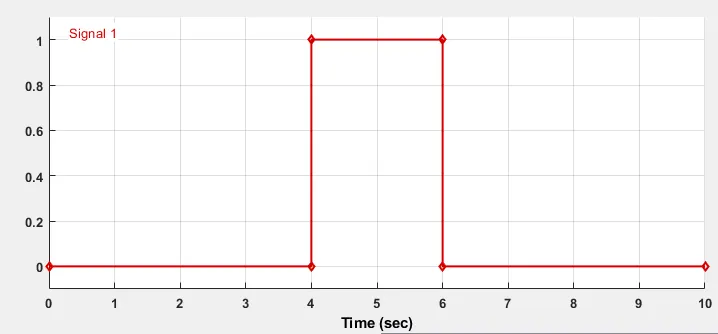
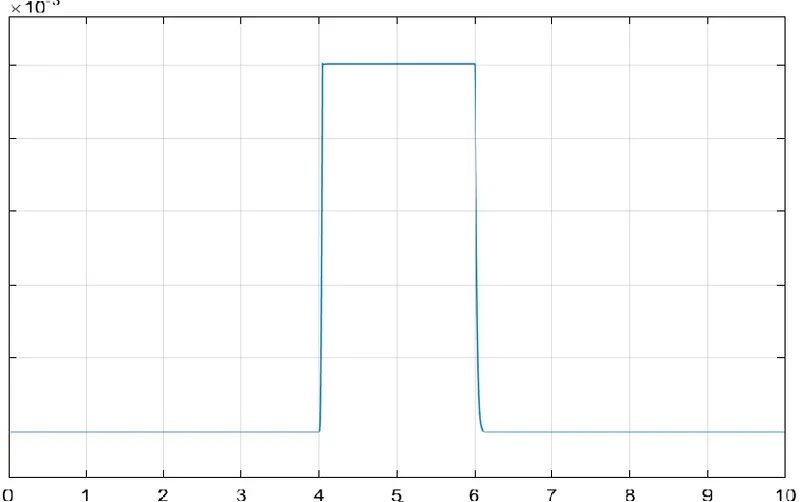
Here we have used the ‘signal builder’ block to create the input signals. This signal is connected to a switch using the ‘simulink to PS converter’ block. Here the switch will be closed for 2 seconds. This switch is connected to a battery and solenoid. Here the solenoid acts as the source of motion. This solenoid is connected to the lever which acts as a hammer which strikes the gong of the bell. To get the position of hammer with respect to time we have used a translational motion sensor. This is connected to the scope block to get the position vs time graph.
GRAPH
Input graph
Hammer position graph
CONCLUSION
Simulink model of a door bell which stays closed for 2 seconds has been created using simulink blocks successfully.
TEMPERATURE CONTROLLED FAN USING A THERMISTOR
AIM
To create a simulink model to operate a fan that is controlled by the temperature readings using a thermistor.
BLOCK DIAGRAM
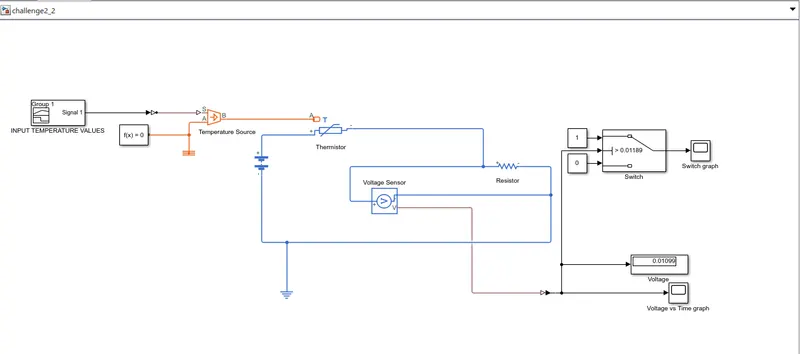
The simulink blocks used here are as follows ,
Signal builder
Simulink to PS converter
Controlled temperature source
Thermistor
Battery
Voltage sensor
Electrical reference
Resistor
Thermal reference
Constant
Switch
Display
Scope
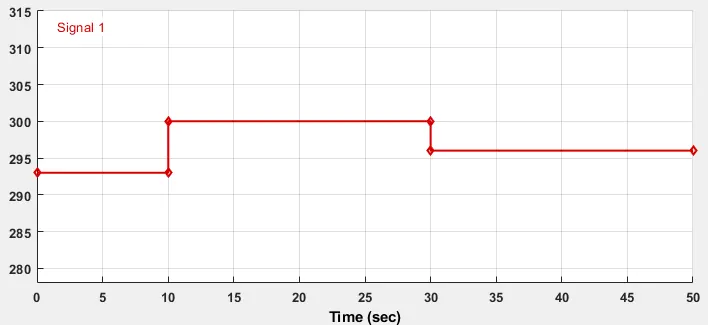
Conditions given is that temperature value from 0 to 10 seconds should be 293K, 10 to 30 seconds it should be 300K and 30 to 50 seconds it should be 296K.
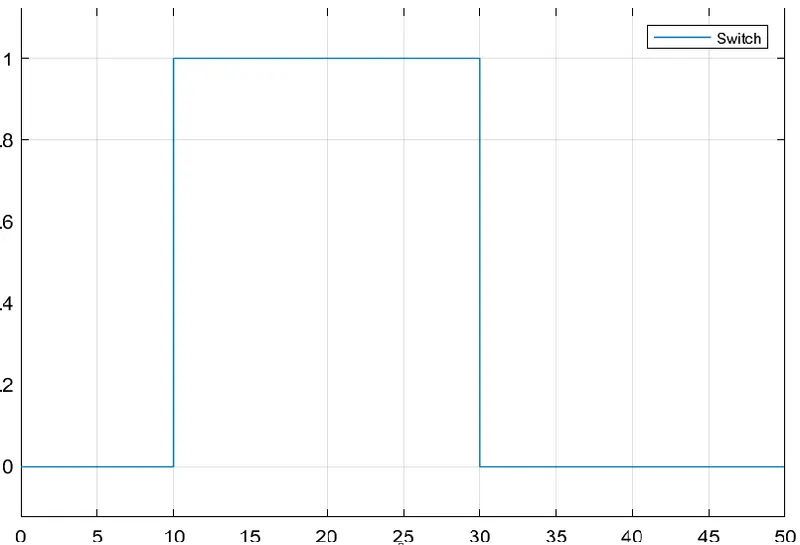
Condition for fan to work is that it should be turned ON at temperatures above 298K otherwise it should be in OFF state.
Here the input temperature values are given using signal builder block to the controlled temperature sensor which will act as the source of heat for the thermistor. Thermistor is then connected to a resistor and voltage sensor. This voltage sensor will output the corresponding voltage value at each temperature value. The voltage sensor is also connected to the switch which controls controls the fan depending on the temperature. The threshold of the switch is equal to the voltage at which the fan should be turned ON.
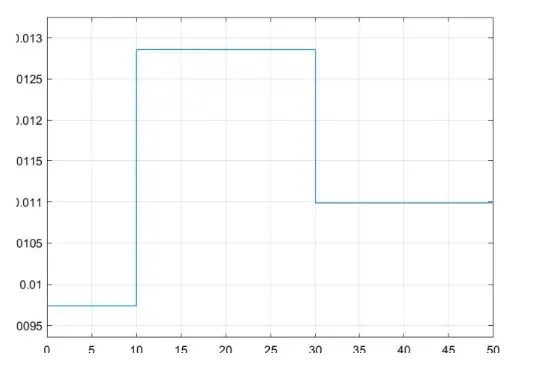
The voltage sensor is connected to the display to monitor the voltage value and also to scope to create graph plotting voltage vs time.
GRAPH
Temperature values input graph
Voltage vs time graph
Switch graph
CONCLUSION
Simulink model of a fan which turns ON when the temperature goes above 298K has been successfully created using the simulink blocks.