Week - 4
1)CONTROL LOGIC OF A WASHING MACHINE
AIM
To implement control logic of a washing machine using stateflow as per the following sequence,
If the power supply is available, the system gets activated
If the Water supply is not available, stop the process & indicate through LED
Soaking time should be 200s followed by Washing time of 100s.
Then rinsing happens for next 20s & dryer runs for 50s
After all the processes have completed turn on the finished LED
BLOCK DIAGRAM
The simulink blocks used here are as follows ,
Constant
Lamp
Chart
Display
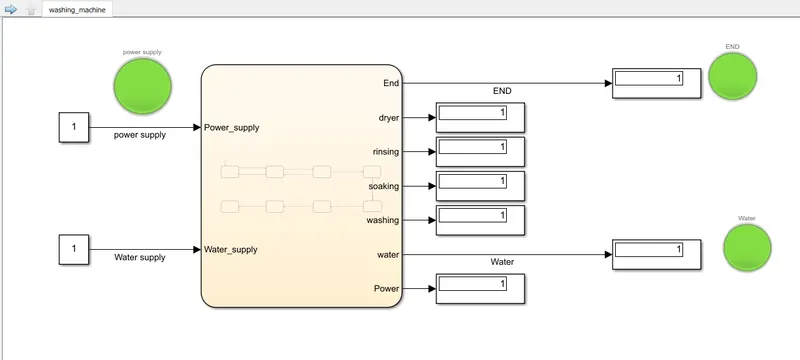
Here the chart block inside the stateflow library is used to present the logic underlying the functioning of a washing machine. A chart block implements control logic with finite state machine.
The input to the chart block is given by constant block and the output is connected to multiple display blocks.
Also lamp blocks are used to display colours indicating the value of the input signal and also the output signal. Input signals indicated using lamp blocks are power supply and water supply and the output signals indicated using lamp block is end of the process.
FLOW CHART
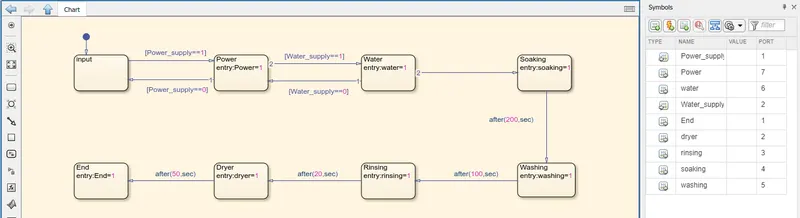
Different scenarios are as follows,
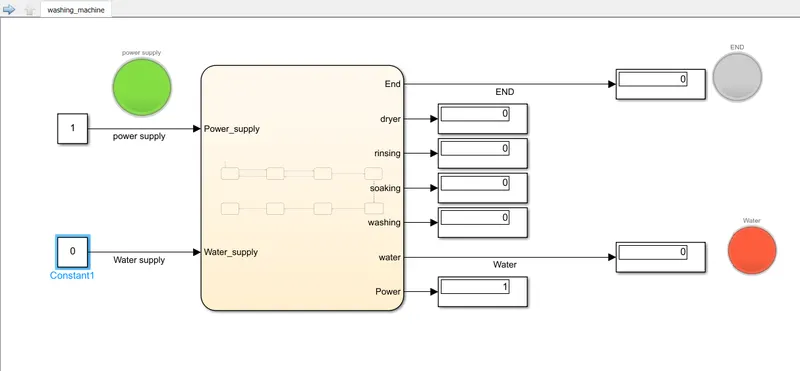
When there is no water supply the lamp corresponding to the water output will turn red in colour as shown below,
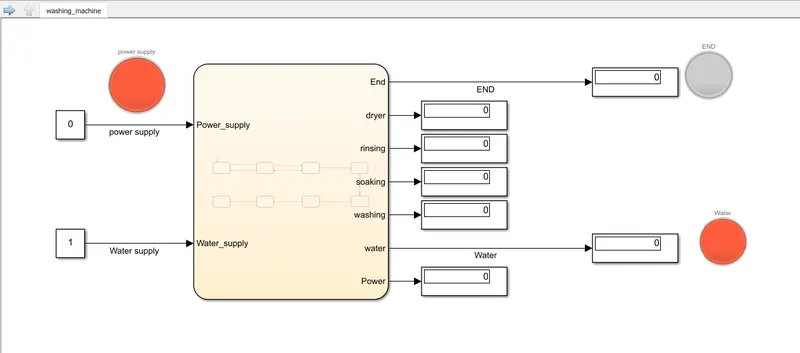
When there is no power supply the lamp corresponding to the power input will turn red in colour as shown below,
CONCLUSION
Control logic of a washing machine has been successfully implemented using the stateflow chart in Simulink.
2)SIMULINK CHART FOR GEAR SHIFT LOGIC
AIM
To implement control logic for gear shift as per the following conditions sing stateflow chart in simulink,
Speed Range(kmph) Gear
0 to 15 1
16 to 25 2
26 to 40 3
41 to 60 4
Above 61 5
BLOCK DIAGRAM
The simulink blocks used here are as follows ,
Constant
Slider gain
Chart
Display
Scope
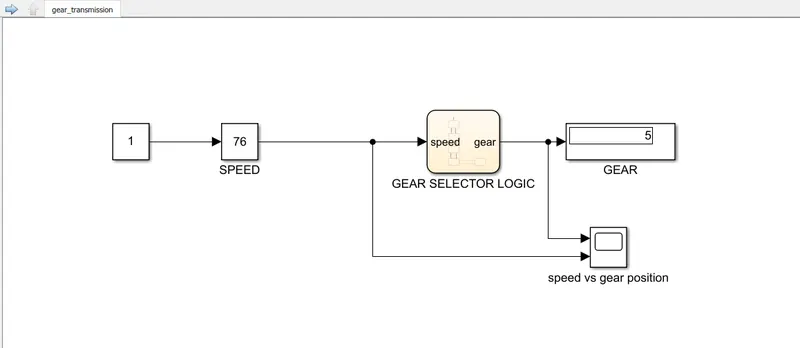
Here the chart block inside the stateflow library is used to present the logic underlying the functioning of a washing machine. A chart block implements control logic with finite state machine.
The input to the stateflow chart is given using slider gain block. Here the slider gain is used to change the input value during the simulation. This will mimic speed variations in an automobile while driving.
The output from the stateflow chart is connected to a display and scope which will display the current gear number and the graph between speed and the gear number respectively.
FLOW CHART
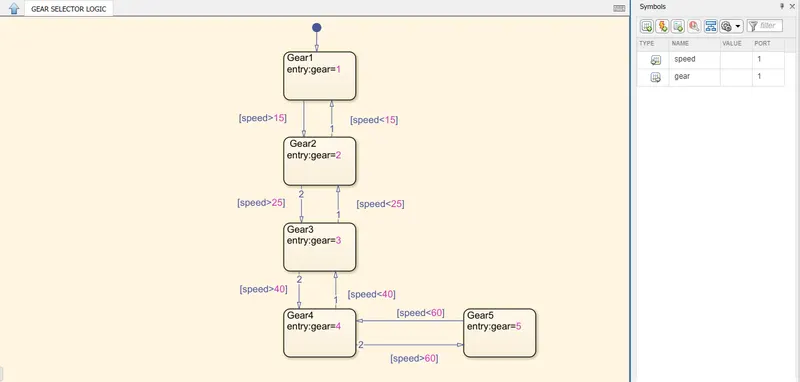
Different scenarios are as follows,
When the speed is below 15,
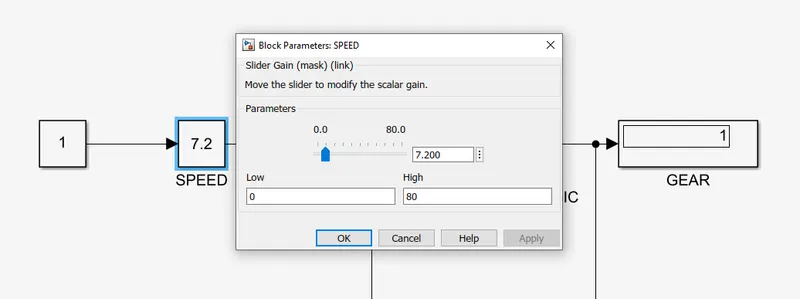
When the speed is below 25,
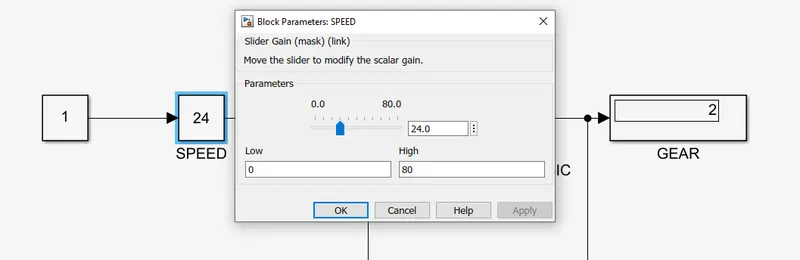
When the speed is below 40,
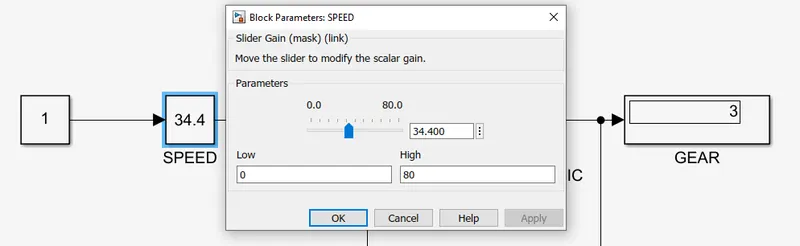
When the speed is below 60,
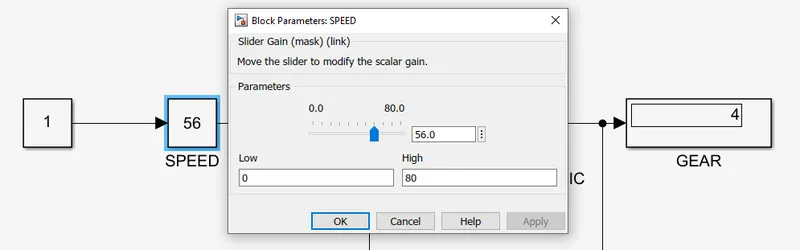
When the speed is above 61,
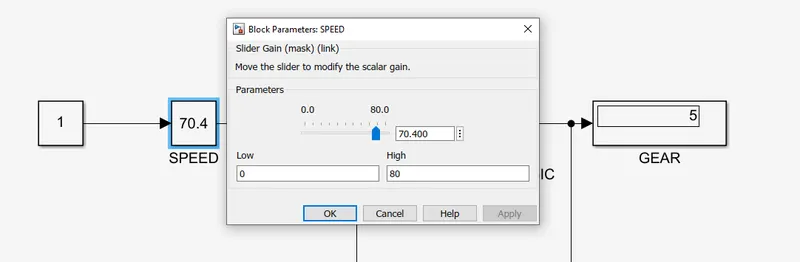
CONCLUSION
Control logic for gear shift has been implemented successfully using stateflow chart in Simulink.