Week 6 - CHT Analysis on a Graphics card
CHT ANALYSIS ON A GRAPHICS CARD
l. OBJECTIVE
- To perform steady-state conjugate heat transfer analysis on Graphics Card.
- To find the effect of different velocities on the temperature.
- Run the simulation by varying the velocity from 1m/sec to 5m/sec for at least 3 velocities and discuss the results.
- Identify potential hotspots on the model.
ll. INTRODUCTION
Conjugate Heat Transfer (CHT)
Conjugate heat transfer is defined as the heat transfer between two domains by exchange of thermal energy. For a system the thermal energy available is defined by its temperature and the movement of thermal energy is defined by its heat flux through the outer walls. Heat transfer in solid happens through conduction and walls by convection and in liquid phase through convection.
CHT provides the temperature prediction and the hotspot regions at the solid-fluid interface and we can also predict the heat transfer accurately for example- Conduction through solids, convection through fluid, and thermal radiation. It also provides the velocity and pressure distribution of fluid moving inside the solid. We can also use CHT in design optimization for improvement for heat transfer and cooling capacity.
Examples:
HVAC, Heat Exchanger, Tank, Internal Combustion Engine, Heat Sink, Boiler, Reactor, Heat Pipe, Turbocharger.
Heat Transfer in a Solid - Conduction: Diffusion of heat due to temperature gradients in solids. A measure of the amount of conduction for a given gradient is heat conductivity. Conduction is described by Fourier’s law defining the conductive heat flux, q, proportional to the temperature gradient.
Heat Transfer in a Fluid - Convection: When heat is carried away by moving fluid. The flow can either be caused by external influences, forced convection or by buoyancy forces, natural convection.
Due to the fluid motion, there are three contributions to the heat transfer:-
1. Convective contribution: -Depending on the properties of the fluid and its region of flow, the domination of conduction and convection varies.
2. Viscous effects: -Due to the fluid flow, the viscosity creates heat. This effect is often neglected due to its negligible value but should be taken into account for high-velocity cases.
3. Density effects: -When the density becomes related to the temperature, the domain will have different densities at different locations based on the temperature distribution. This variation in density can cause the compression which in-turn generates the heat.
A video card (also called a graphics card, display card, graphics adapter, or display adapter) is an expansion card that generates a feed of output images to a display device (such as a computer monitor). Most video cards are not limited to a 6-inch simple output. Their integrated graphics processor can perform additional processing, removing this task from the central processor of the computer.
PROBLEM STATEMENT:-
- Simulate CHT analysis on a model of a graphics card and use appropriate materials of your choice for the simulation.
- Simulate by varying the velocity from 1m/sec to 5m/sec for at least 3 velocities.
- Find out the max temperature and heat transfer coefficient attained by the processor.
Geometry setup:-
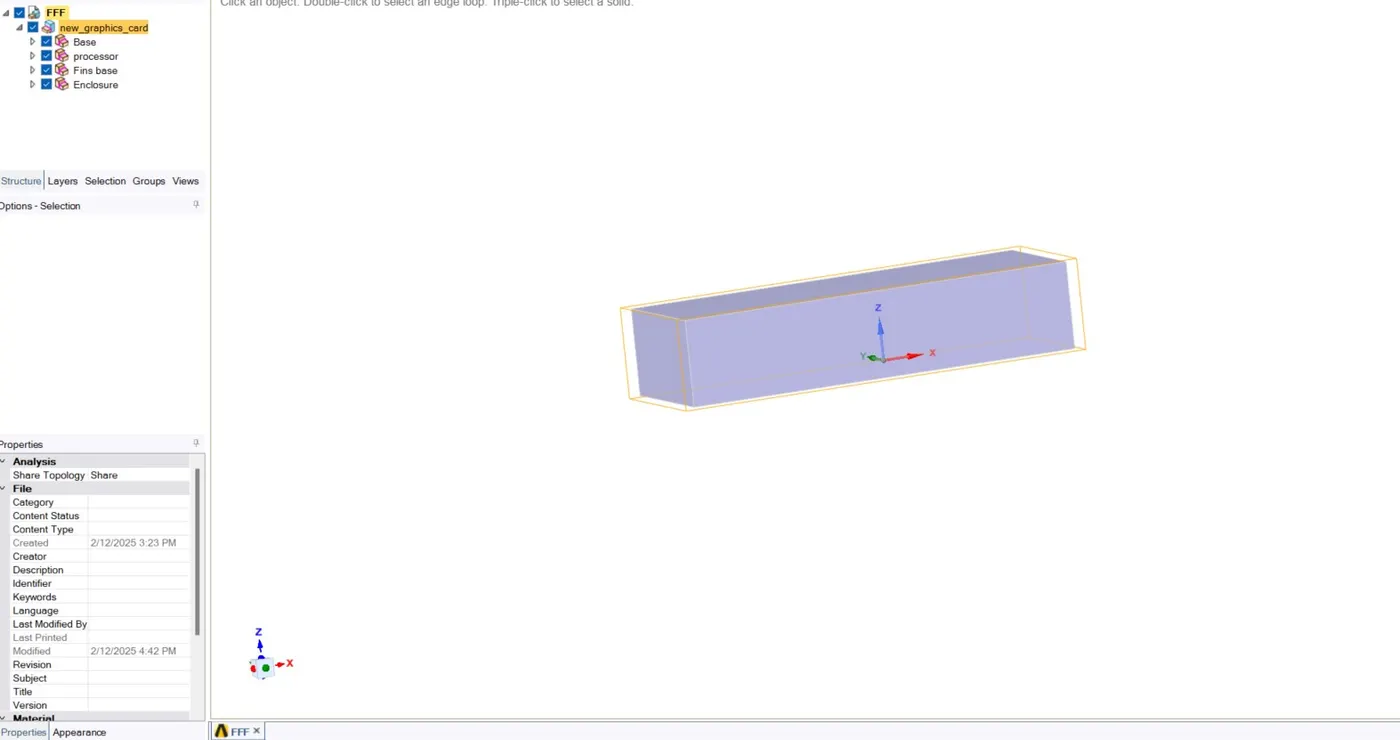
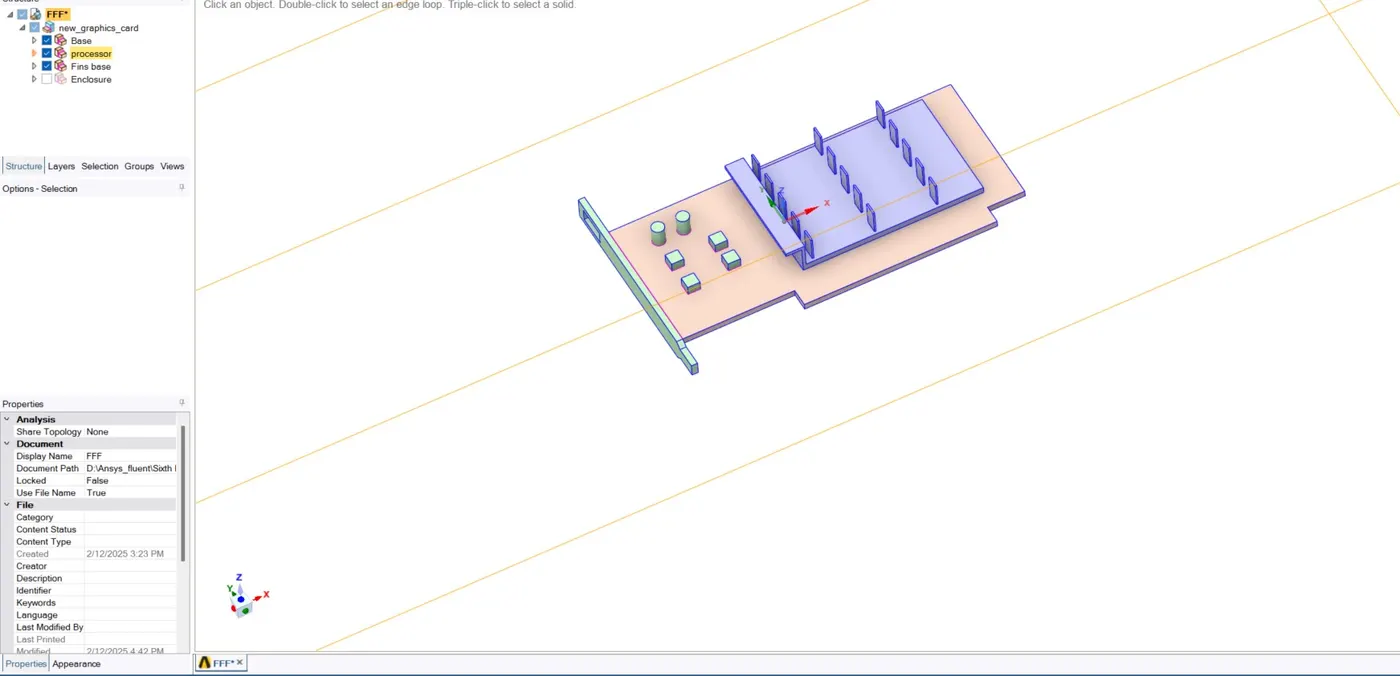
1. Use Spaceclaim to edit the geometry of the downloaded model of the graphics card which is in the enclosure.
2. Click on share prep to view any edges in interference so that conformal mesh can be achieved between different components.
3. Share topology has to be enabled between the different components so that necessary information can be shared between different zones of the mesh.
Mesh setup:
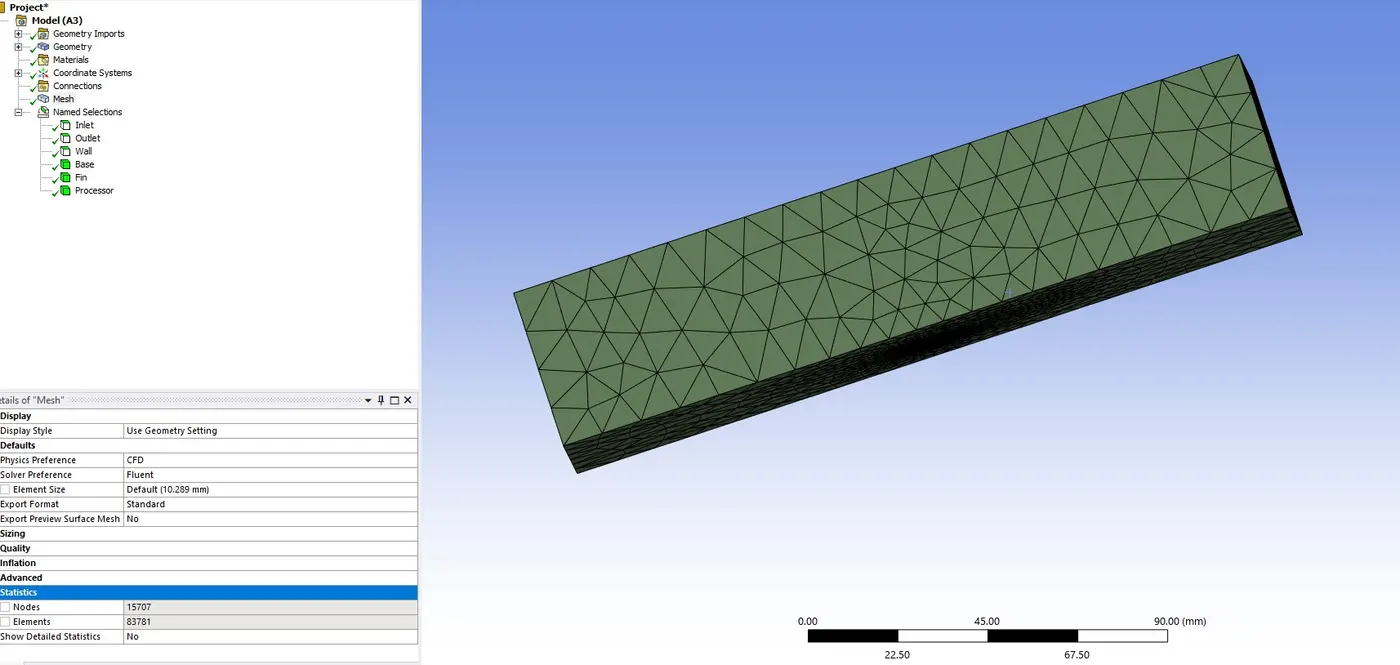
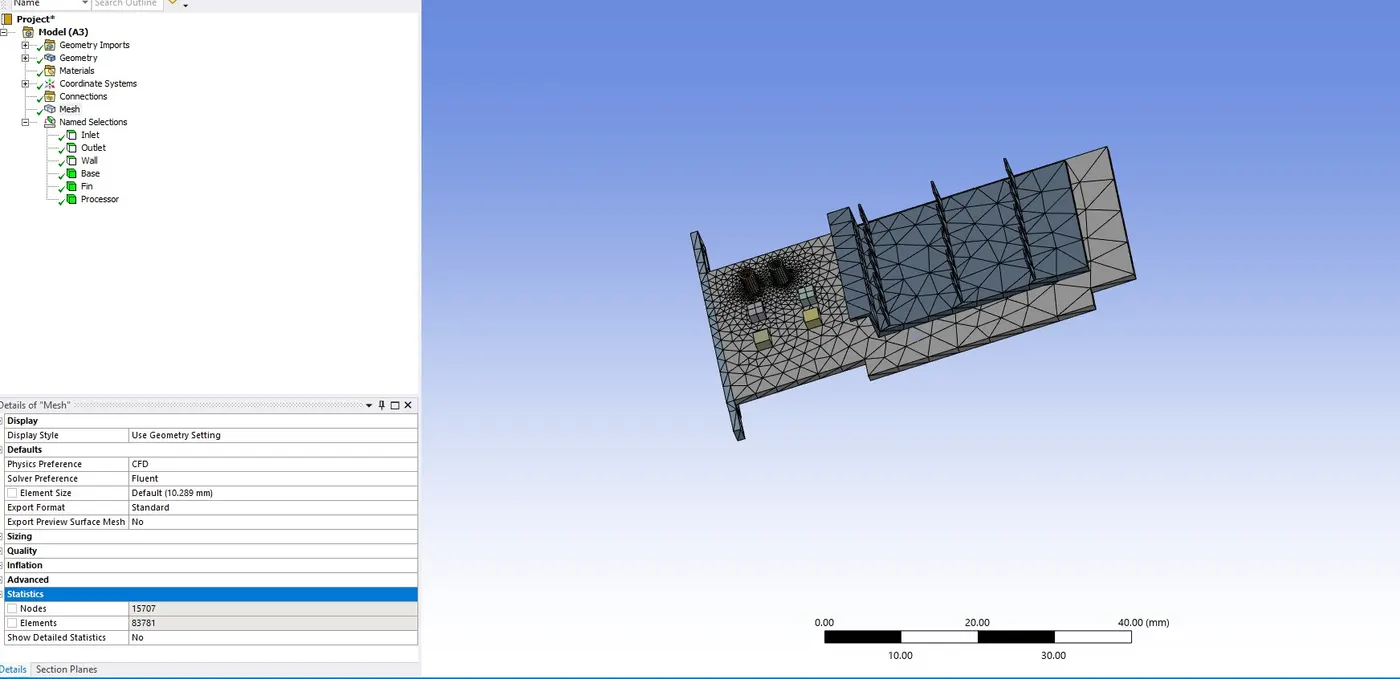
1. Before generating a base mesh, let's name the different components of the graphic card so it is easier to find them while setting up fluent.
2. Base, processor and fins are basic name selections which will help us in the simulation.
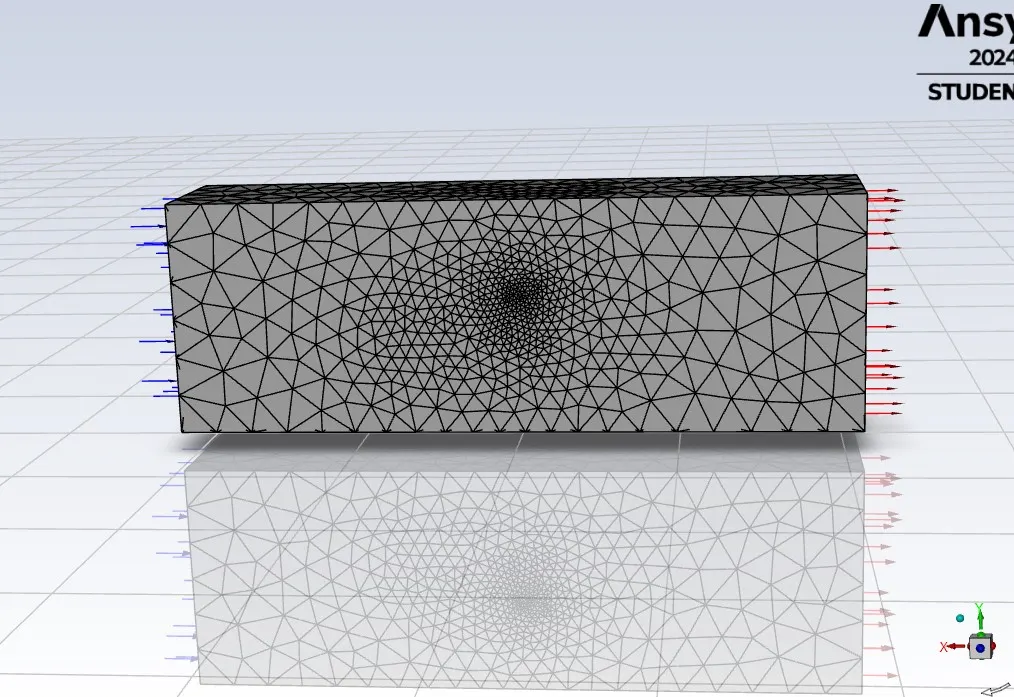
3. Click generate mesh to create a base mesh, After creating the mesh, exit Mesh setup to simulate in fluent.
Element order-Linear
Element size -Default
Number of Nodes-15707
Number of elements-83781
Fluent setup:
Setting up the physics for CHT analysis on a graphics card in ANSYS fluent.
For this case we are using pressure-based steady state solver
Velocity formulation - Absolute
Model setup
Energy
Viscous - k-epsilon
Solver-Steady
Type- Pressure Based
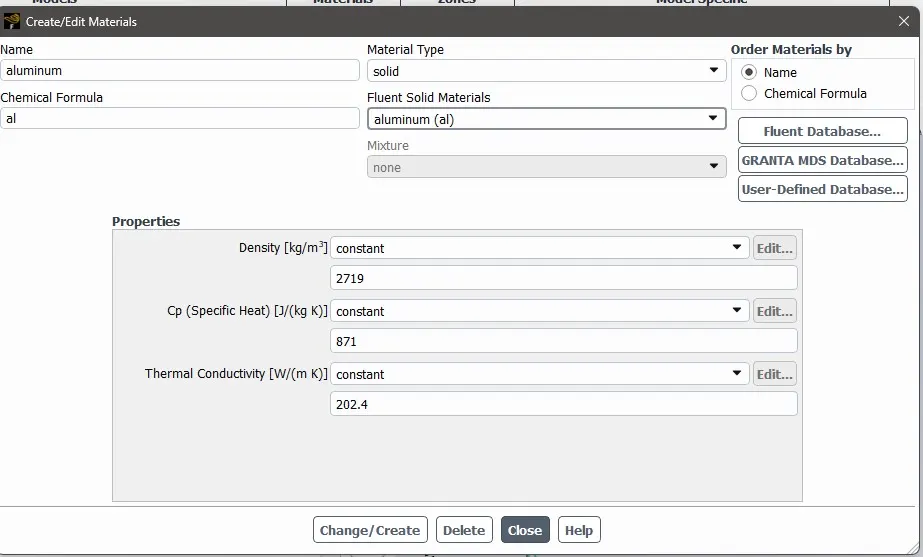
Materials-Different materials are used for each part, some of which are custom created.
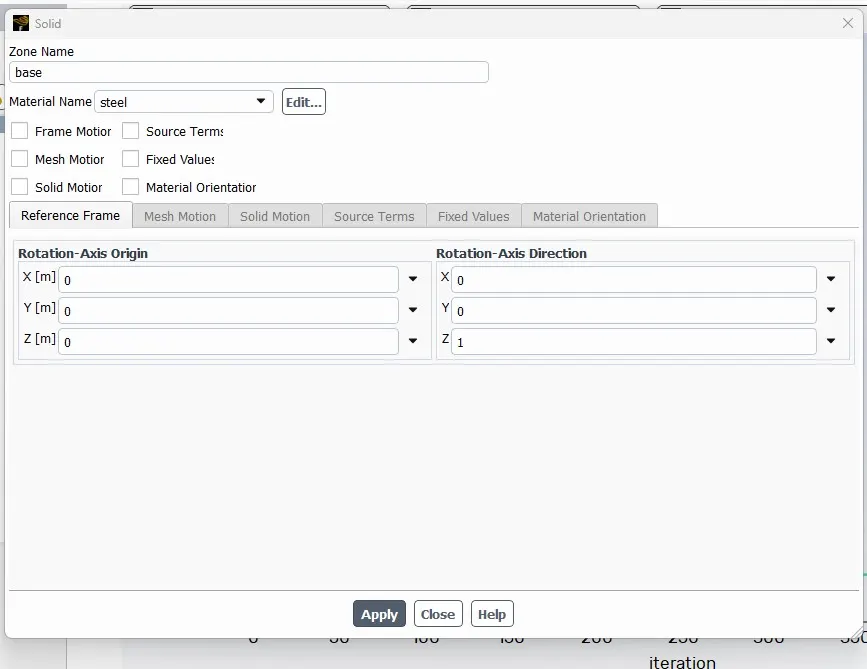
Parts Materials
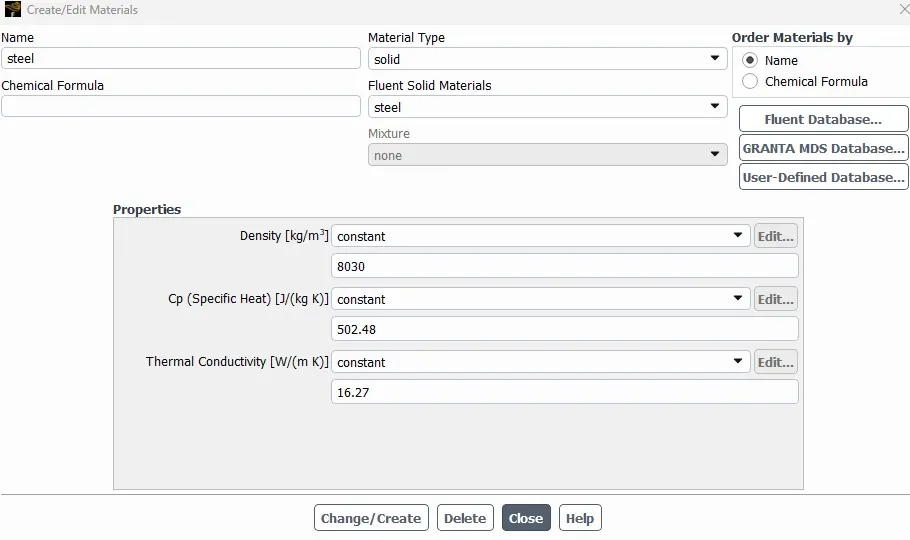
1. Base Steel
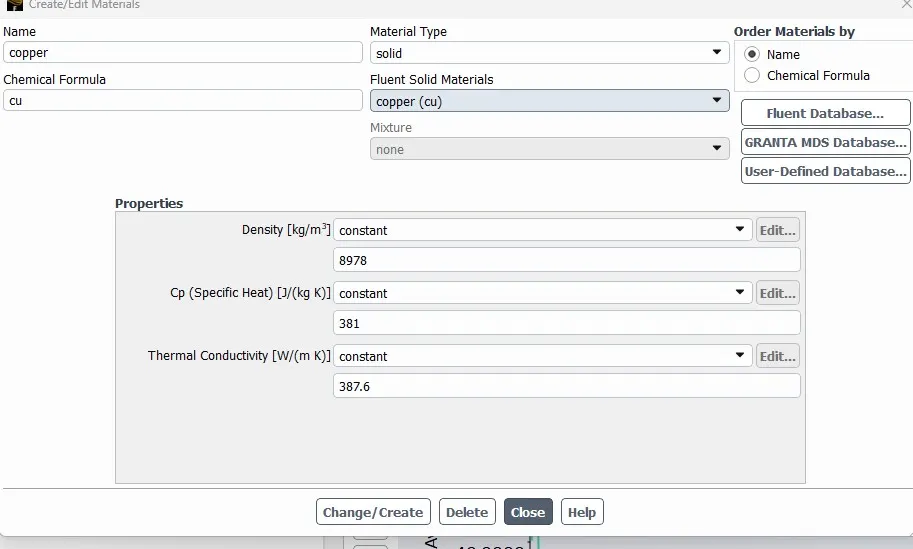
2. Fin Copper
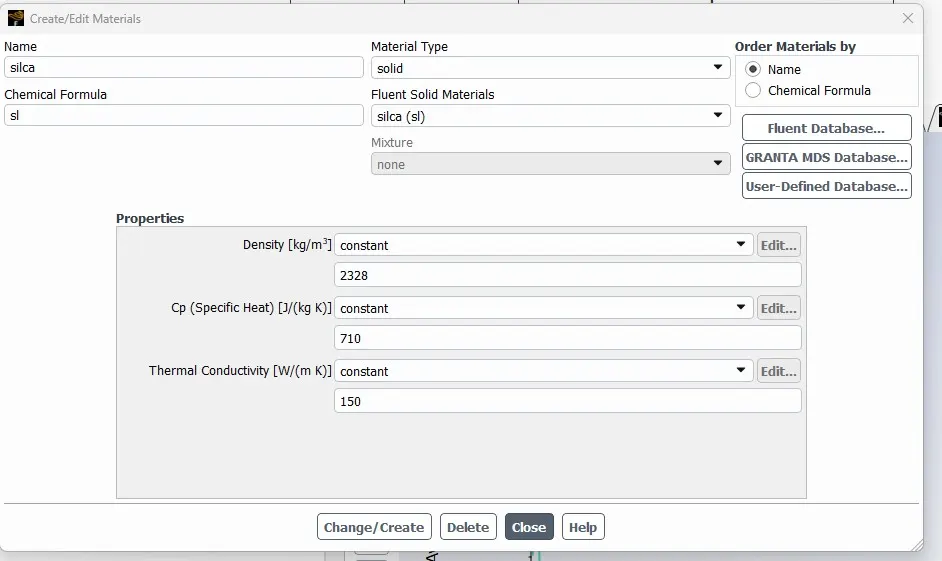
3.Processor Silica
4.Encloser Air
Steel-
Copper-
Silica-
Aluminum-
Cell Zone Conditions-
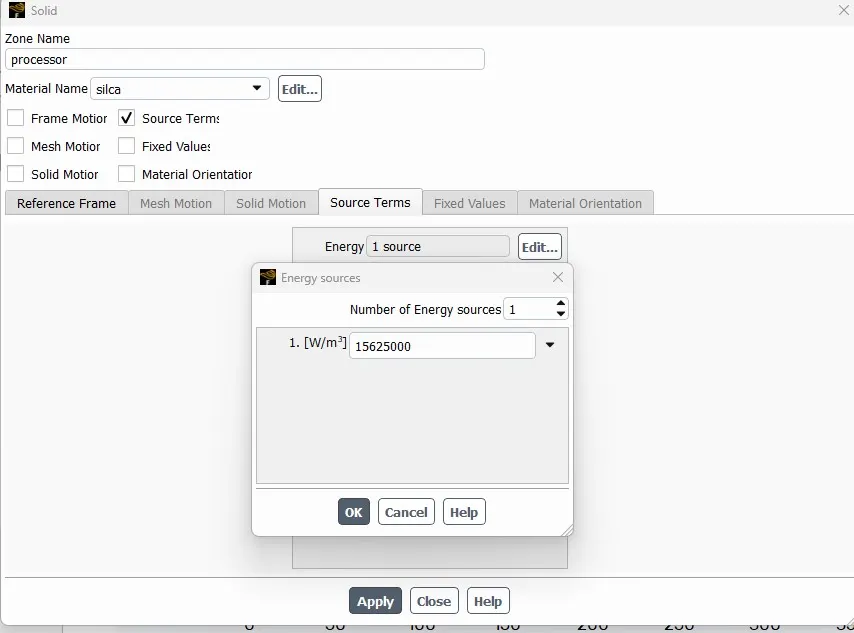
For this case we consider that, our processor is a source terms and it generating heat.
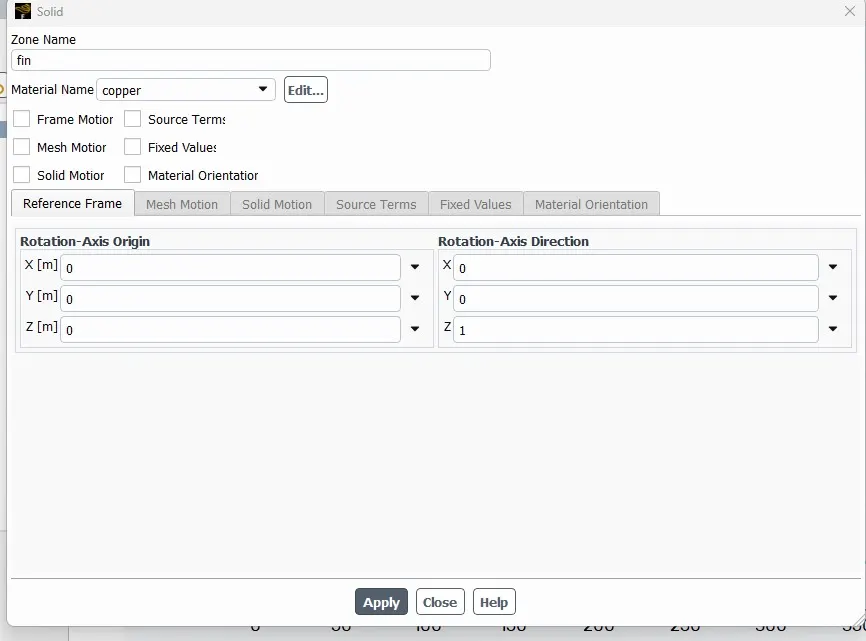
So, for setting up the source term go to Zones - Cell zones - and click on the processor for editing which is in the Solid.
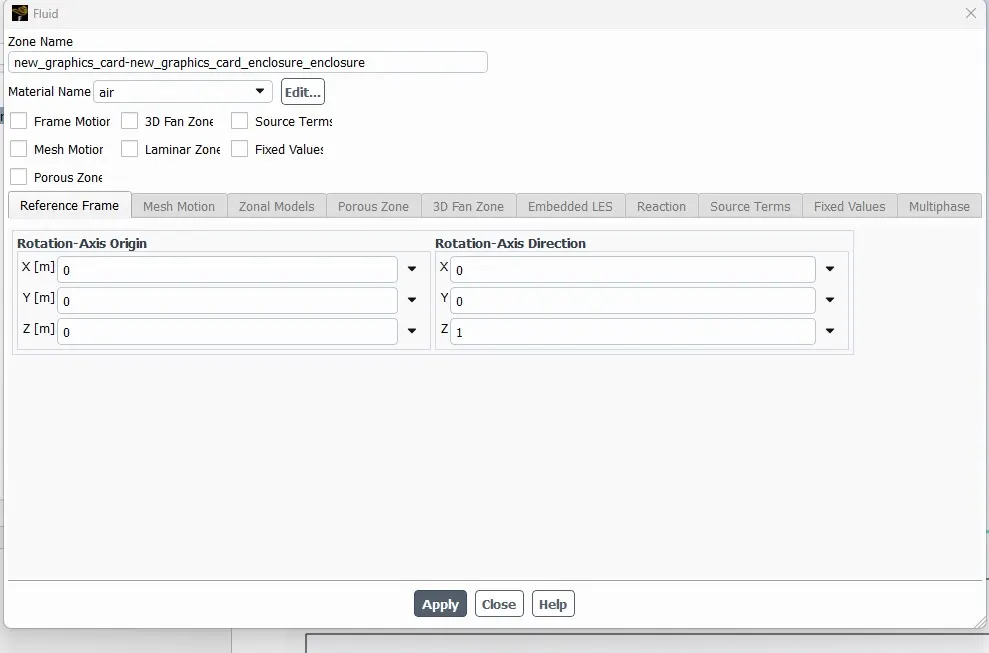
After that select the material to Silica and click on the source terms to enabled it and set the energy source to 1.
Calculation for the Energy source
Graphics Card Power = 10W
Volume of the card = 8 x 8 x 1
= 64mm3=64e−9m3
Heat Generated = PV=1064e−9
= 1.5625e8Wm3
Inlet
Air is used as a fluid
Velocity = 1 m/s
Temperature = 300 K
Outlet
Pressure = Gauge pressure (0 pa)
Solution
Method: Standard
Number of Iterations: 500
Simulation Output:
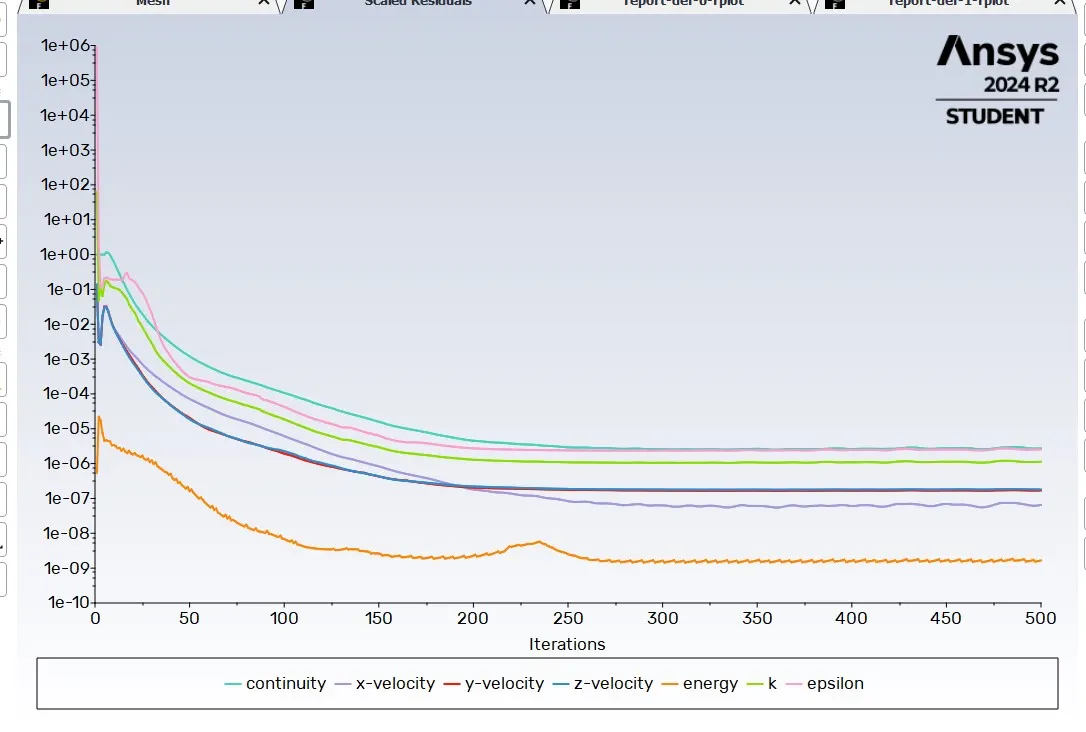
Residual:-
Contour static pressure-
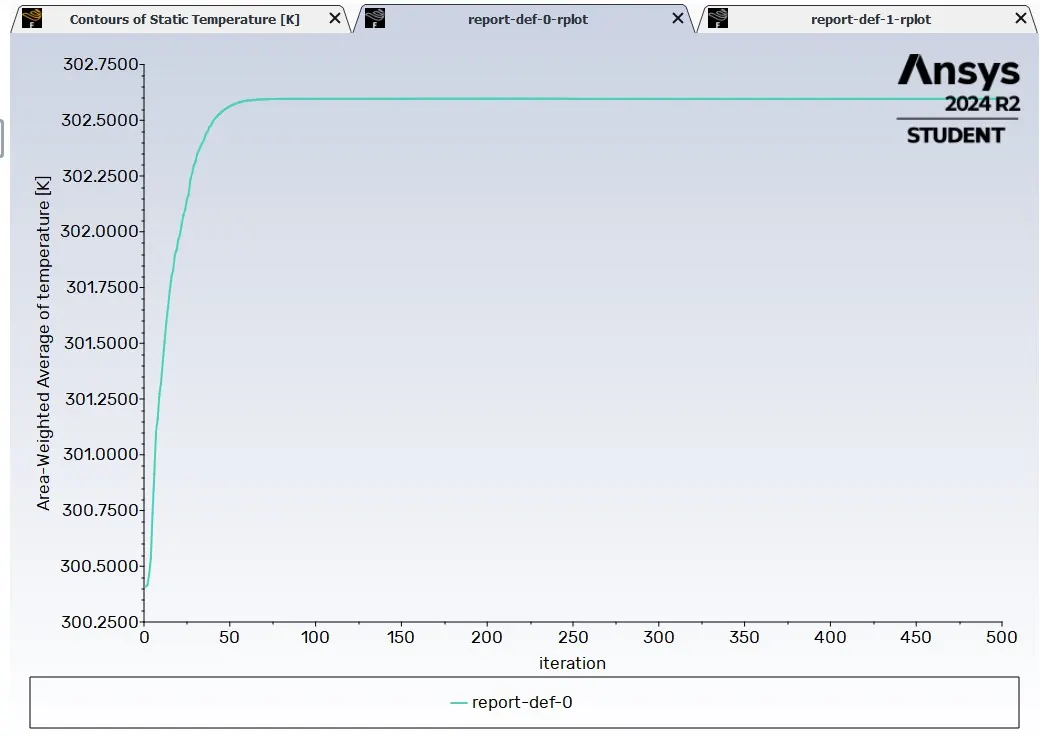
Area weighted average of temperature-
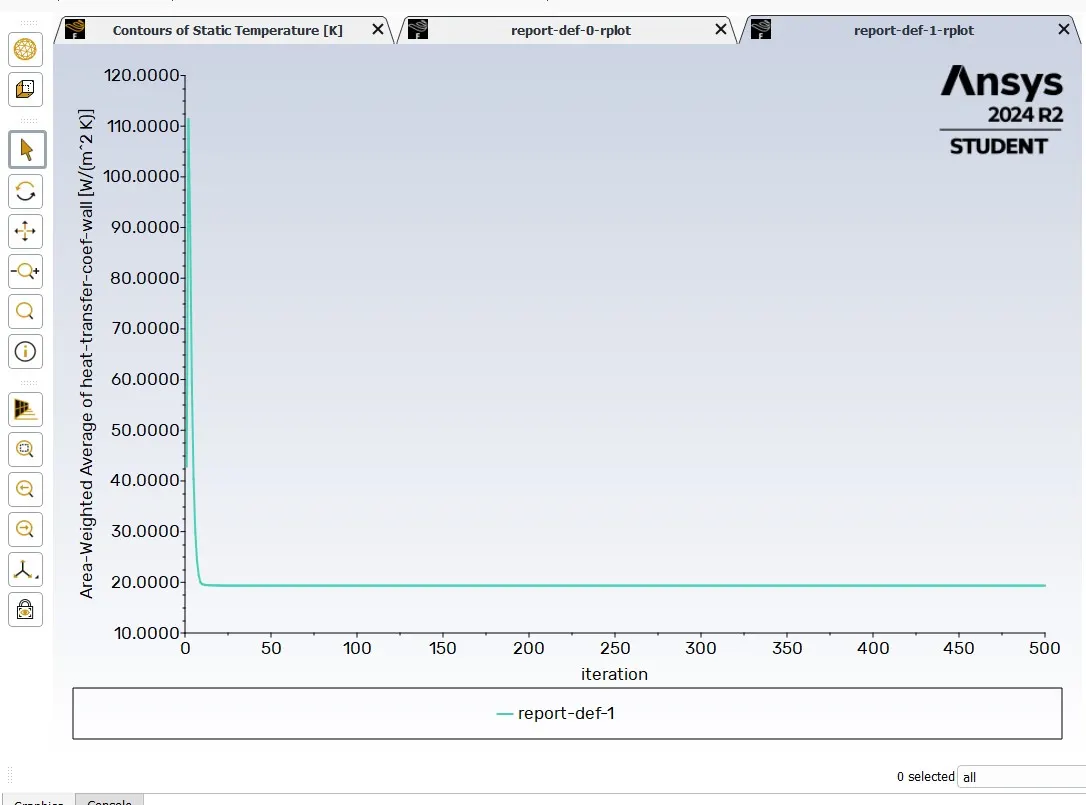
Area weighted average of heat transfer coef-wall-
Post processing:-
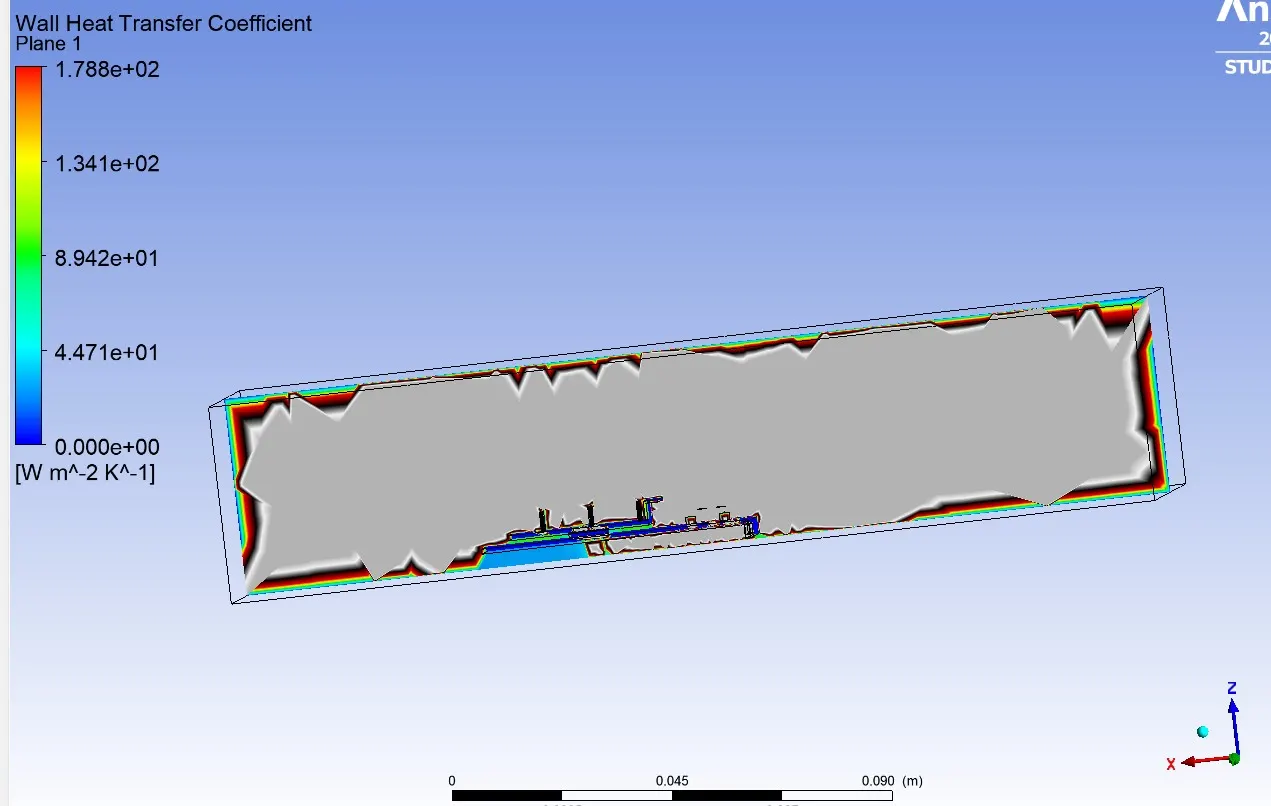
Wall Heat Transfer Coefficient-
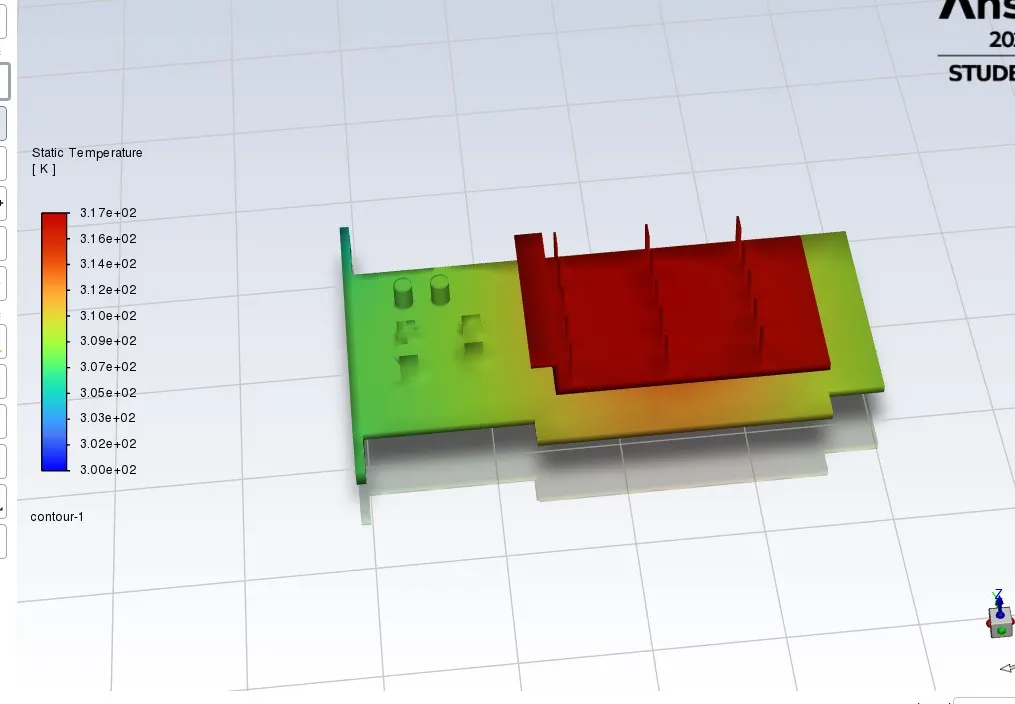
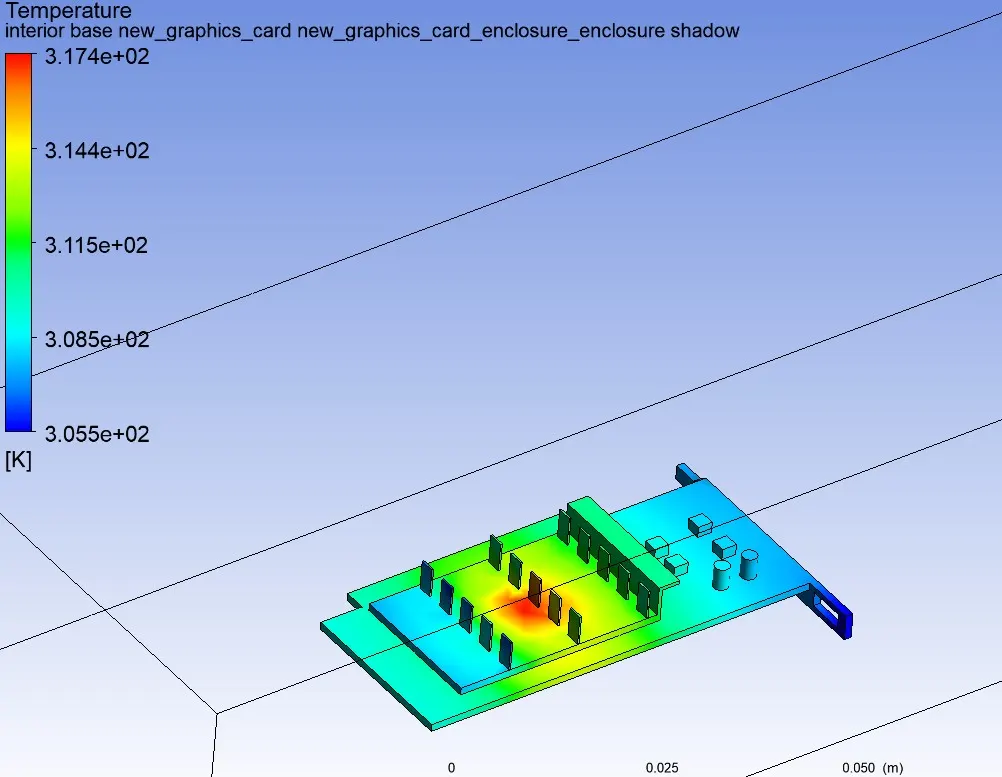
Global Hotspot Region-
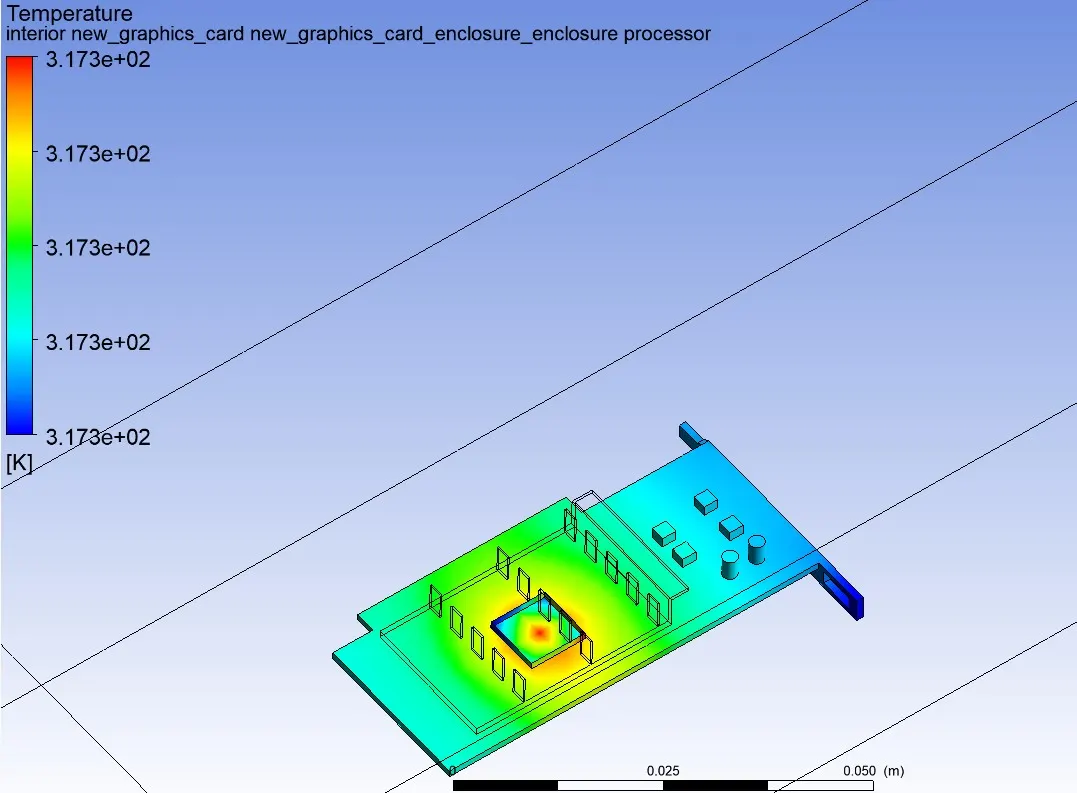
Hotspot region at the processor-
REFINED MESH:-
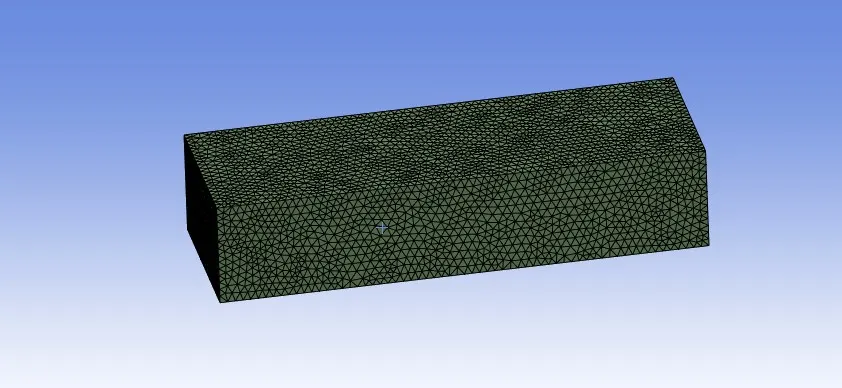
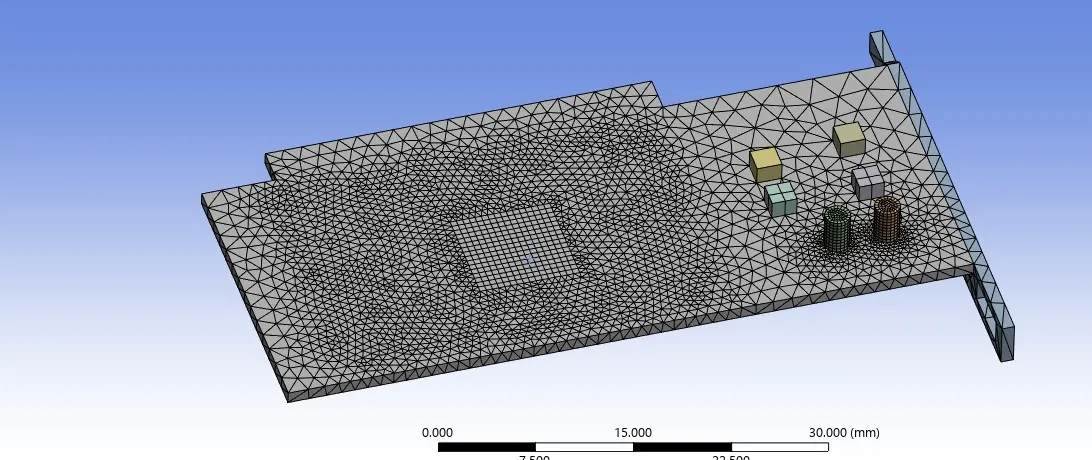
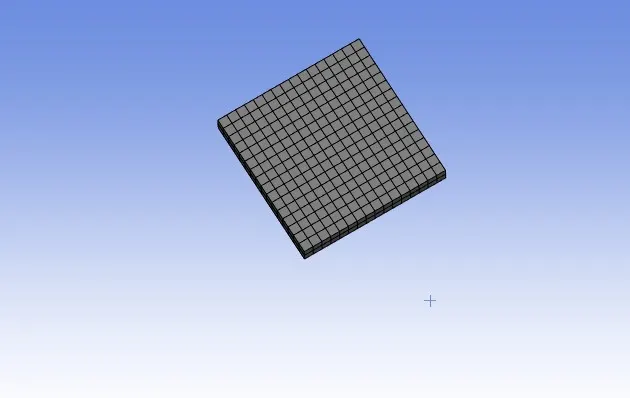
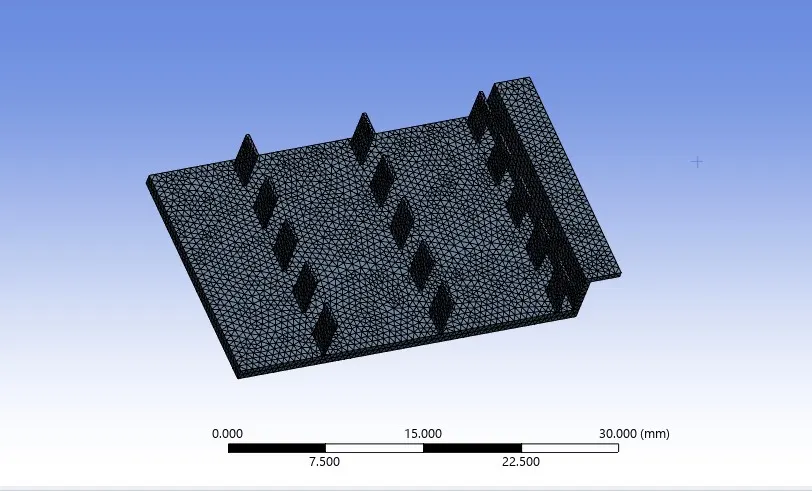
1. Mesh:
Main enclosure: 3mm
Fins size: 0.5mm
Processor: 0.5mm
Base: 3mm
Enclosure:-
Base:-
Processor:-
Fins:-
Mesh quality and graphic card :-
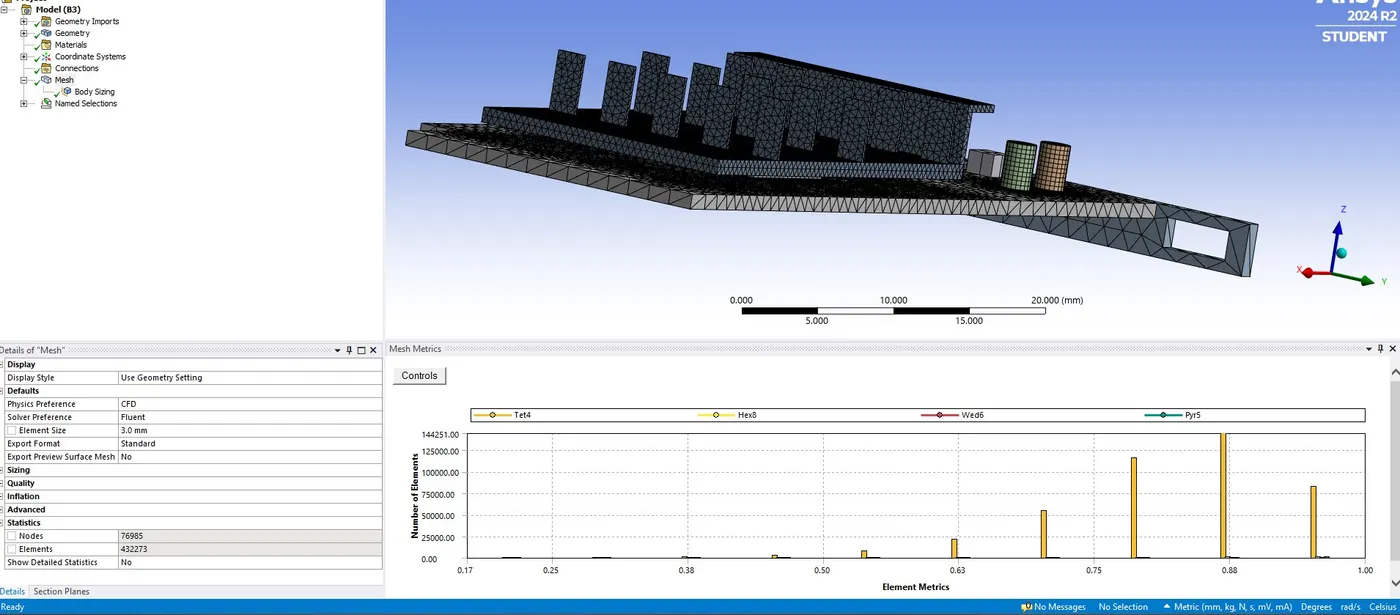
Number of nodes-76985
Number of elements-432273
SIMULATION SETUP-
Inlet velocity=1m/s
The simulation setup is the same as that selected for the initial mesh. Only the output of the simulation will change because of the change in the meshing size .
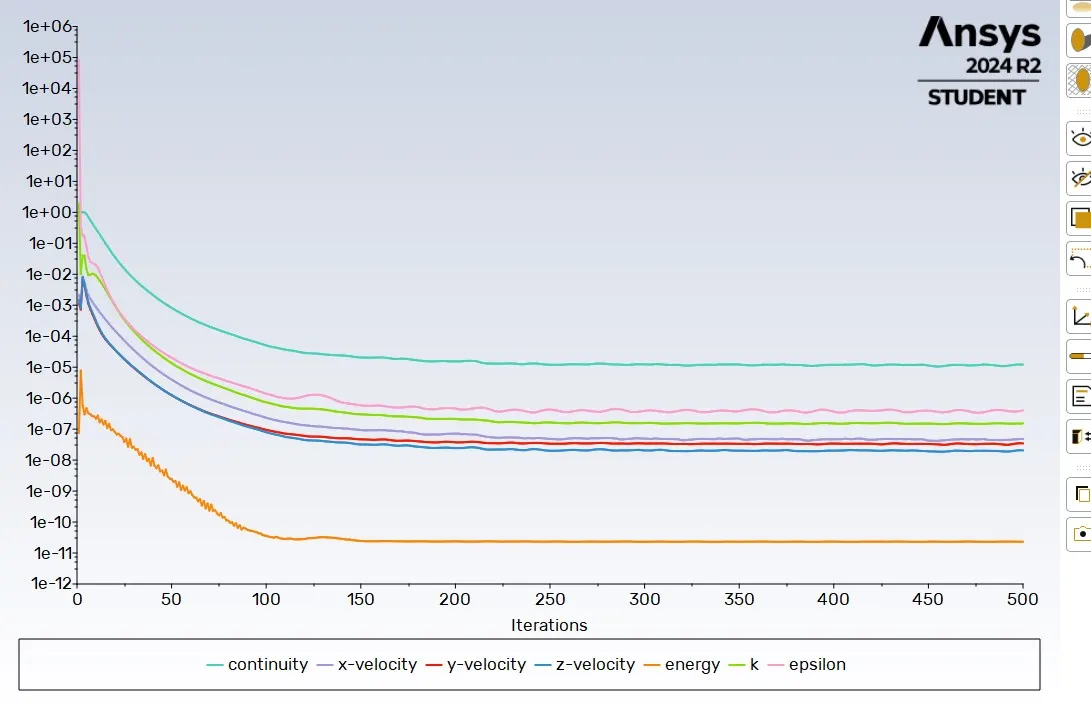
Residual:-
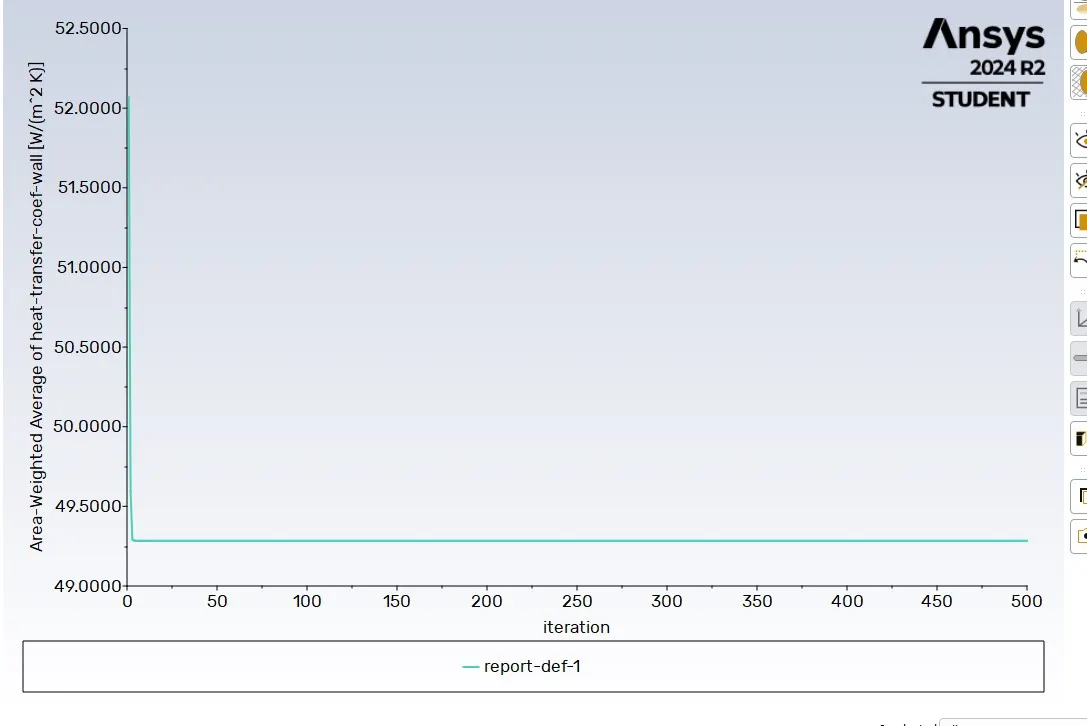
velocity=1m/s.
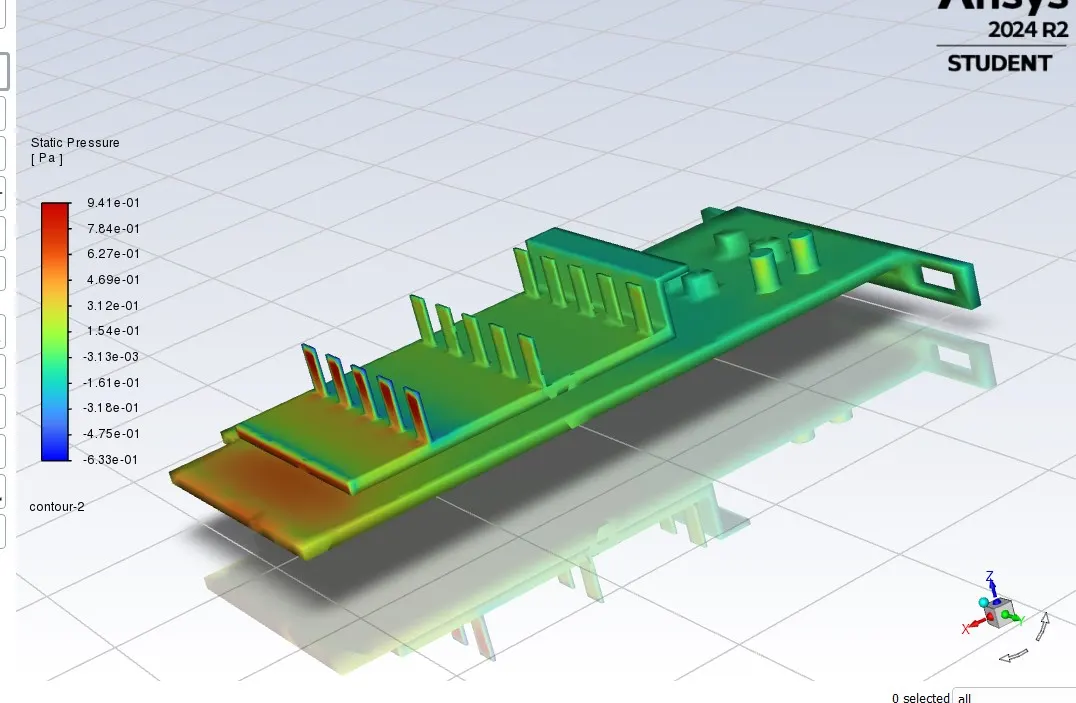
Contour static pressure-
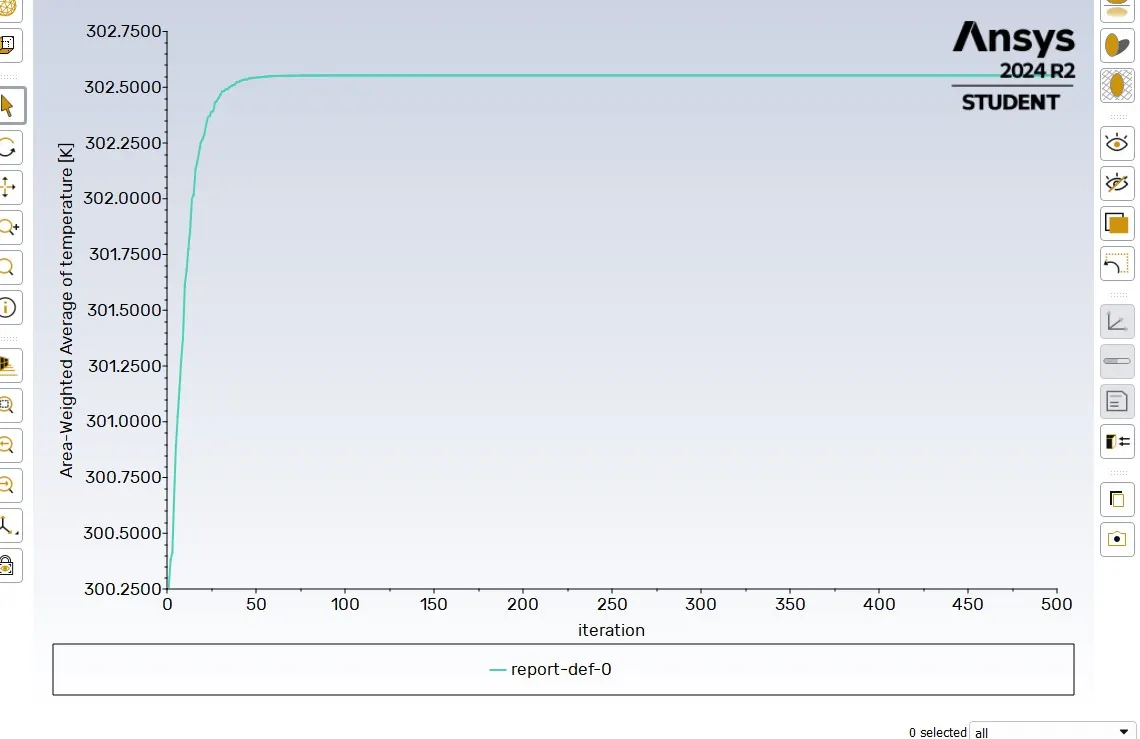
Area weighted average of temperature-
Area weighted average of heat transfer coef-wall-
Post processing:-
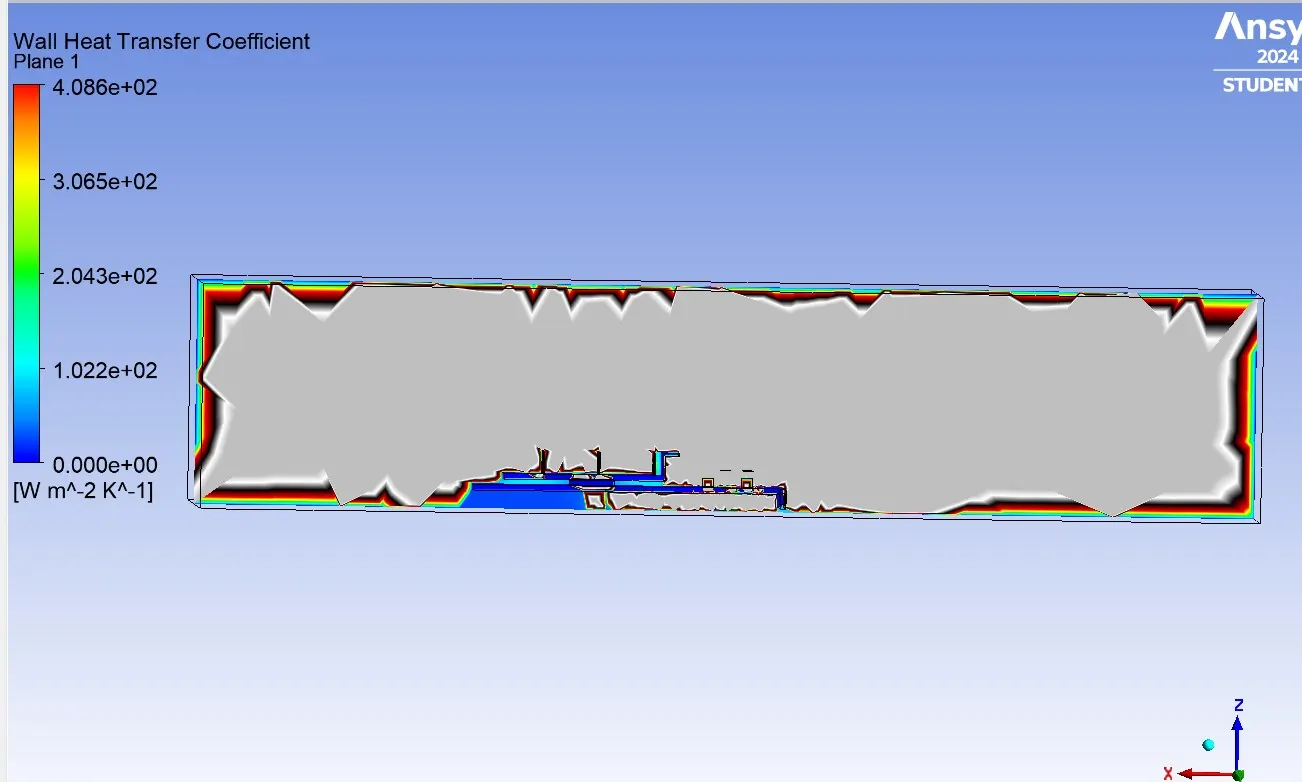
Wall Heat Transfer Coefficient-
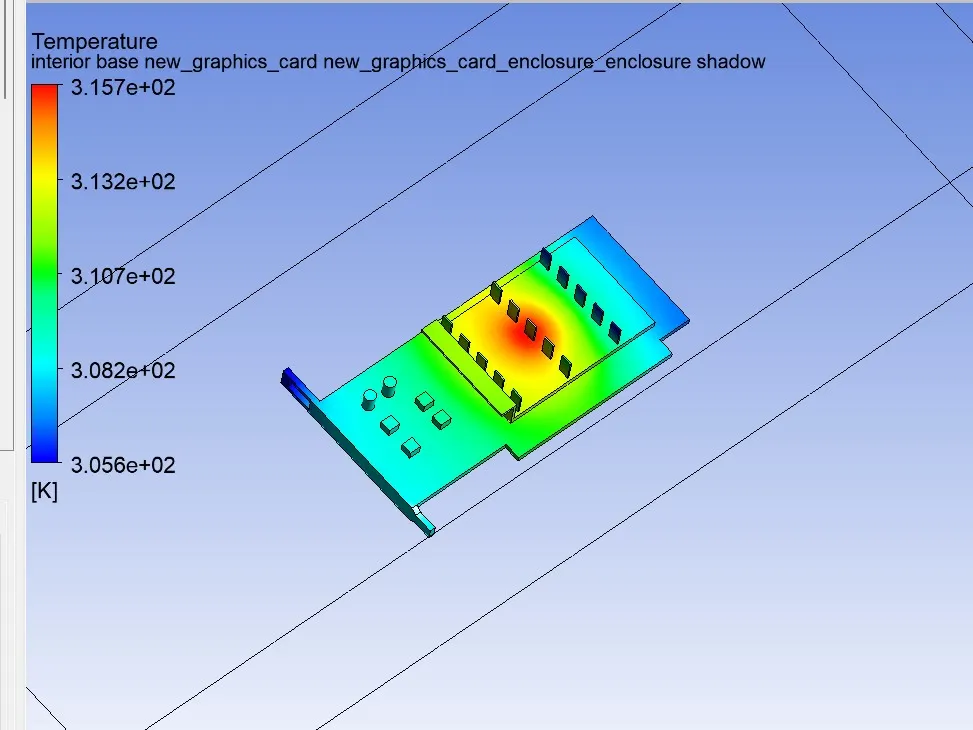
Global Hotspot Region-
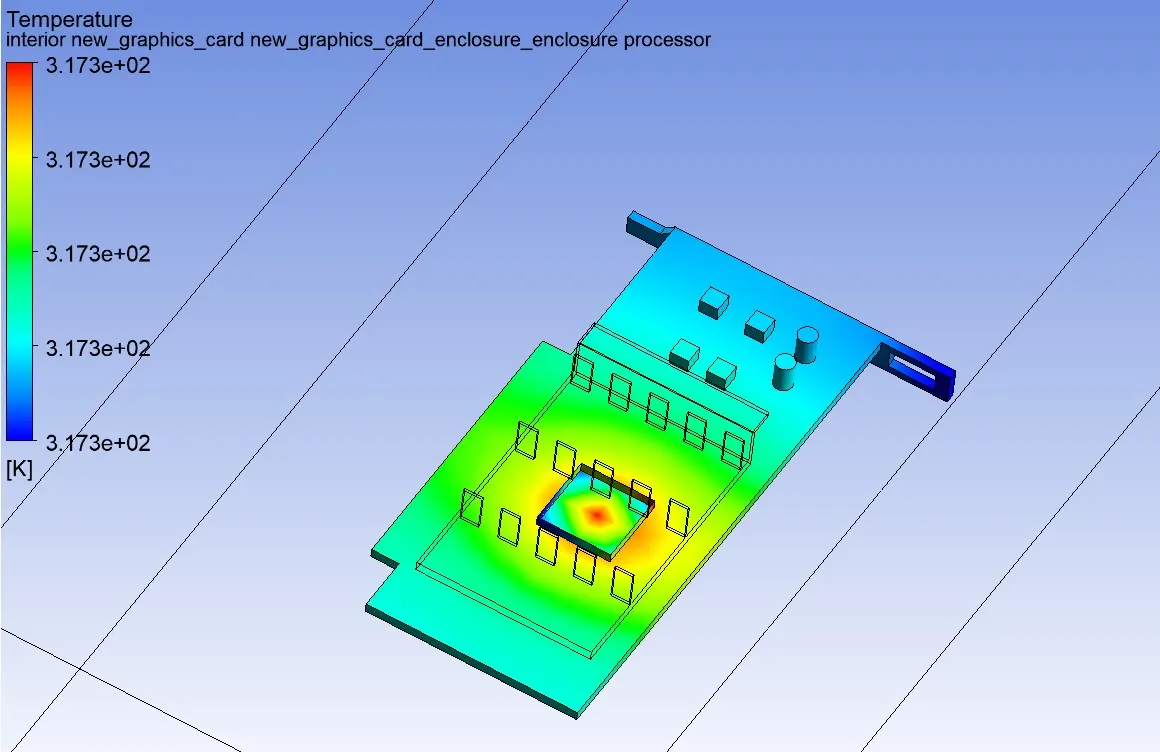
Hotspot region at the processor-
velocity=3m/s.
Residual:-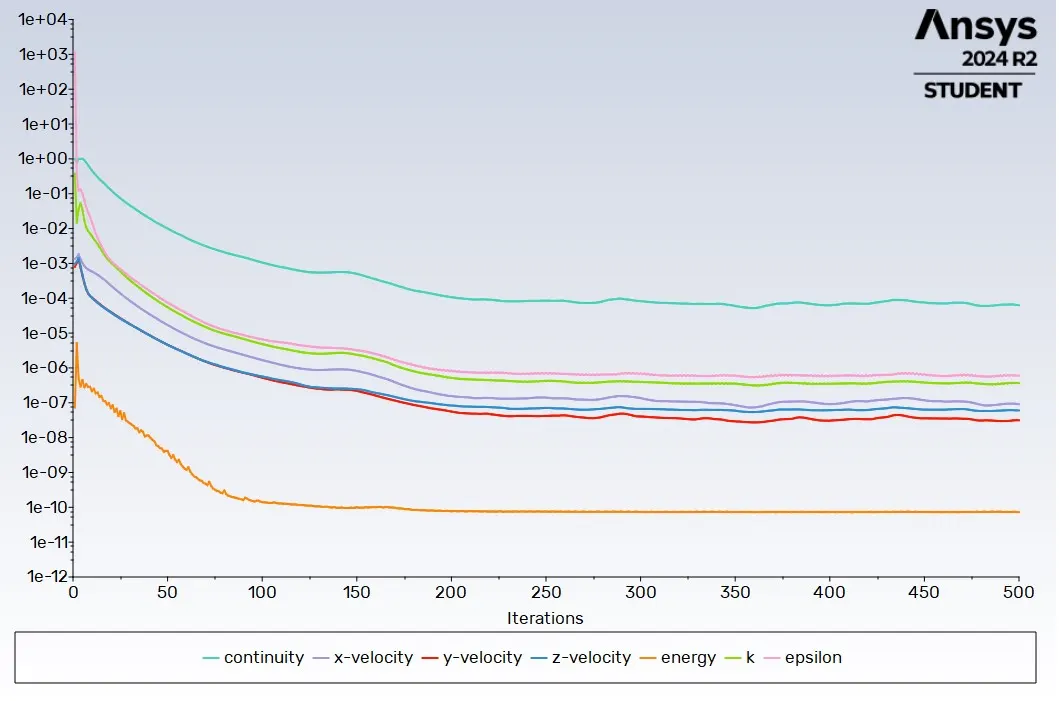
Contour static Pressure-
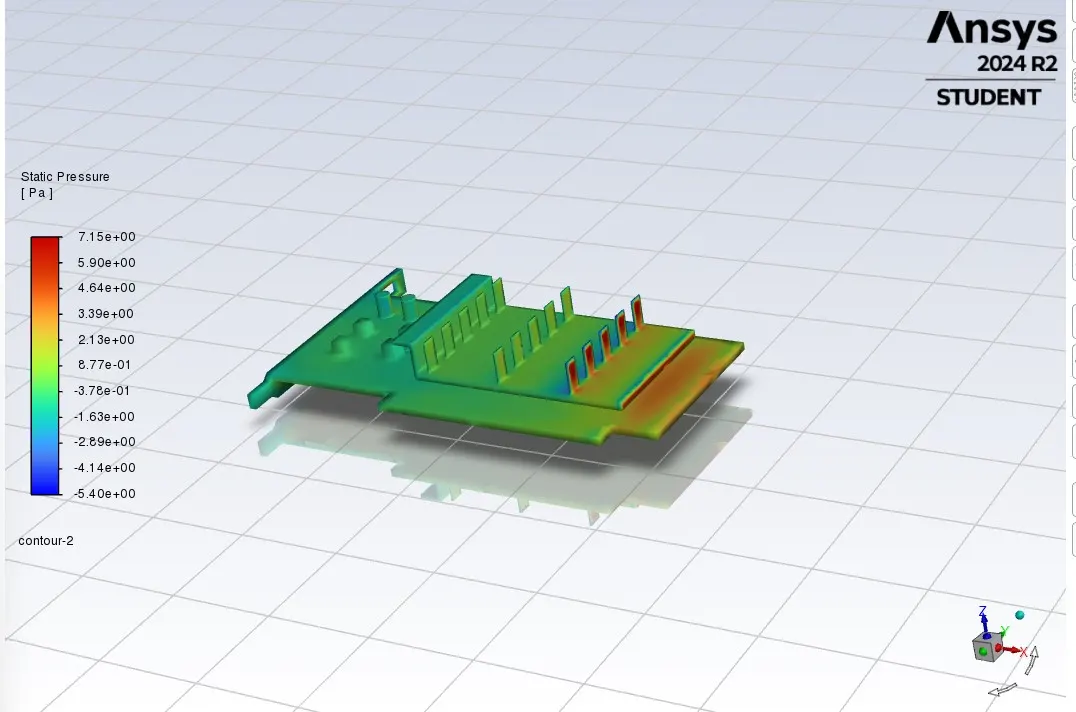
Area weighted average of temperature-
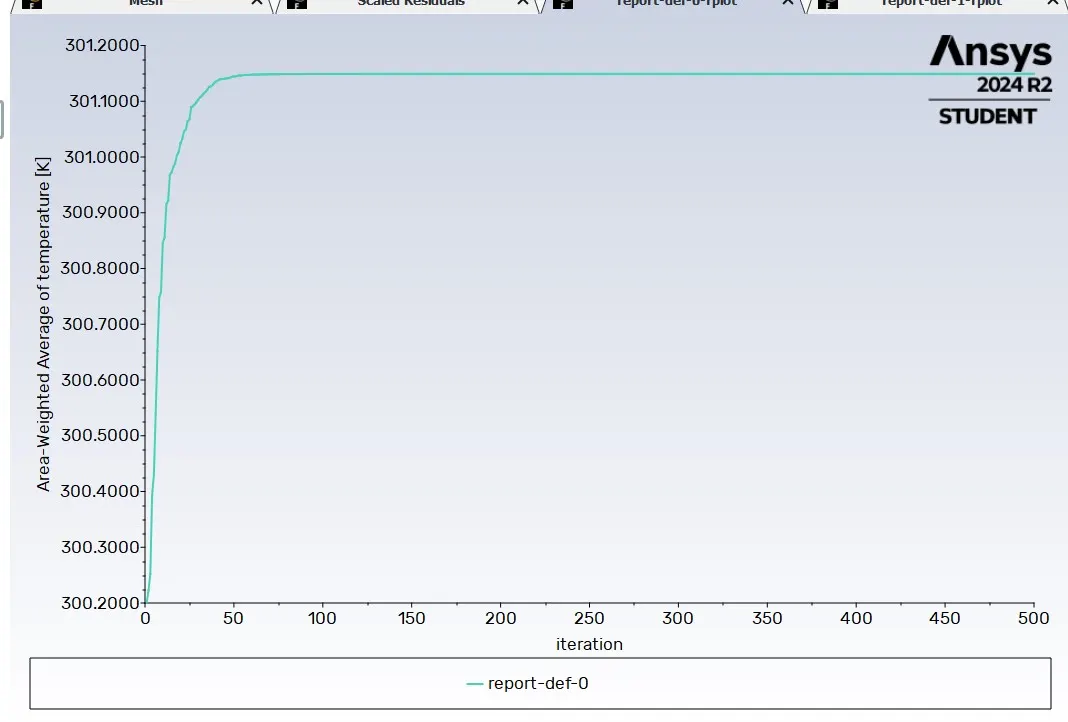
Area weighted average of heat transfer coef-wall-
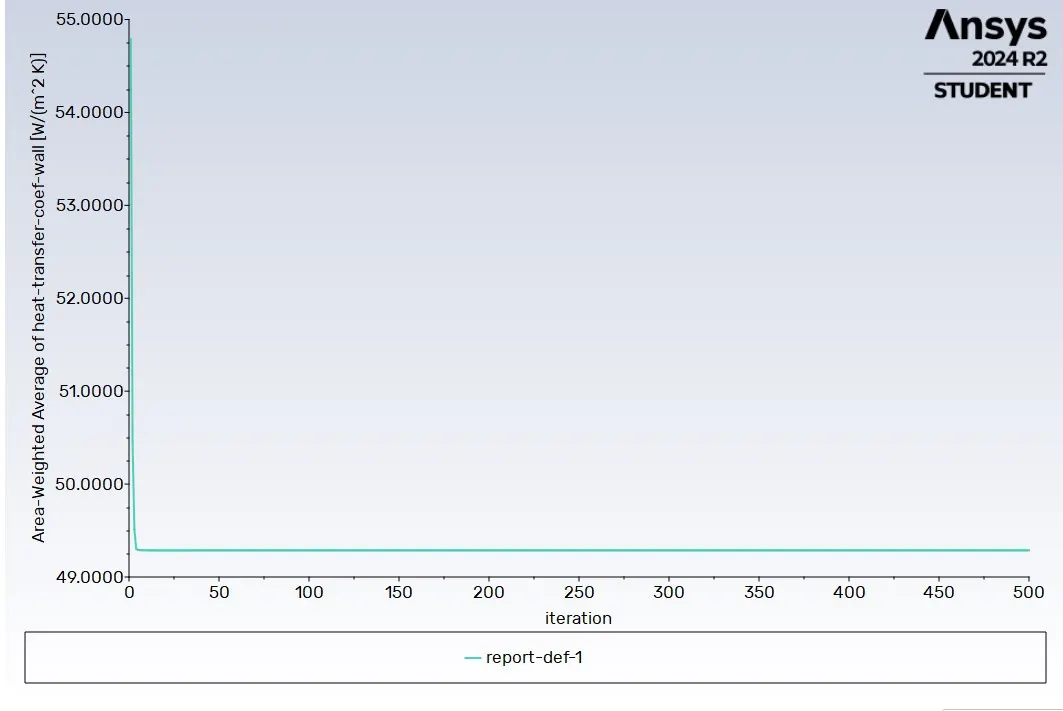
Post processing:-
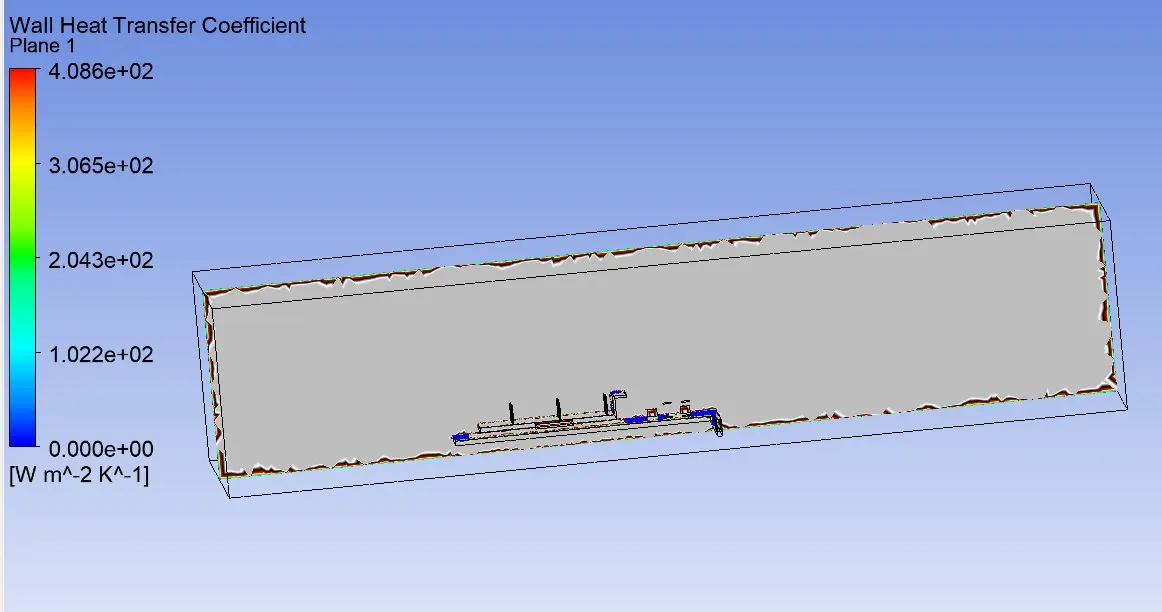
Wall Heat Transfer Coefficient-
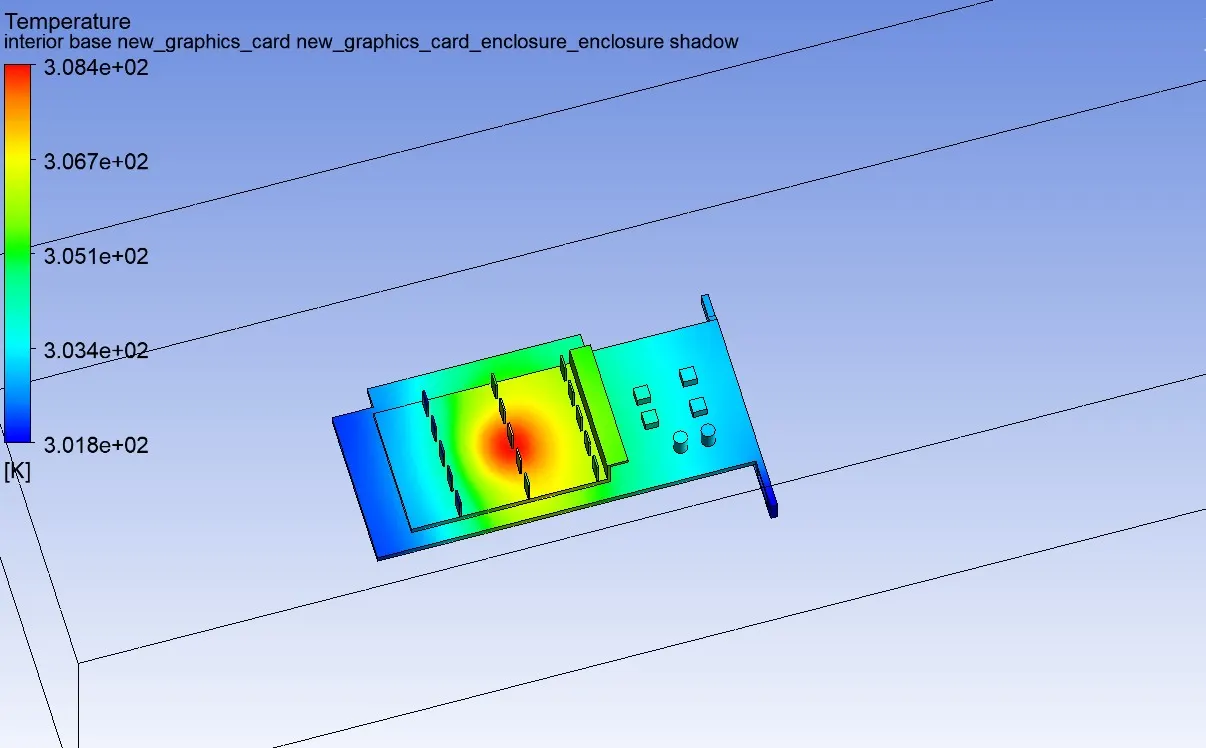
Global Hotspot Region-
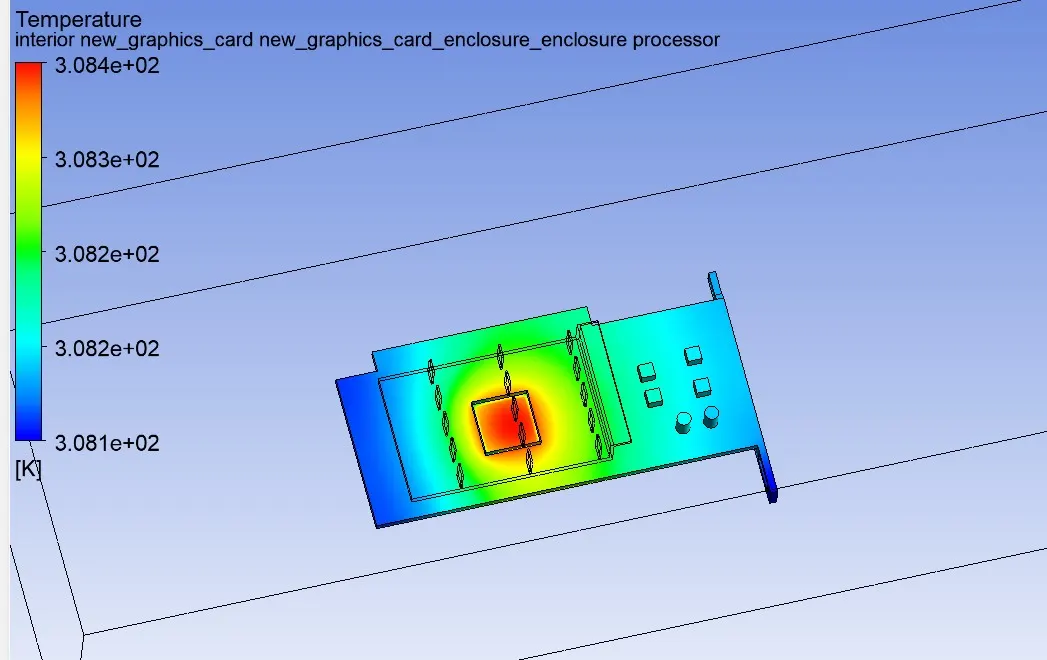
Hotspot region at the processor-
velocity=5m/s.
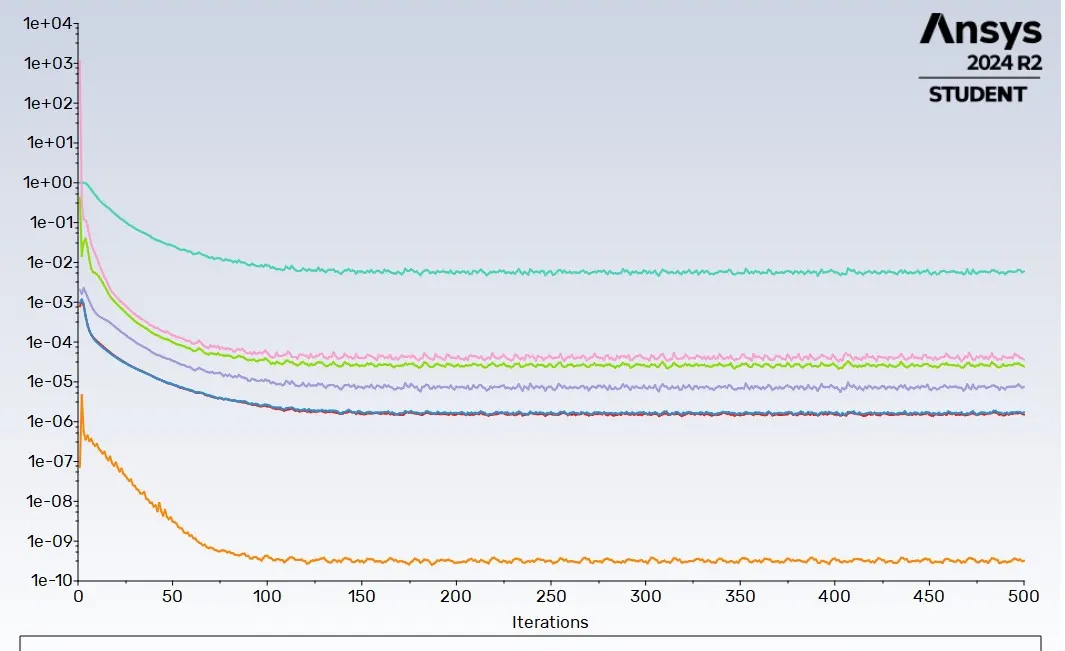
Residual:-
Contour static Pressure-
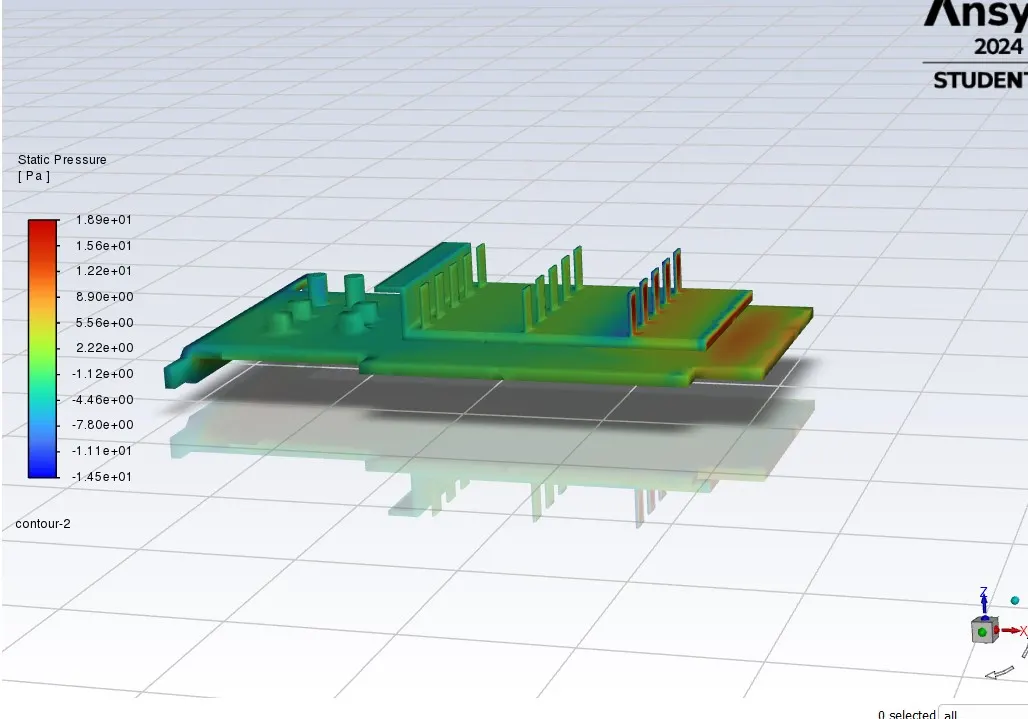
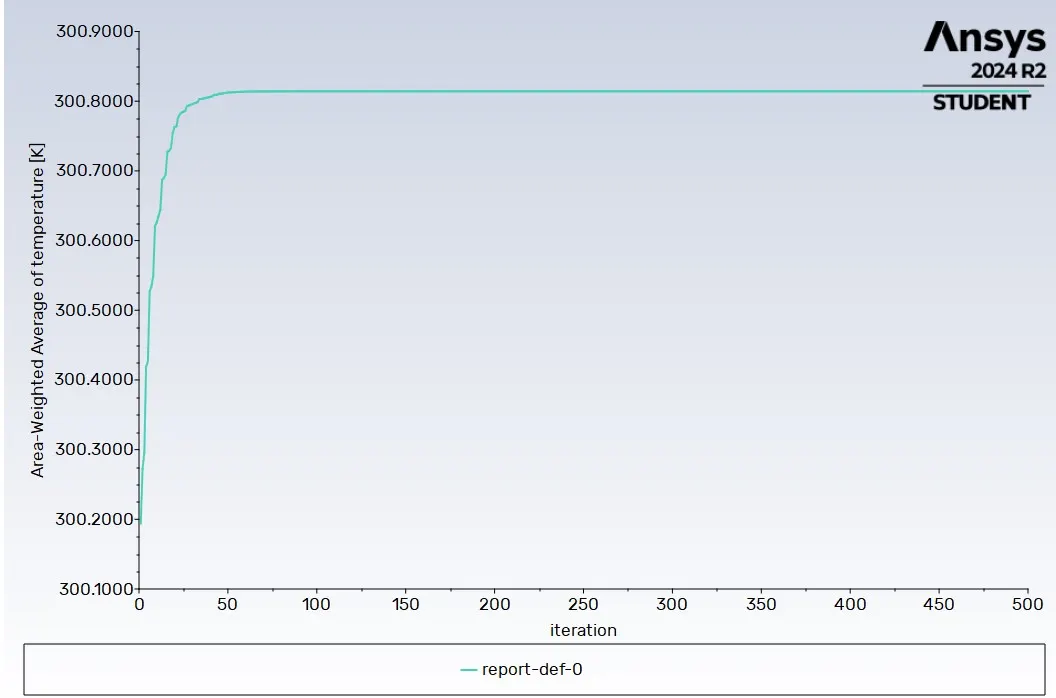
Area weighted average of temperature-
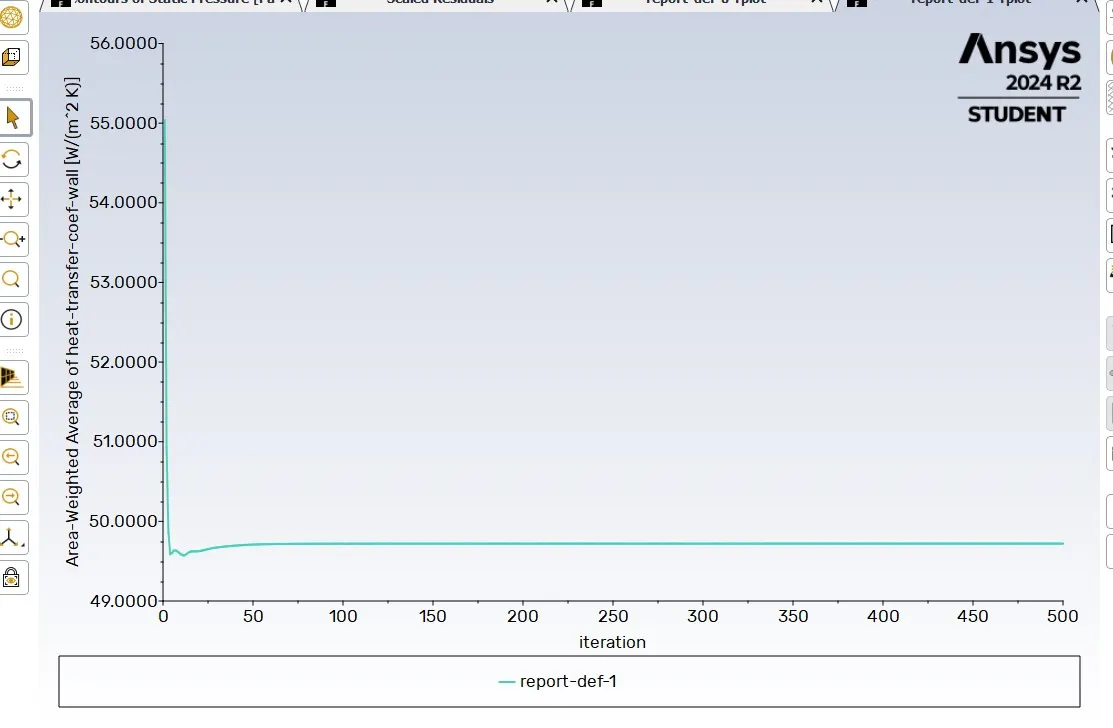
Area weighted average of heat transfer coef-wall-
Post processing:-
Wall Heat Transfer Coefficient-
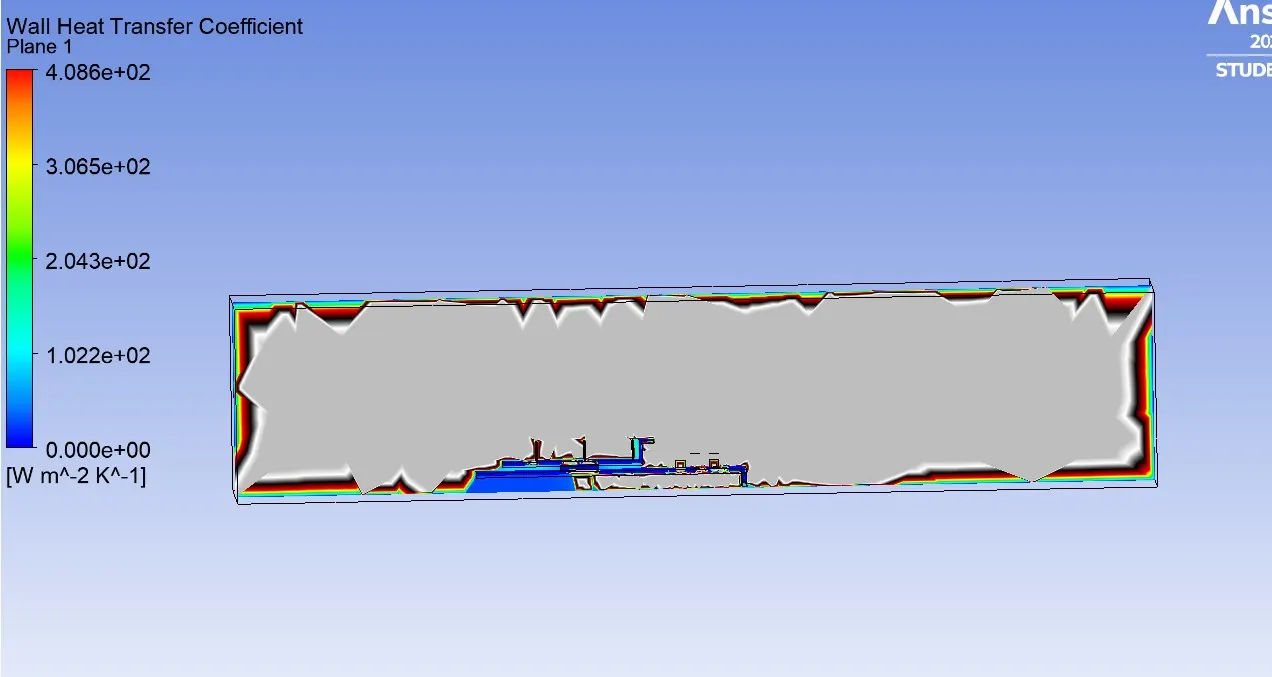
Global Hotspot Region-
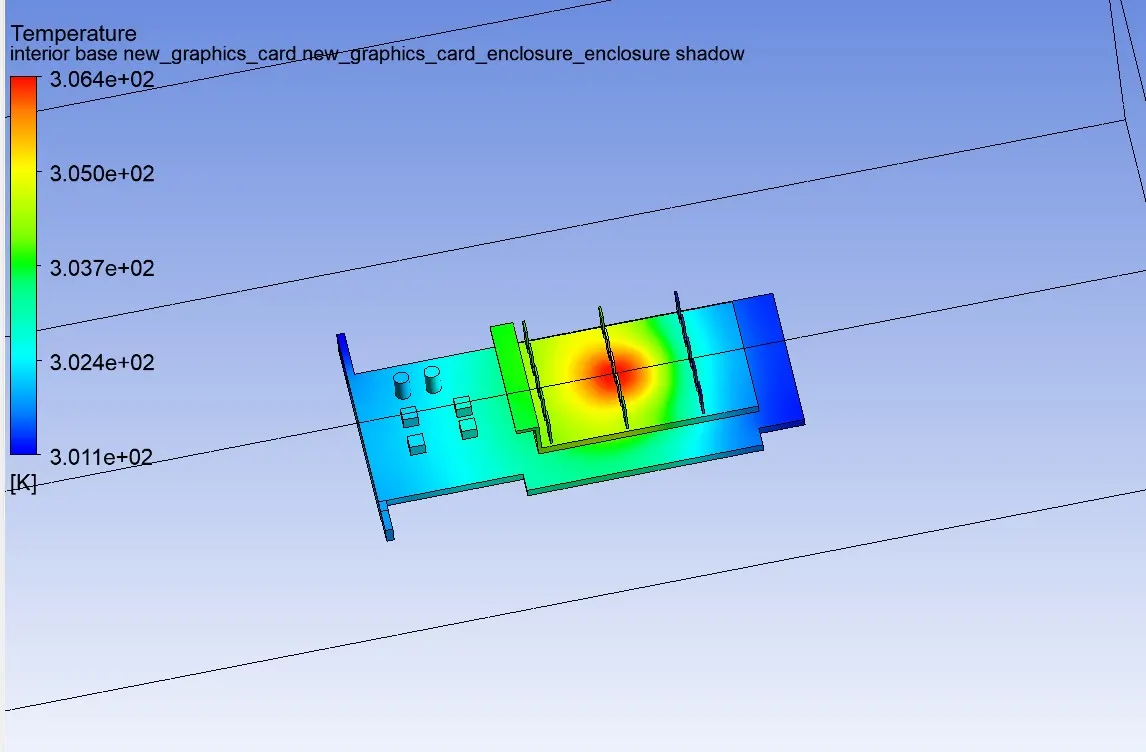
Hotspot region at the processor-
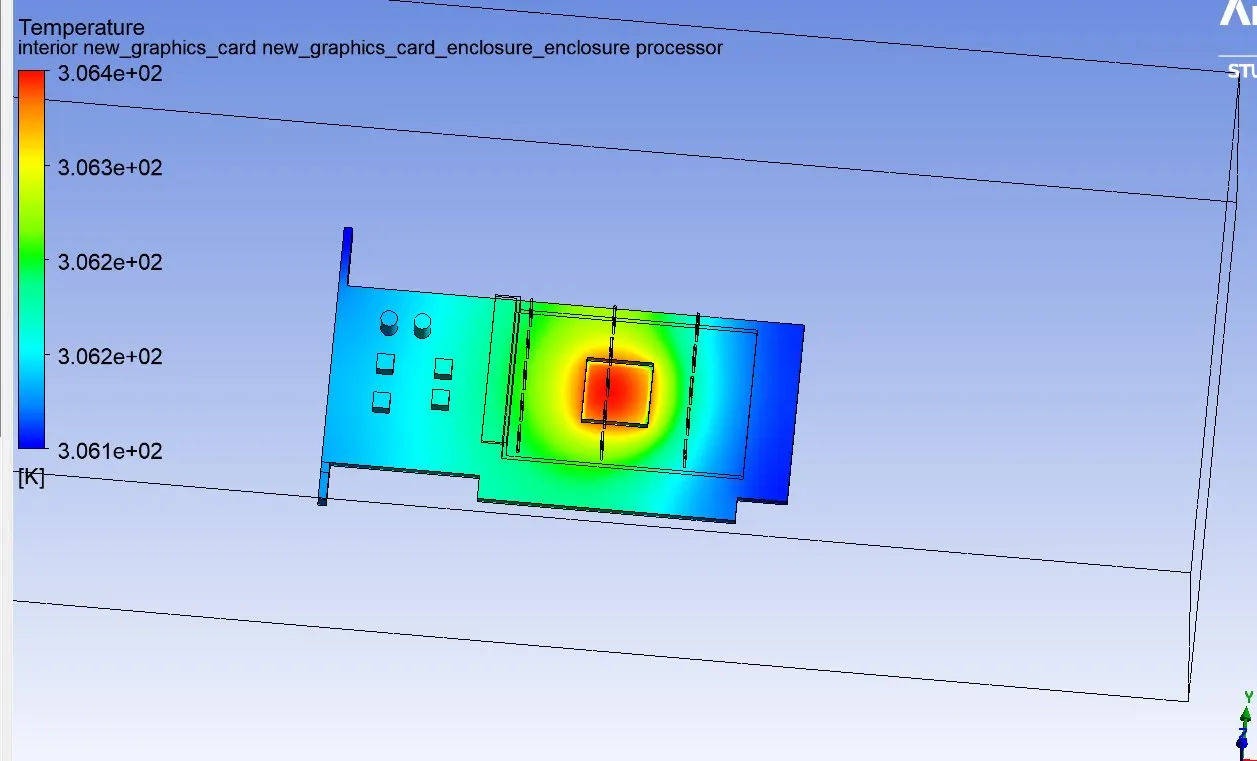
Results-
Velocity The temperature at The temperature at The temperature at HTC at Fins (W/m^2k) HTC at processor
processor(k) fins(k) Base(K) (W/m^2k)
1 315.62 315.43 310.08 20.88 2.11
3 308.28 308.05 304.20 46.04 4.56
5 306.28 306.04 302.85 64.78 8.53
Conclusion:
1. As the number of elements increases the accurate results of temperature distribution is obtained, From the above table, it is fairly notable that, the net temperature of components of graphics cards decreases with an increase in inlet velocity. Hence it can be inferred that a higher inlet velocity results in better cooling and lower the average temperature thus keeping the components safe from damage. it can be observed that the temperature of components increases as the inlet velocity decreases from 5 m/s to 1m/s, also proving that higher velocity results in better cooling.
2. A converged solution for the given sets of input was observed on the basis of repetitive plots in the Residual plot. The processor acted as a source of heat input and thus one of the hotspots for such study, With an increase in velocity, we saw a considerable drop in temperature and a substantial rise in heat transfer coefficient which shows that high-velocity air can be an effective mode of heat dissipation in graphics card.
3. From the temperature distribution, we can see hotspots in the fin and base near the surface that is in contact with the processor. Based on the thermal conductivity of the material this temperature is distributed accordingly amongst the component. We see a few high-temperature zones on fin away from processor depicting their high susceptibility to heat due to their geometry.
4. The difference in baseline and refined mesh is considerable and thus we can conclude that more refined mesh provides a better solution and can be used in optimizing the design for such applications. From the residual plot, the change in the gradients is very small with which we can conclude that the solution has converged.
5. The high-temperature points are found at fins, processor, and base area near the processor. As the wall heat transfer coefficient is a wall phenomenon and fins dissipate a large amount of heat which results in higher heat transfer co-efficient but the coarse mesh heat transfer for fins and other components in the graphics card has the same values. Hence refinement of mesh is done for fins and base of the fin and base of the graphic card in order to calculate the wall heat transfer coefficient at the fins and base.
6. The high-temperature regions are found at the center of the fins, base, and the processor walls. With further iterations, the temperature is distributed to other regions in the graphics card in the direction of the inlet airflow. Conduction occurs where there is a contact region between the solids in this case it is between processor and fins and processor and base. Convection occurs when the heat generated in the components of the graphic card is removed by the inlet airflow. The maximum temperature in the components is inversely proportional to the inlet airflow velocity. With the increase in the airflow velocity, the heat removal process by convection is faster. And also recirculation of air (vortex) at appropriate places will increase the heat transfer efficiencies hence greater amount of heat is removed by convection.