Conjugate Heat Transfer (CHT ) Modeling and Analysis of a Computer Graphics card.
Aim: To perform a steady-state conjugate heat transfer (CHT) analysis on a model of graphics card.
Objectives:
1. To perform CHT analysis with appropriate case set-up.
2. To run the case set-up for three different velocities ranging from 1 `m/s` to 5 `m/s`.
3. Investigate the maximum temperature and heat transfer coefficient attained by the processor.
4. To identify the potential hotspots on the graphics card model.
5. Perform post-processing with proper understanding of the results.
Introduction:
- A conjugate heat transfer (CHT) is inferred when there are multiple modes of heat transfers in the experimentation of a product. The modes of heat transfer involves conduction, convection and radiation.
- It is important for the computational analysis to replicate all those modes heat transfer properly.
- The numerical / simulation results obtained must hold good agreement with experimental / analytical results within accepted tolerance for approximation.
- In this project, a CHT analysis is performed on a scaled model of a graphic card. The modes of heat transfer are restricted to conduction and convection only.
- A graphic card is an expansion card used in computer which generates a feed of output images to a display device. This GPU (Graphics Processing Unit) are used for gaming, ray tracing, simulation softwares, graphic production and for other compuational purposes.
Case Characteristics:
Three simulation case set-up's are pre-determined with varying air velocities and using same turbulence model.
| Cases | Air Velocity (m/s) | `Y^+` | Turbulence Model |
| Case 1 | 1 | 3 | K-omega (SST) |
| Case 2 | 3 | 3 | K-omega (SST) |
| Case 3 | 5 | 3 | K-omega (SST) |
Heat generation approximation:
- A normal graphic card consumes 345 W of energy and 99.99% of this energy is dissipated as heat. ref[1]
- The dimensions of a normal graphic card processor is 40 x 40 x 20 mm, which results into volume of 3.2e-6 m^3.
- The geometry in this project is scaled by the factor of 50 which is 8 x 8 x 1 mm. The volume of the processor results into 6.4e-8 m^3.
- Suppose if original graphic card processor is generating 65 W of heat, then heat generation for the processor is calculated as,
`65/ (0.04xx0.04xx0.002) = 2.03125xx10^7 W/m^3`
- For our scaled geometry we will assume `2xx10^7 W/m^3` as the heat generation for simplicity.
I. Pre-processing:
A] Geometry:
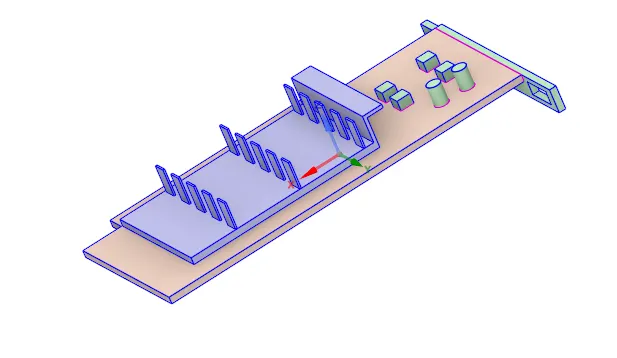
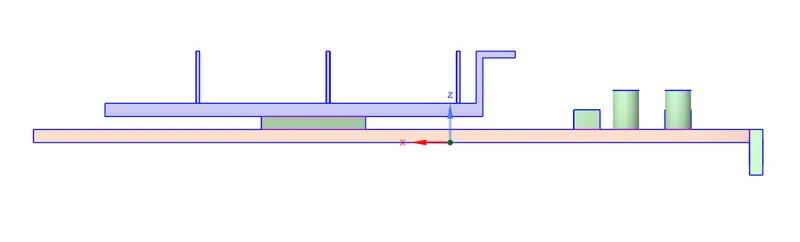
The graphic card geometry is imported in "SpaceClaim" and all the discrete components are visualized to bolster topological understanding. All the discrete components are selected and shared using "share" command under "workbench" tab. This usually helps in building "conformal mesh", which is important to share information within discrete components. Especially in Conjugate Heat Transfer (CHT) analysis it is mandatory to have conformal meshes.
1) Isometric View:
2) Side View:
The geometrical set-up is updated in "Fluent Meshing". Initially, it is better to assign "Named Selections" before meshing the geometry. This helps in body selection with no mistakes for meshing discrete components. Moreover the named selections helps in identifying components and faces to assign boundary condition in "Fluent" solver.
B] Named selection:
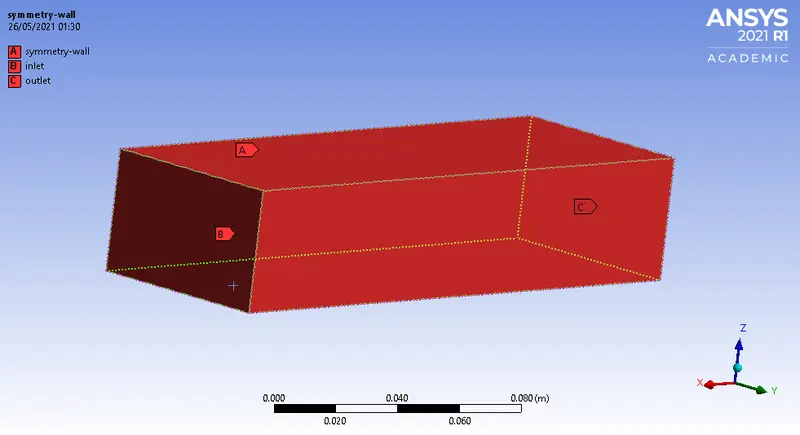
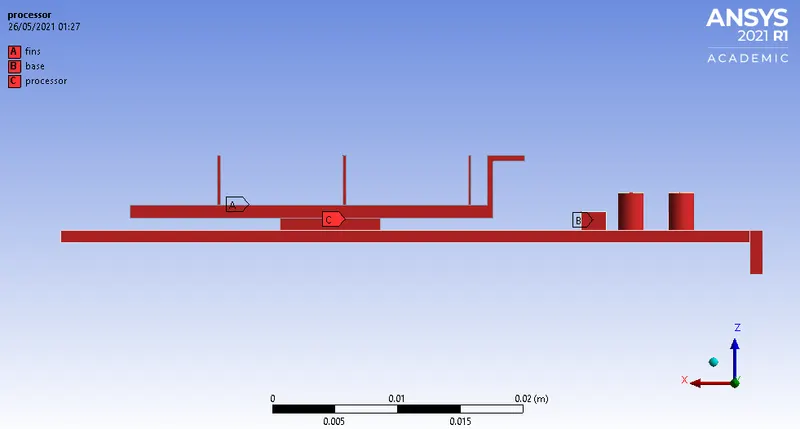
The faces colored in red define physical significance of discrete parts of the geometry. Accordingly, some of the named selections define boundaries of the domain.
1) Enclosure:
It acts a constrained box and has an inlet which replicates cooling fan of the graphics card.
2) Graphic card set-up geometry:
C] Mesh:
Mesh Details:
| Element Size | 5 mm |
| Max. Element Size | 5 mm |
| Body Sizing (Fins) | 0.5 mm |
| Body Sizing (Base) | 0.8 mm |
| Body Sizing (Processor) | 0.3 mm |
| Inflation | Processor walls |
| `Y^+` | 3 |
| Inflation type | Total Thickness |
| No. of Inflation Layers | 5 |
| Growth Rate | 1.2 |
| Maximum Thickness | 0.7 mm |
| Total number of cells | 5,10,510 |
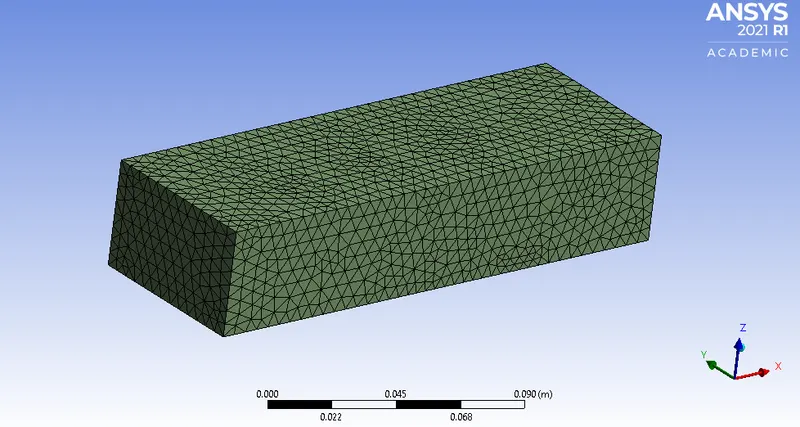
1) Enclosure:
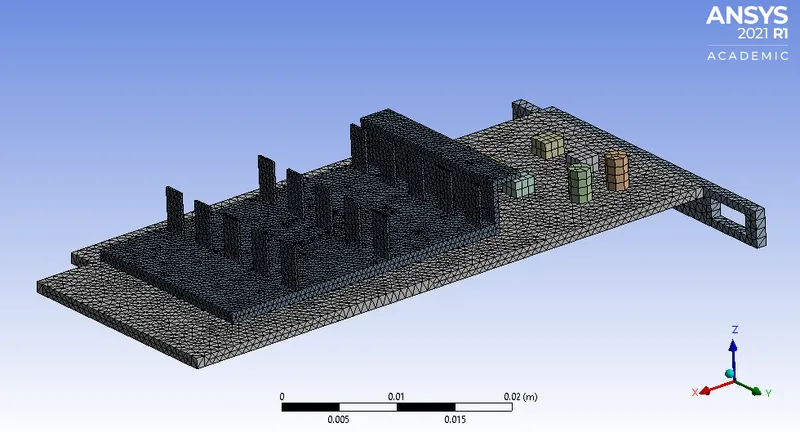
2) Graphic card set-up:
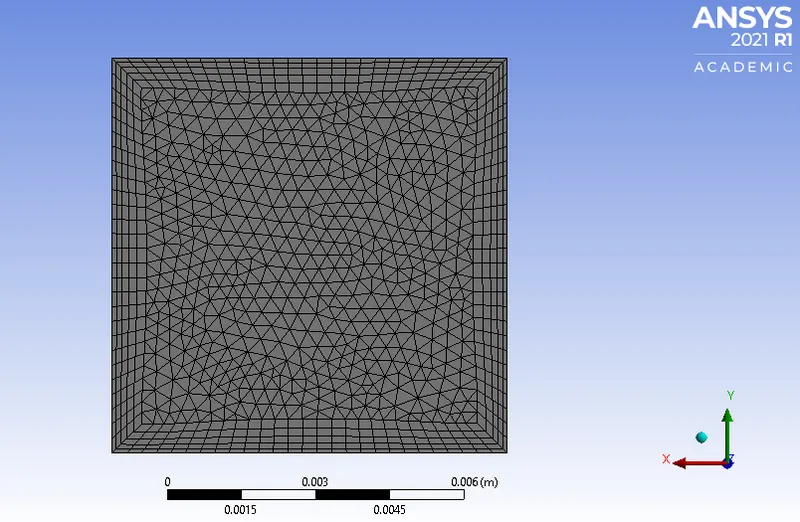
3) Inflation layers over the processor walls:
Note:
Fine mesh is used for the processor because it is the source of heat generation through which heat will be dissipated to all the other components. Mesh element size of other components near to the processor are also kept as fine as possible. It is necessary for a CHT analysis to keep mesh interface between two zones (solid or fluid) as fine and conformal as possible. Inflation layers are provided to the processor walls to capture heat transfer coefficient more accurately.
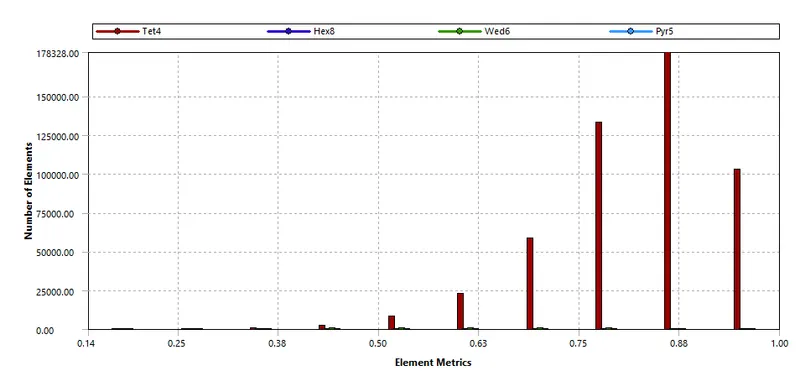
D] Mesh Quality:
Case set-up used:
| Solver Type | Pressure-based |
| Simulation Type | Steady-State Simulation |
| Velocity Formulation | Absolute Velocity |
| Pressure-Velocity Coupling | Coupled |
Material Characteritics:
A] Fluid:
| Working Fluid | Air |
| Density | 1.225 `(Kg)/m^3` |
| Specific Heat | 1006.43 `J/(Kg K)` |
| Thermal Conductivity | 0.0242 `W/(m K)` |
| Dynamic Viscosity | 1.7894e-5 `(Kg)/(m s)` |
| Inlet Temperature of Air | 300 K |
B] Solid:
Appropriate material selection is made to obtain more realistic CHT approximation. The data for Processor and PCB base is inferred from ref [2].
1. Fins:
| Solid Material | Aluminum |
| Density | 2719 `(Kg)/m^3` |
| Specific Heat at Const. Pressure | 871 `J/(Kg K)` |
| Thermal conductivity | 202.4 `W/(m K)` |
2. Processor:
| Solid Material | Silicon |
| Density | 2330 `(Kg)/m^3` |
| Specific Heat at Const. Pressure | 710 `J/(Kg K)` |
| Thermal conductivity | 150 `W/(m K)` |
3. Printed Circuit Board Base:
| Solid Material | Flame Retardant (FR4) |
| Density | 1900 `(Kg)/m^3` |
| Specific Heat at Const. Pressure | 1150 `J/(Kg K)` |
| Thermal conductivity | 0.294 `W/(m K)` |
Part I: Steady-State CHT Analysis
II. Post-processing:
Case 1:
| Air Velocity | 1 `m/s` |
| Turbulence Model | K-omega (SST) |
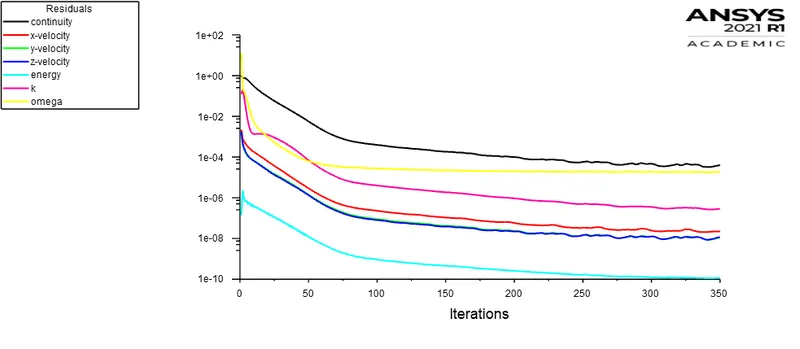
A] Scaled Residuals:
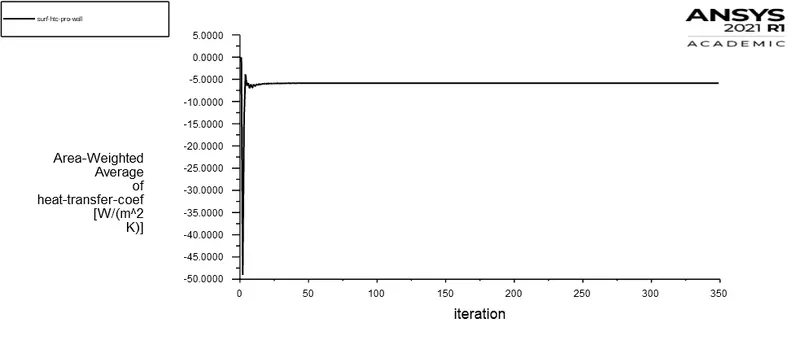
B] Report plot (Surface HTC - Processor wall):
C] Contours:
1. Temperature:
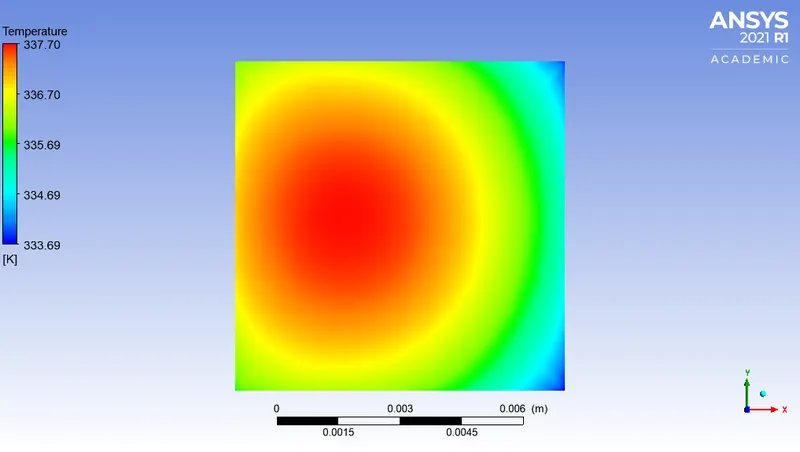
a) Processor face in contact with the fins:
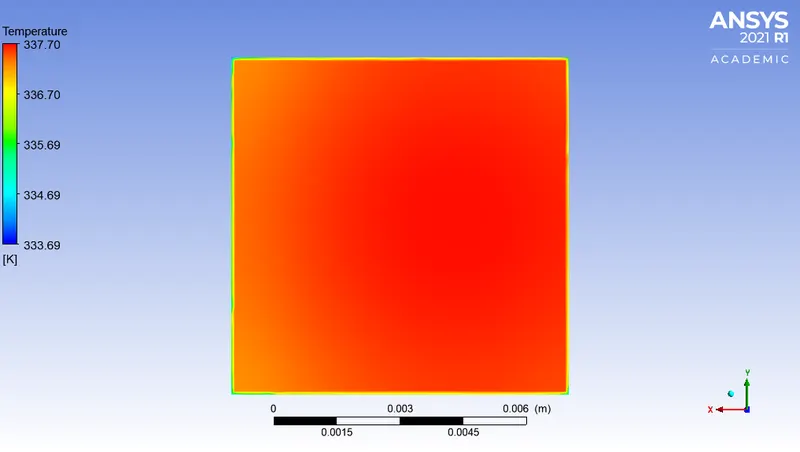
b) Processor face in contact with the PCB base:
c) Processor walls exposed to forced air circulation:
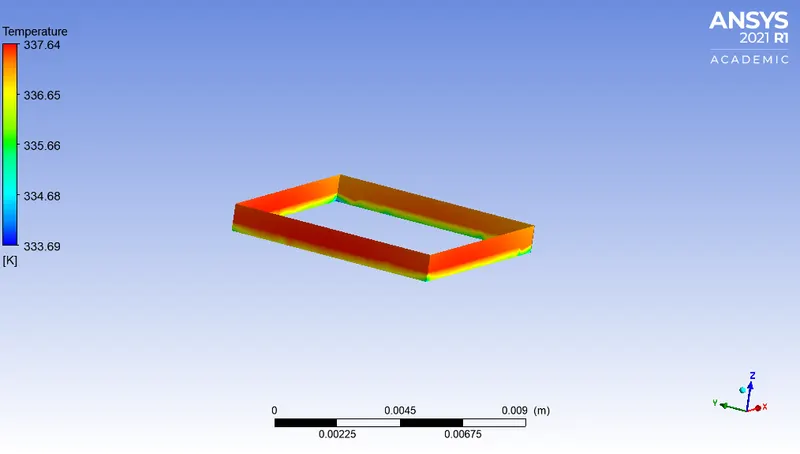
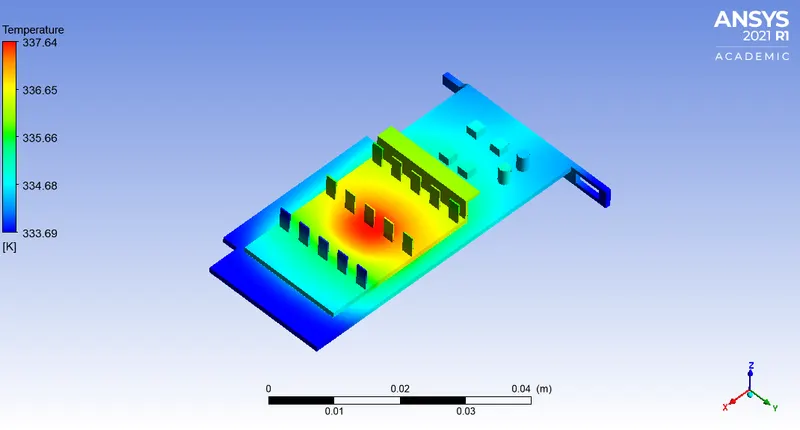
d) Graphic Card Set-up (Isometric View):
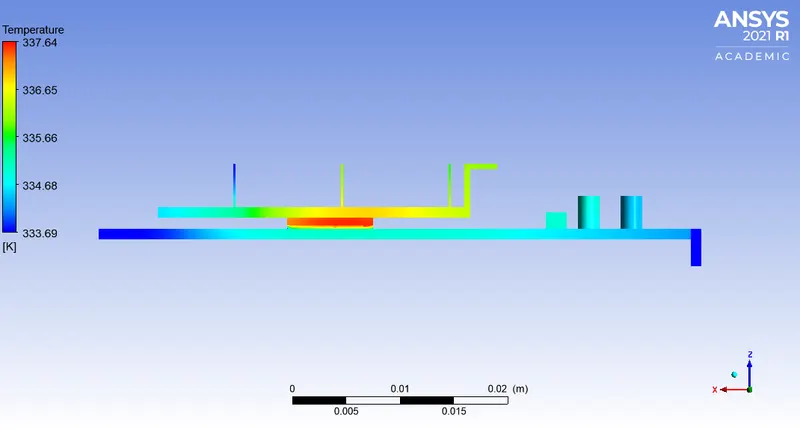
e) Graphic Card Set-up (Side View):
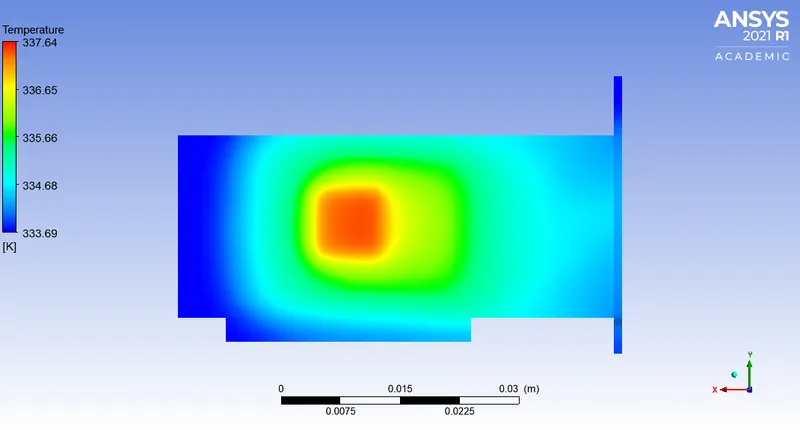
f) Temperature distribution over bottom of the PCB base:
2. Velocity:
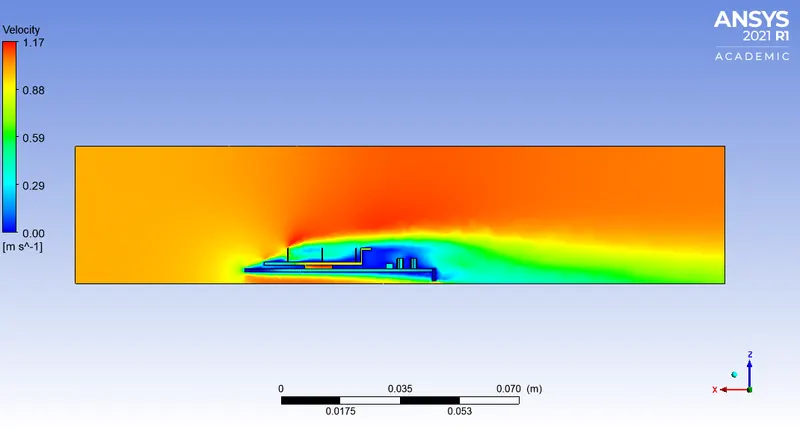
a) Velocity Contour:
b) Velocity Vector plot:
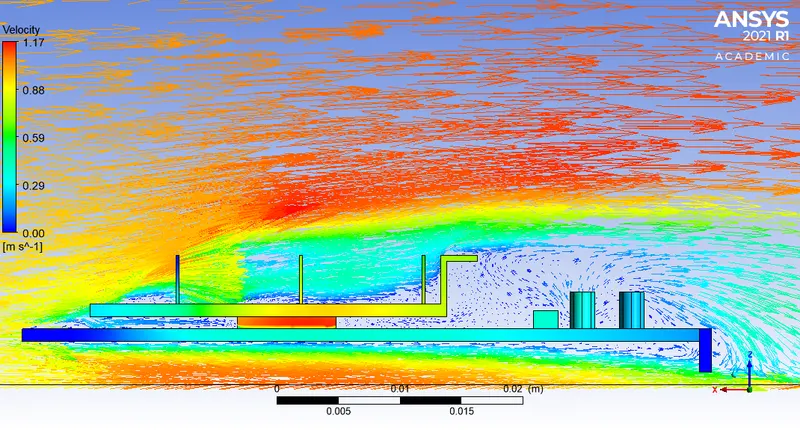
3. Heat Transfer Coefficient:
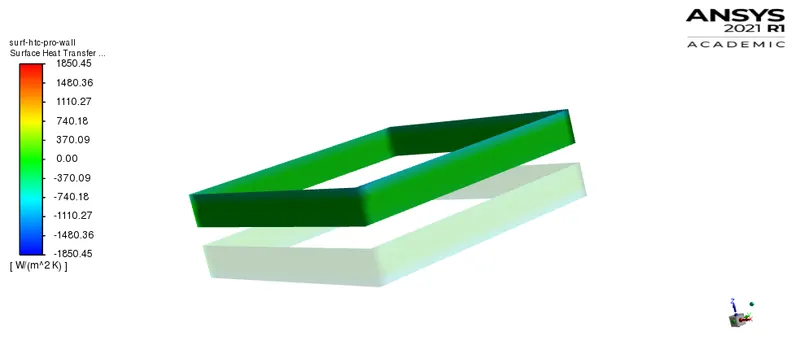
a) Processor walls:
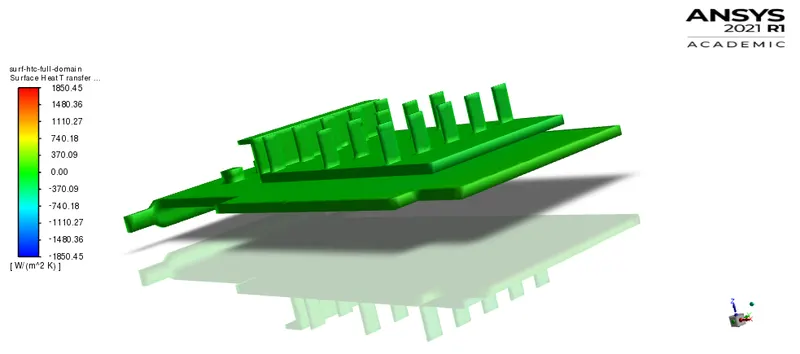
b) Graphic Card Set-up:
Case 2:
| Air Velocity | 3 `m/s` |
| Turbulence Model | K-omega (SST) |
A] Scaled Residuals:
B] Report plot (Surface HTC - Processor wall):
C] Contours:
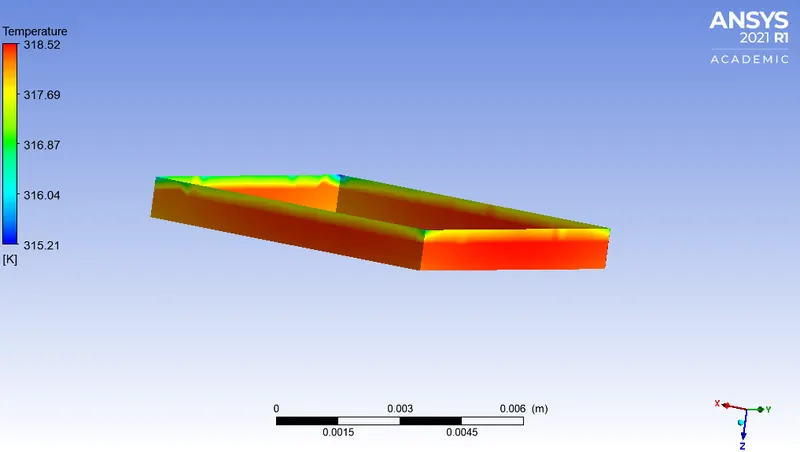
1. Temperature:
a) Processor face in contact with the fins:
b) Processor face in contact with the PCB base:
c) Processor walls exposed to forced air circulation:
d) Graphic Card Set-up (Isometric View):
e) Graphic Card Set-up (Side View):
f) Temperature distribution over bottom of the PCB base:
2. Velocity:
a) Velocity Contour:
b) Velocity Vector plot:
3. Heat Transfer Coefficient:
a) Processor walls:
b) Graphic Card Set-up:
Case 3:
| Air Velocity | 5 `m/s` |
| Turbulence Model | K-omega (SST) |
A] Scaled Residuals:
B] Report plot (Surface HTC - Processor wall):
C] Contours:
1. Temperature:
a) Processor face in contact with the fins:
b) Processor face in contact with the PCB base:
c) Processor walls exposed to forced air circulation:
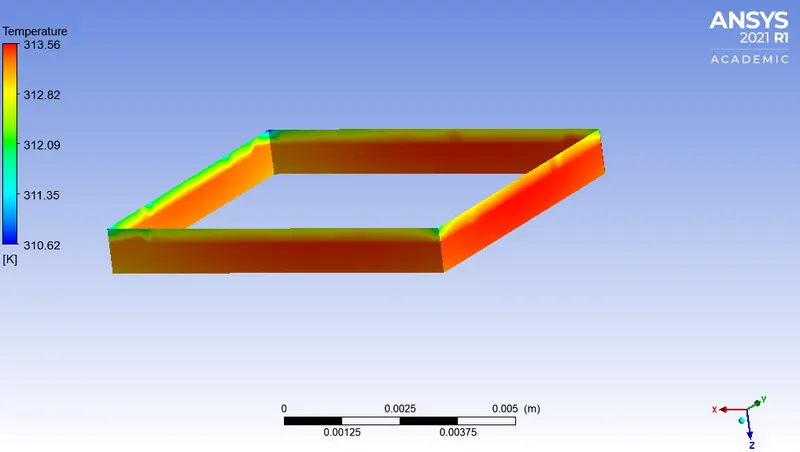
d) Graphic Card Set-up (Isometric View):
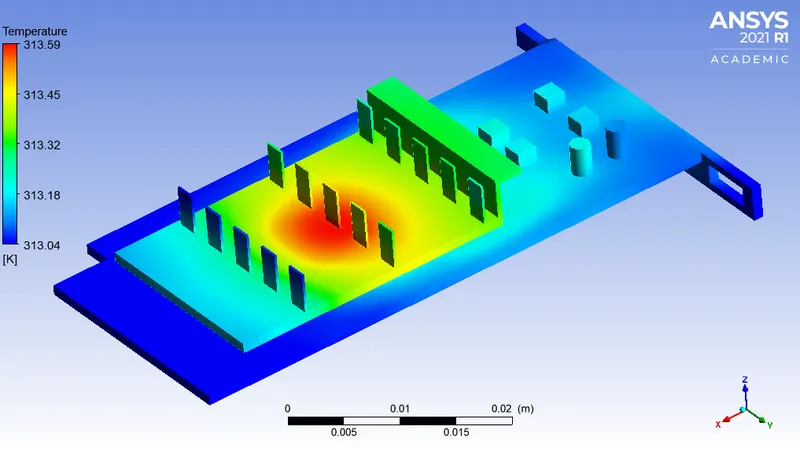
e) Graphic Card Set-up (Side View):
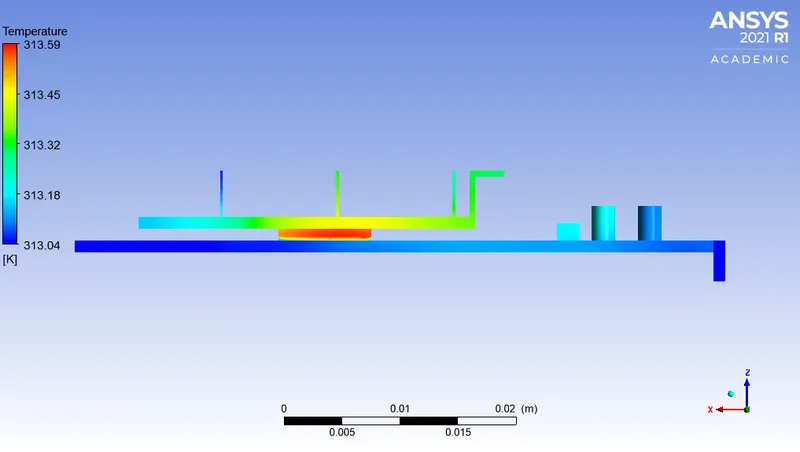
f) Temperature distribution over bottom of the PCB base:
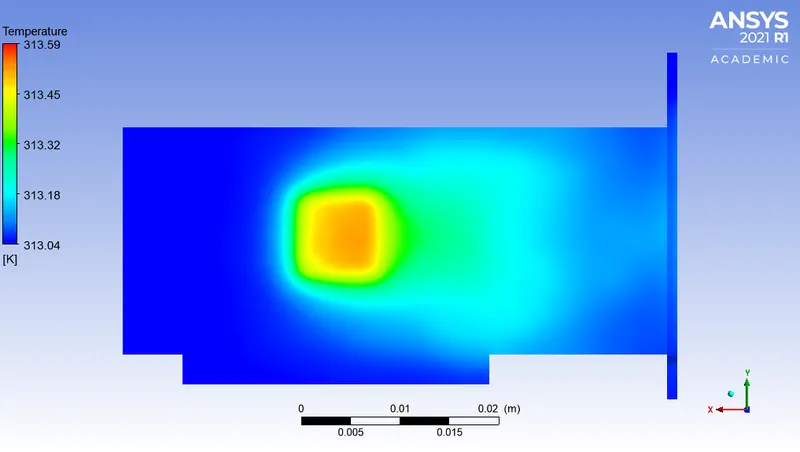
2. Velocity:
a) Velocity Contour:
b) Velocity Vector plot:
3. Heat Transfer Coefficient:
a) Processor walls:
b) Graphic Card Set-up:
Attainment of steady-state condition / Achievement of convergence:
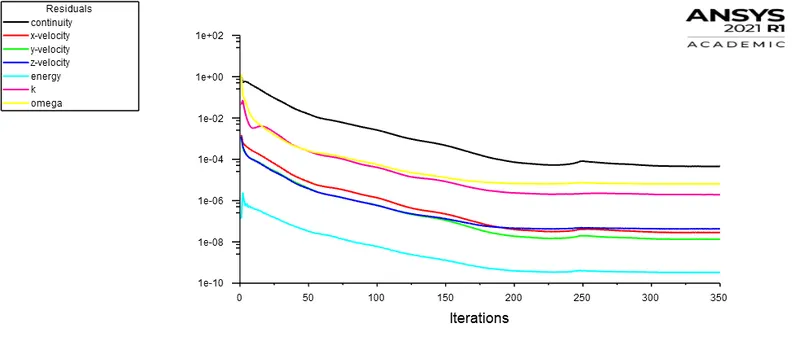
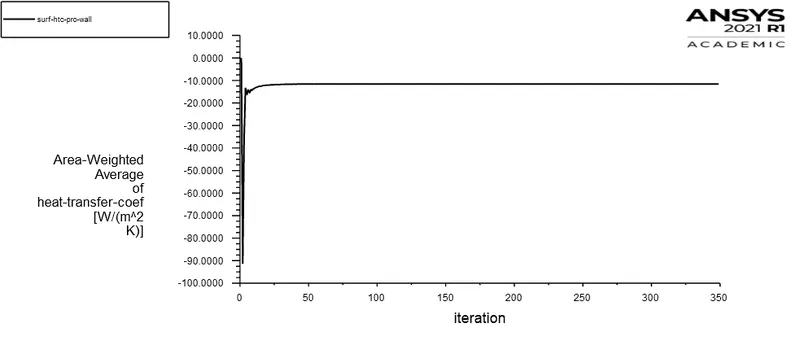
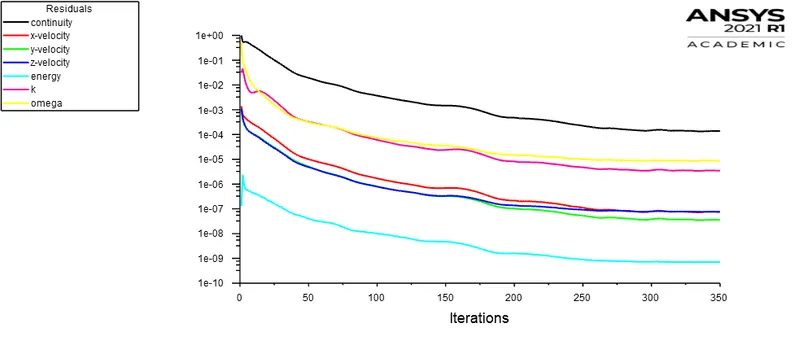
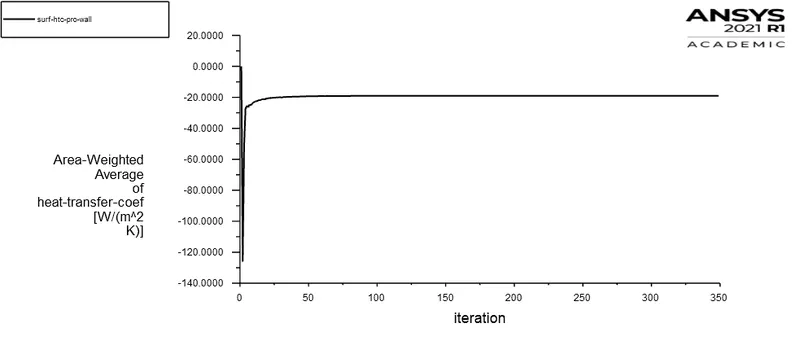
Attainment of the steady-state condition can be realized when the temperature of the system components is not varying as a function of time advancement. Additionally the monitor point for heat transfer coefficient is also not varying as function of time. It can be explicitly visualized in the report plot of every case study. The scaled residuals are also showing no randomness and signifying independent convergence of the governing equations. Also the temperature of the processor walls and other graphic card components achieved thermal equilibrium. It is sufficient to infer convergence achievement of numerical solution instead running it for larger time and spending extensive computation resources.
Observation Table:
A] Processor Walls:
| Cases | Air velocity (`m/s`) |
Average Temperature (K) |
Maximum Temperature (K) |
Average Surface Heat Transfer Coefficient (`W/(m^2K)`) | Maximum Surface Heat Transfer Coefficient (`W/(m^2K)`) | Minimum Surface Heat Transfer Coefficient (`W/(m^2K)`) |
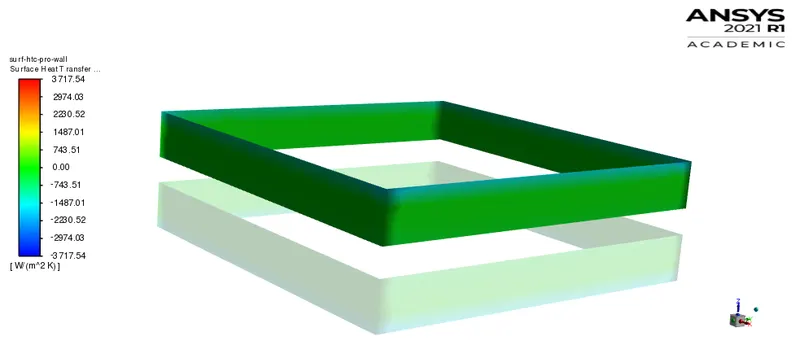
| Case 1 | 1 | 337.4525 | 337.6436 | 5.8687 | 30.5414 | 0.6221 |
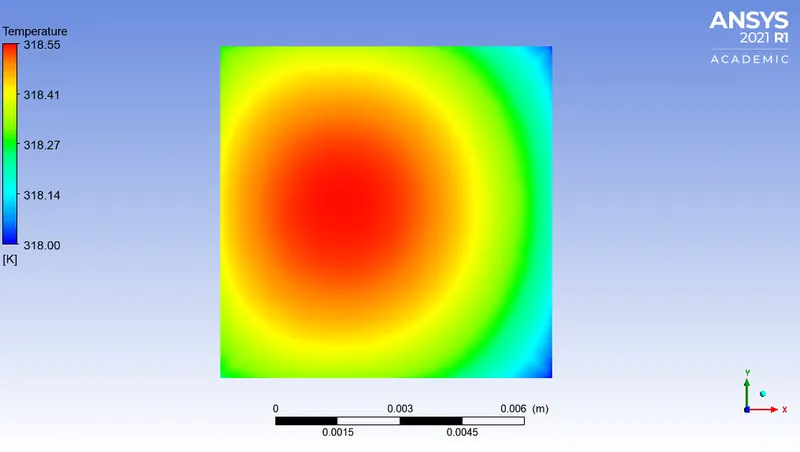
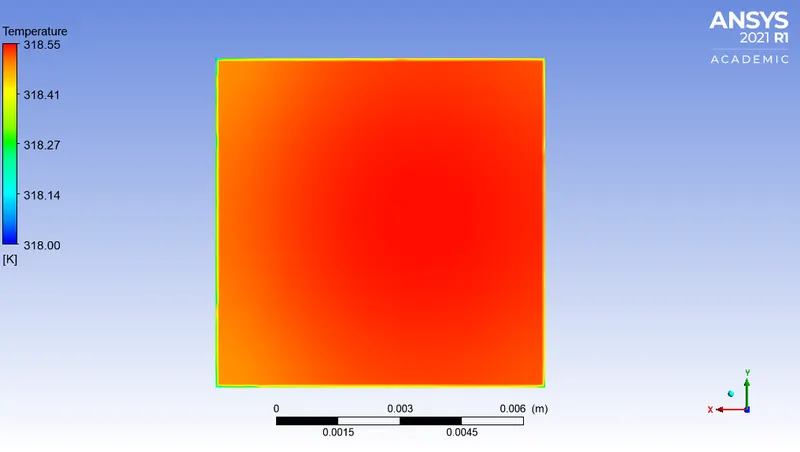
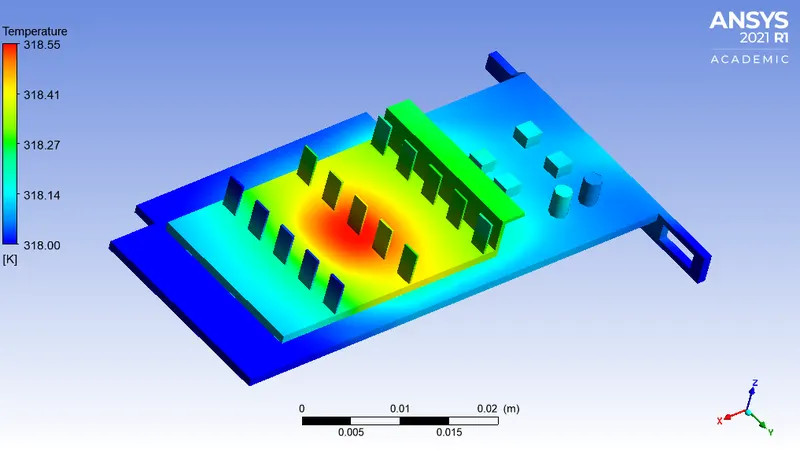
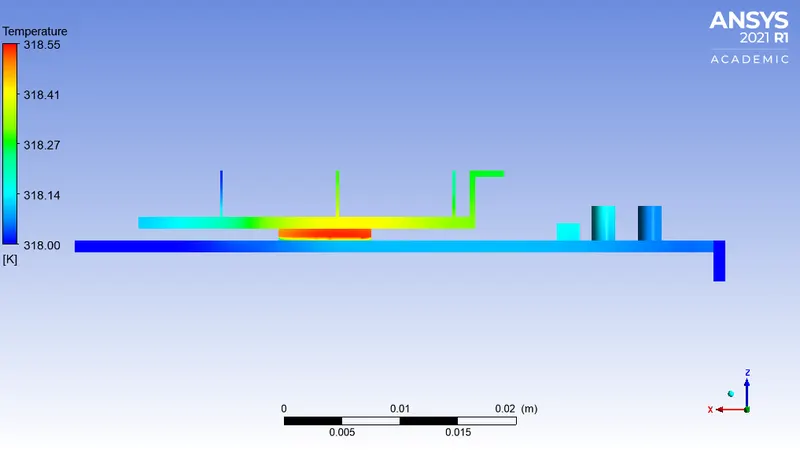
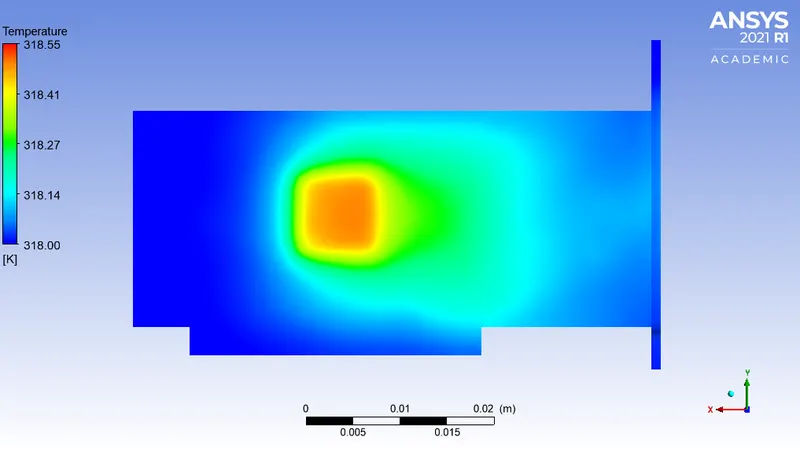
| Case 2 | 3 | 318.3574 | 318.5252 | 11.553 | 51.7729 | 1.0456 |
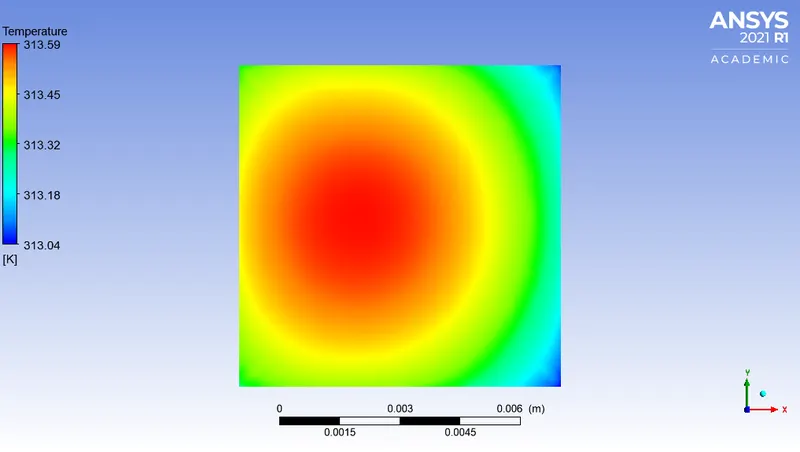
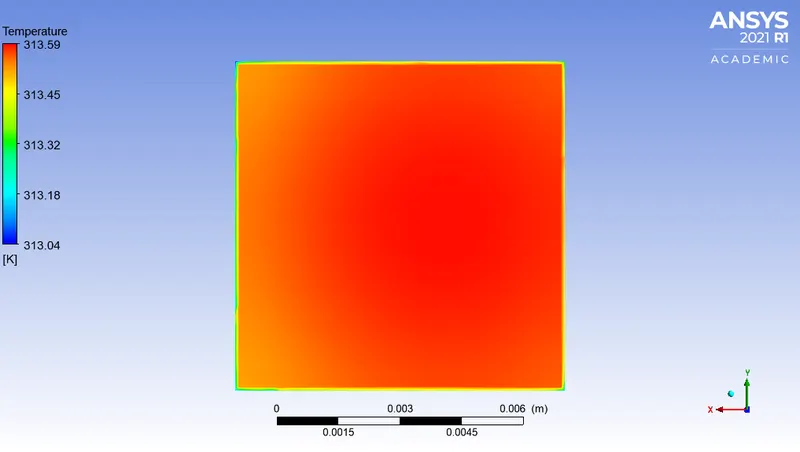
| Case 3 | 5 | 313.3992 | 313.5671 | 18.9706 | 91.6503 | 1.3235 |
B] Fins:
| Cases | Air velocity (`m/s`) |
Average Temperature (K) |
Maximum Temperature (K) |
Average Surface Heat Transfer Coefficient (`W/(m^2K)`) | Maximum Surface Heat Transfer Coefficient (`W/(m^2K)`) | Minimum Surface Heat Transfer Coefficient (`W/(m^2K)`) |
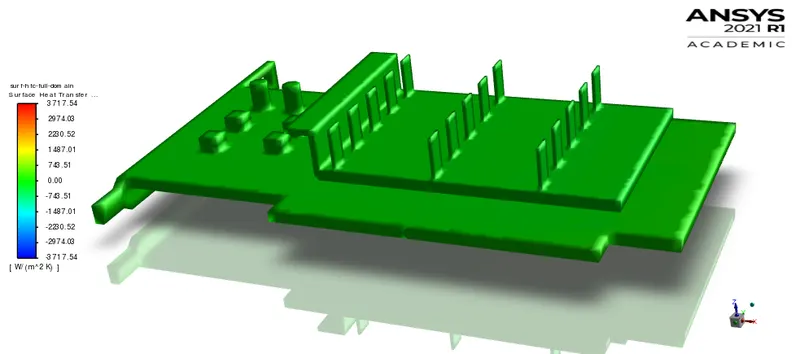
| Case 1 | 1 | 336.5963 | 337.6233 | 19.3091 | 204.9091 | 0.0028 |
| Case 2 | 3 | 317.5017 | 318.5086 | 41.1579 | 290.4263 | 0.1593 |
| Case 3 | 5 | 312.5601 | 313.5495 | 57.7354 | 338.5252 | 0.3007 |
Technical Discussion:
The processsor of the graphics card is responsible for the heat generation in the system. Fins (made of high thermal conducting materials) are used as an extended surface to dissipate heat from the processor. The mode of heat transfer is purely conduction in this case (processor to fins). That is the reason to choose high thermal conducting material to extract / conduct heat as much as possible. Again the base of the processor is made up of an insulating material which inherents thermal resistance (inverse of thermal conductivity). It curbs the thermal dissipation from the processor to the base, which increases thermal stress on the processor. To negate this cause, the heat dissipation needs to be enhanced from the processor walls and upper surface of the processor which is coupled to fins. The problem can be facilitated by introducing high thermal conducting material instead of insulating one. But this will cause the other components on the PCB to conduct heat and will lead to system deterioration. That is the reason to use thermal resistant material which curbs the heat transfer to adjacent circuits or components. This finds need to enhance heat dissipation from the processor walls which are subjected to forced air circulation and fins to extract more and more heat and dissipate it to the surrounding.
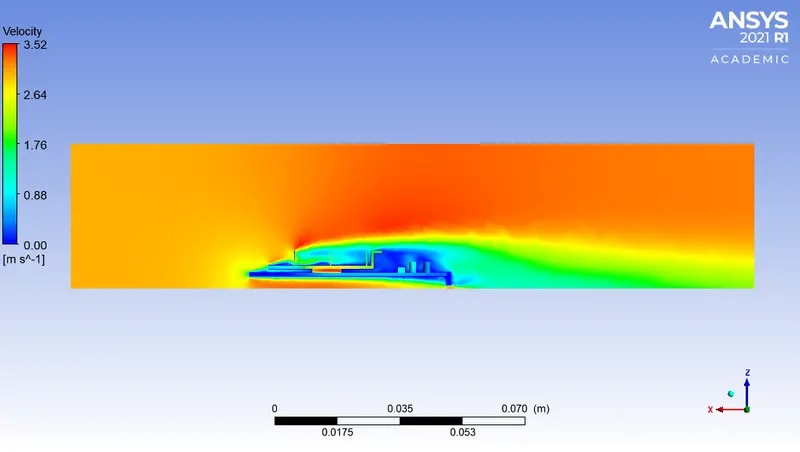
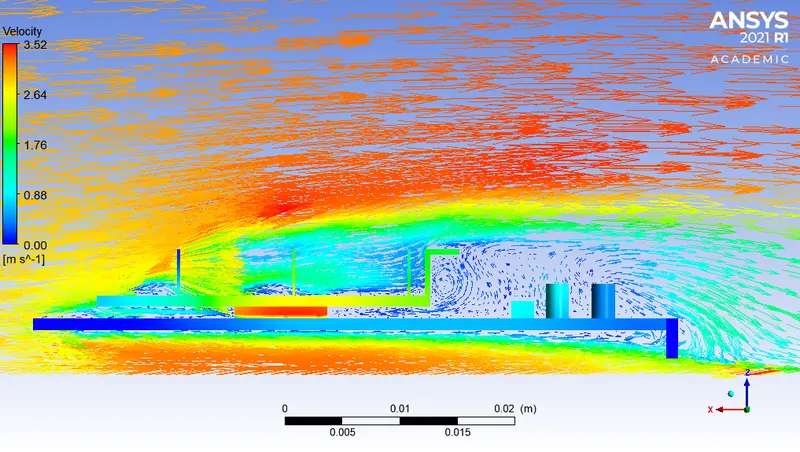
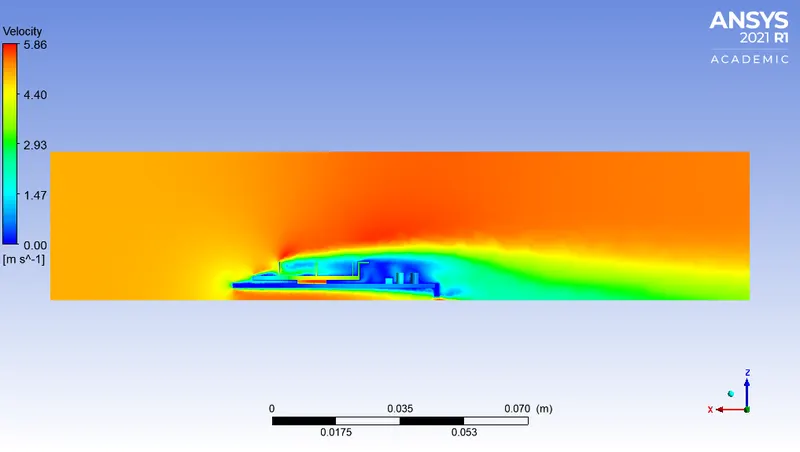
The sole heat dissipation cause is dependent on air velocity. Air at different velocities has a significant impact on heat dissipation. Initially air at low velocity i.e. (1 m/s) is passed over the graphic card to absorb heat from the heated surfaces. As a steady-state solution the average wall temperature of the graphic card is maintained at 337.4525 (approx `64^0c`). The resulted heat transfer coefficient is also very less (`5.8687 W/(m^2 K)`) which indicates poor convective heat dissipation. However as the velocity is increased there is further improvement in the convective heat dissipation and the reduced wall temperature. This is because the heat transfer coefficient directly varies with the Reynolds number. Accordingly, for higher heat transfer coefficients the heat dissipation increases proportionally (`Q_(dissipation) = hAtriangleT`).
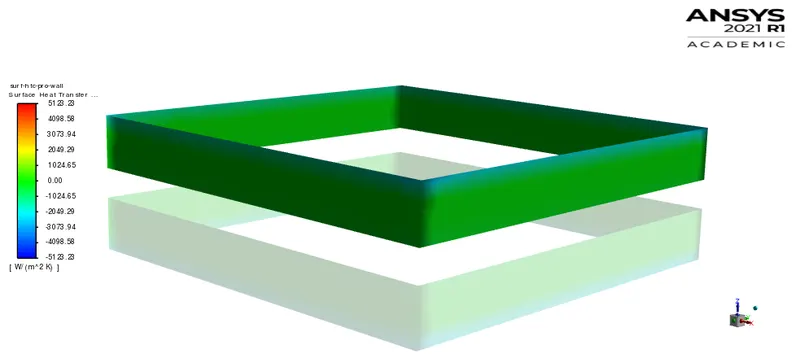
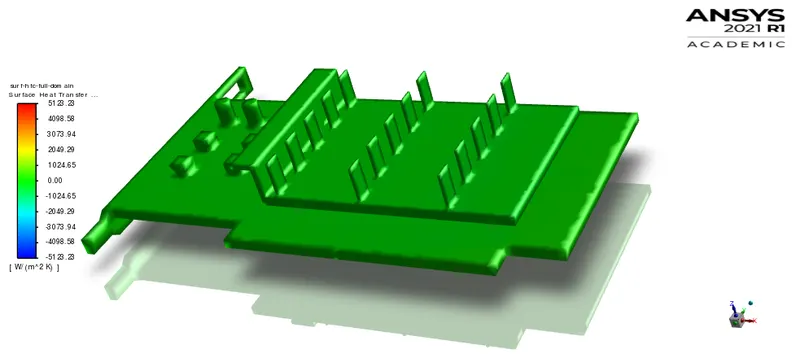
Moreover heat transfer coefficient is comparatively maximum in case of fins than the processor walls. This is because much of the air is in contact with the fins (extended surface) as compared to processor walls which leads to more heat dissipation from the system. Accordingly the average and maximum temperature of both fins and processor shares a common magnitude scale with negligible differences which infers attainment of the steady state condition.
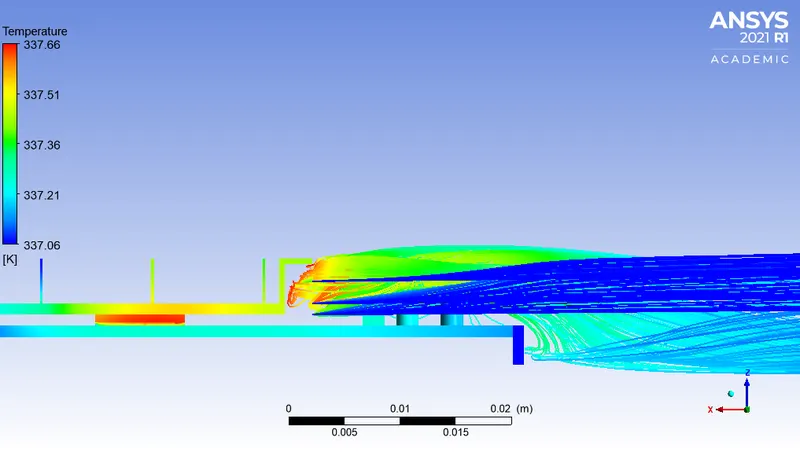
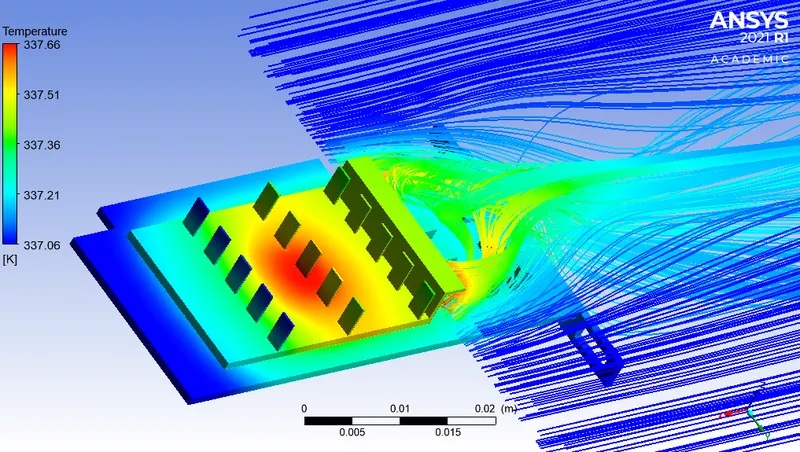
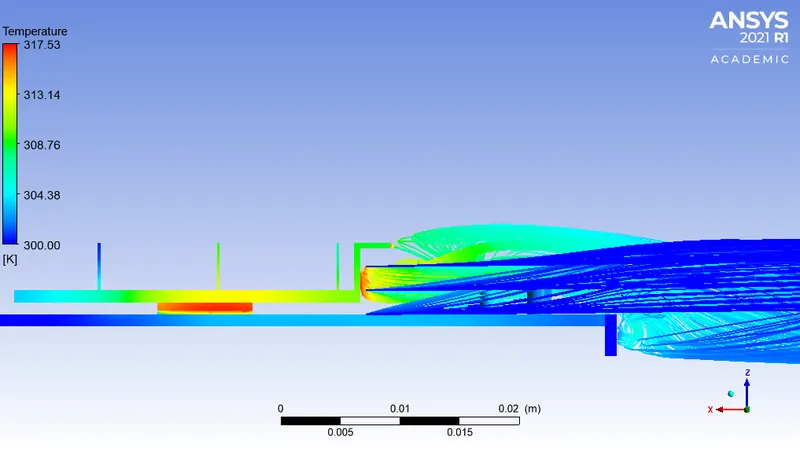
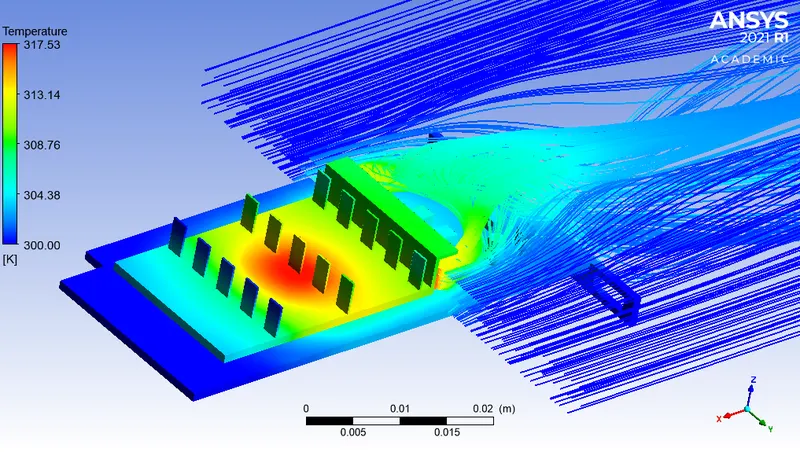
Part II: Temperature of Air in the Re-circulation Region
Case 1:
| Air Velocity | 1 `m/s` |
| Turbulence Model | K-omega (SST) |
a) Side View:
b) Isometric View:
Case 2:
| Air Velocity | 3 `m/s` |
| Turbulence Model | K-omega (SST) |
a) Side View:
b) Isometric View:
Case 3:
| Air Velocity | 5 `m/s` |
| Turbulence Model | K-omega (SST) |
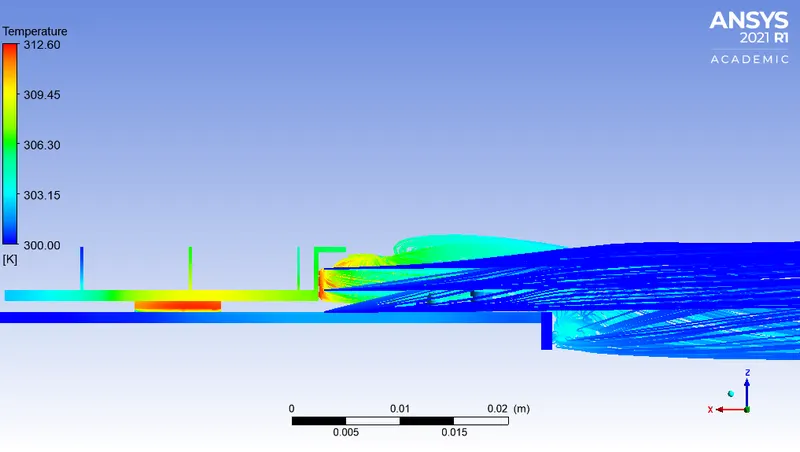
a) Side View:
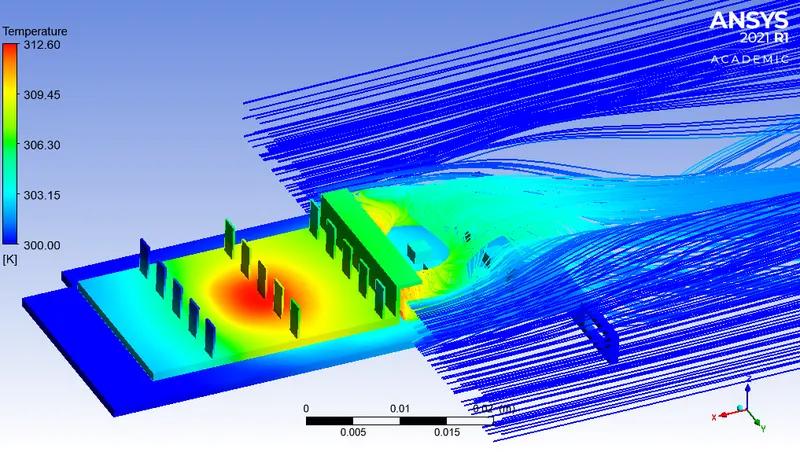
b) Isometric View:
Observation Table:
| Cases | Air Velocity (`m/s`) | Maximum Air Temperature (K) |
| Case 1 | 1 | 335.447 |
| Case 2 | 3 | 317.527 |
| Case 3 | 5 | 312.604 |
Technical Discussion:
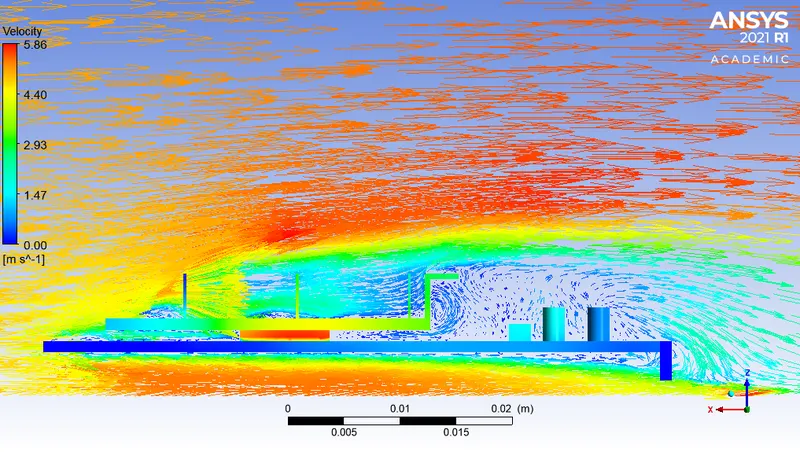
The air flow past the extended surface has a direct impact on the heating of the other components. In case 1, the maximum temperature attained by air is 335.447 K which is slight less than the fin temperature. It infers that the most of the heat dissipated through the fin is absorbed by the air moving past to it. However attainment of the steady-state condition infers that the fin temperature will be constant throughout time advancement. As a part of transient study all the three cases has a common datum of heat generation but varies with rate of heat dissipation. This results in different steady state results of these three cases. It is better to have reduced temperature at the fins surface which will avoid heating of the electronic components through flowing air. This unexpected heating of the components will deteriorate the system performance. The electronic components needs to be placed far away from the heated air or induced air must have higher velocities to maintain reduced temperatures. The turbulence resulted at the end of graphic card again contribute to turbulent kinetic energy due momentum and energy transfer through eddies. For efficient heat transfer the processor should be placed at the end of the system and air past flowing it must be directly expelled to the surrounding (away from the system components).
Conclusion:
The steady-state CHT analysis over a graphic card obtained interesting results. The heat transfer coeffcient is increased at higher velocities which results into `h_(case 3)>h_(case 2)>h_(case 1)`. Proportionally the heat dissipation is increased which leads to efficient cooling of the graphic card. In addition to it, air flow past the extended surface is responsible for undesirable heating of the electronic components which can damage system functioning. This cause is serious with reduced velocities as the temperature of the air is maximum in the re-circulation region which heats the components in its flow path. The design of the graphic card expects further improvement for the location of the system components. At increased velocities, air possess higher momentum and the temperature of air is also reduced which inhibits unexpected heating of the system components. The numerical set-up with higher velocity i.e (Case 3, Velocity = 5`m/s`) proves to be efficient for heat dissipation and maintains the processor temperature as low as possible (313.3992 K (approx `40^0c` ) for wholesome operating conditions.
References:
1. Thermal characteristics of a graphic card.
2. Material properties
https://www.engineersedge.com/heat_transfer/thermal_properties_of_nonmetals_13967.htm