Week 6 - CHT Analysis on a Graphics card
I. Objectives:
- To perform a steady-state conjugate heat transfer analysis on a model of a graphics card using appropriate materials for the simulation and properly define the correct solid and fluid zones.
- To run the simulation for best possible mesh with combination of coarse and refined mesh in different regions and explain the reason for choosing the particular mesh settings.
- Run the simulation by varying the velocity from 1m/sec to 5m/sec for at least 3 velocities and discuss the results.
- Find out the maximum temperature and heat transfer coefficient attained by the processor.
- Prove that the simulation has achieved convergence with appropriate images and plots.
- Identify potential hotspots on the model.
II. Introduction:
A graphics card is an expansion card which generates a feed of output images to a display device (such as a computer monitor).
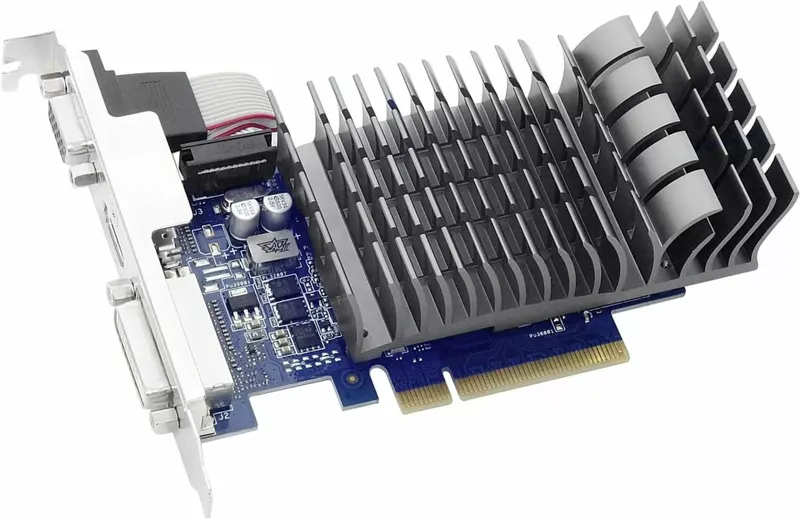
A computer's CPU works by either enabling electric signals to pass through its microscopic transistors or by blocking them. As electricity passes through the CPU or gets blocked inside, it gets turned into heat energy. While a processor in a high-performance workstation may run hot due to heavy use, a processor in a regular computer that overheats is almost always a sign of a malfunctioning system.
Computer cooling is required to remove the waste heat produced by computer components, to keep components within permissible operating temperature limits. Components that are susceptible to temporary malfunction or permanent failure if overheated include integrated circuits such as central processing units (CPUs), chipsets, graphics cards, and hard disk drives.
Components are often designed to generate as little heat as possible, and computers and operating systems may be designed to reduce power consumption and consequent heating according to workload, but more heat may still be produced than can be removed without attention to cooling. Use of heatsinks cooled by airflow reduces the temperature rise produced by a given amount of heat. Attention to patterns of airflow can prevent the development of hotspots. Computer fans are widely used along with heatsinks to reduce temperature by actively exhausting hot air. There are also more exotic cooling techniques, such as liquid cooling.
[2] A handful of components inside a computer account for most of the heat it produces. In desktop PCs, the microprocessor gets its own fan. By themselves, these chips generate from a few watts of heat to nearly 100 watts, depending on the device and application. The graphics processor, a separate calculating chip, also generates considerable heat. The computer's screen is another major heat-producer, putting out as much as 50 watts for larger models.
Heat Transfer is known as the flow of thermal energy from one region to another region occupied by any matter (solids and fluids) where the rate of heat transfer is proportional to the temperature difference between the regions/matter. Conjugate heat transfer (CHT) is used to describe the variation of temperature between the solids and fluids due to the exchange of thermal energy between them.
III. Geometry:
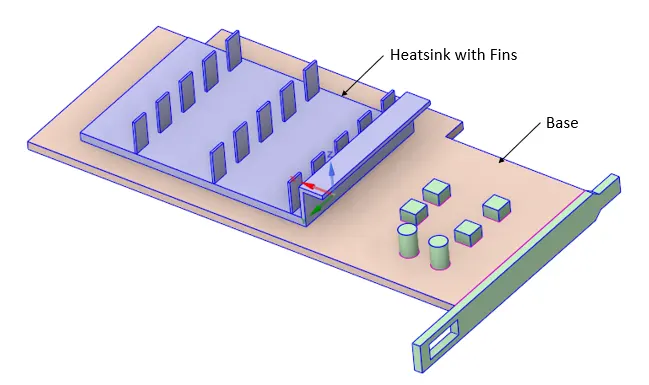
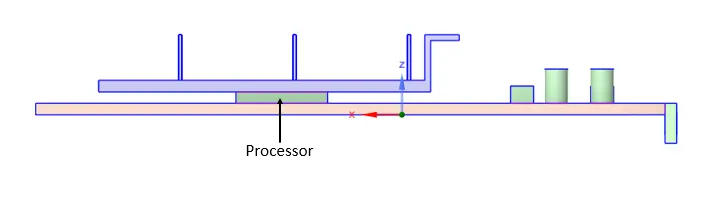
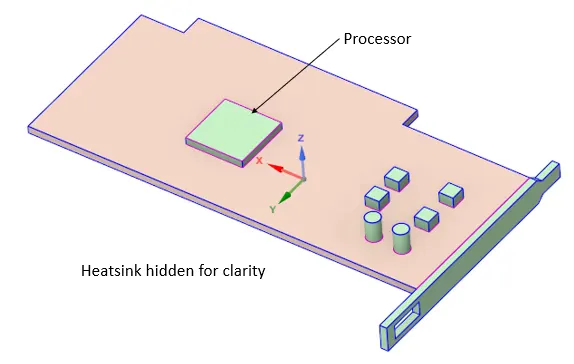
Graphics card's model is simplified with three major components Base, Heat sink with fins and Processor as shown in above images, to perform a steady-state conjugate heat transfer analysis.
Enclosure created around the Graphic card model to capture fluid flow around it effectively.
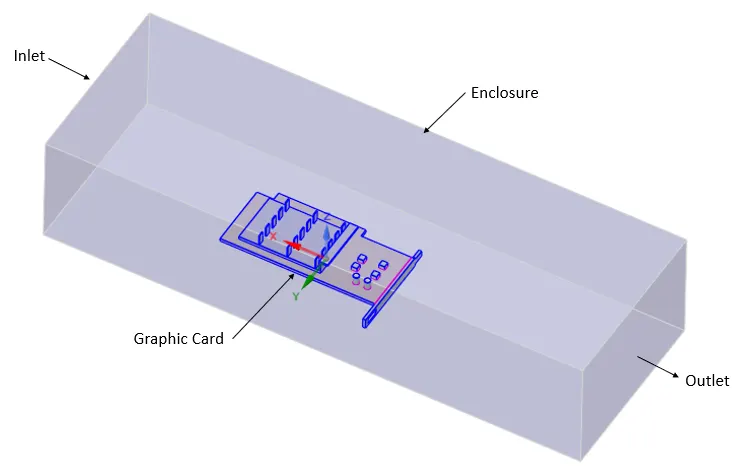
Share topology is enabled. SpaceClaim can share topology (face, edge, and vertex connections) between touching or intersecting bodies and surfaces in designs that are transferred to ANSYS.
Shared topology is the only way to achieve a conformal mesh where bodies meet, and is the only way to be certain that the intersection of bodies is meshed perfectly.
Same Geometry is used for all cases.
Case 1: Simulation at Inlet Velocity 1 m/s with mesh grid independence test.
Grid Independence Test and its significance:
A CFD simulation can never be trusted unless we check whether the result depends on the grid or not, or else we have any experimental data. The output result of a coarser mesh and finer mesh can neither be the same. So up to what extent, we need to vary the mesh to get the accepted level of tolerance, can be found out from Grid Independence test.
This is done by varying mesh size from coarse to fine and checking the output result of each mesh. When varying the mesh does not affect the result much then we can stop and select that minimum mesh size for our final solution attempt.
Grid dependency test is performed with multiple attempts (by refining mesh using local mesh refinement techniques).
Case 1A: Simulation at Inlet Velocity 1 m/s with baseline mesh size 5 mm without any refinements.
1A.1 Meshing Details:
- Mesh Type: Tetrahedral
- Element Size: 5 mm
> Mesh Statistics:
- Nodes: 18816
- Number of Elements: 98547
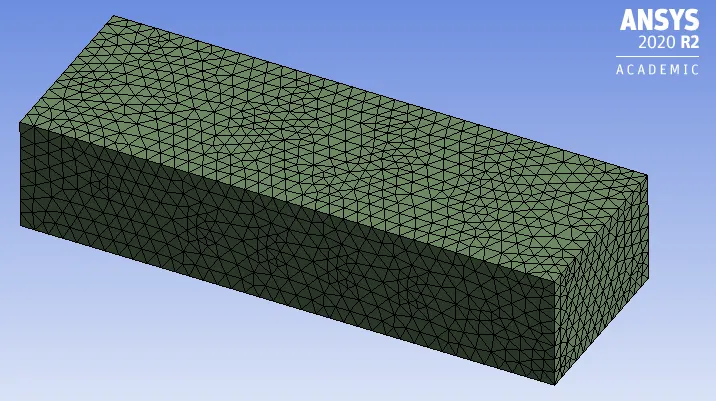
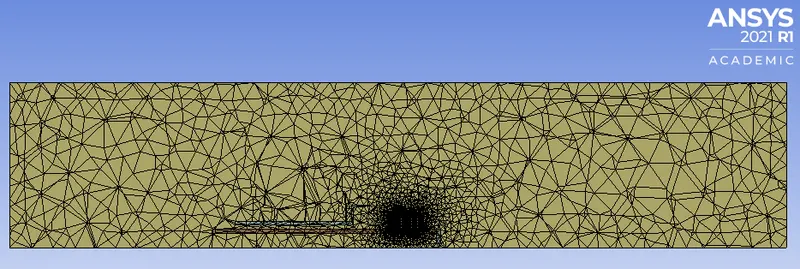

Section Views for Mesh Clarity
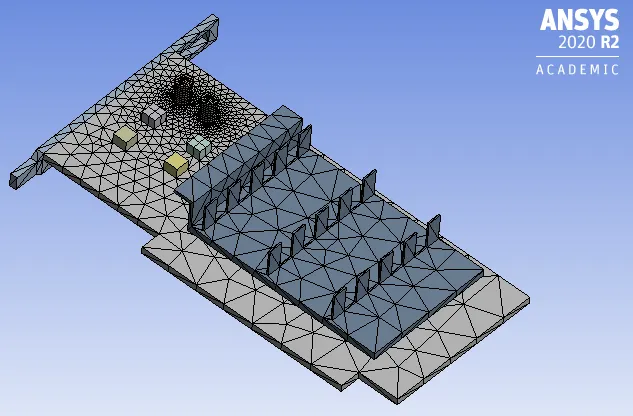
Enclosure hidden for clarity
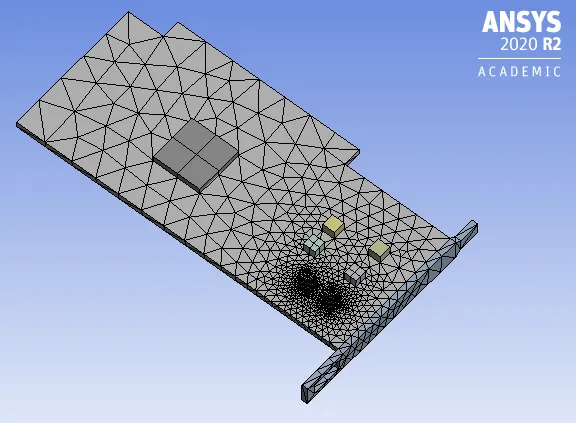
Enclosure and Heatsink hidden for clarity
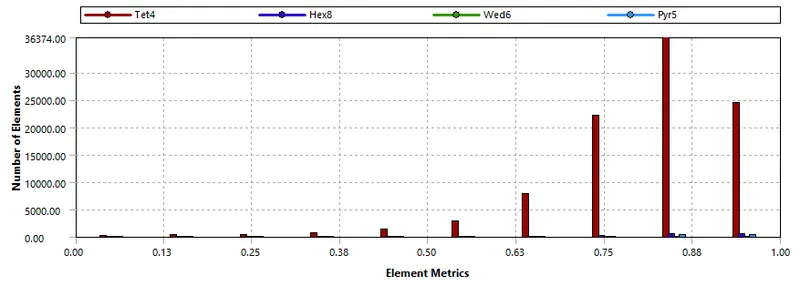
1A.2 Setup:
- General:
- Solver Type: Pressure Based
- Solver Time: Steady
- Velocity Formulation: Absolute
- Models:
- Energy equation turned on.
- Viscous Model: k-omega (2 eqn)
- k-omega Model: SST
- Materials:
> Fluid: Air
> Solid:
To simplify the problem and meet the objectives, only major components of the graphic card and their extensive materials are considered [15].
[4] Heat sinks are made from good thermal conductors such as copper or aluminium alloy. Copper is significantly heavier and more expensive than aluminium but it is also roughly twice as efficient. Hence copper is assigned as the material for heatsink.
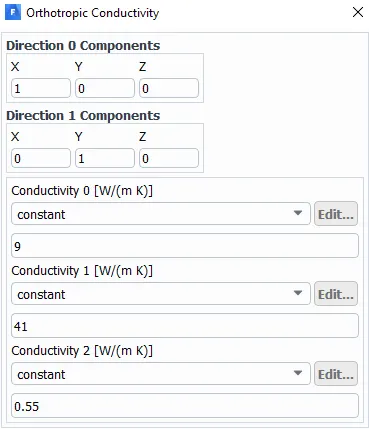
[9] The Base of the graphic card is PCB (Printed Circuit Board) and has orthotropic conductivity. Typically, PCB consists of Circuit Layer, Insulating Layer and Base Layer made of different elements depending on their applications.
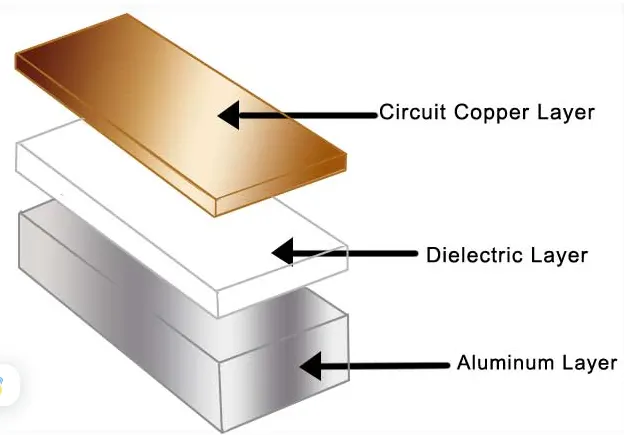
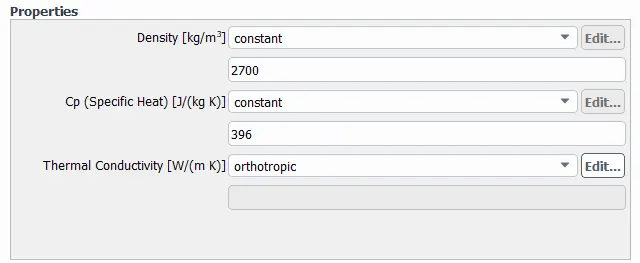
Hence, to avoid complications predefined values of material properties (Density, Specific Heat and Thermal Conductivity) are being considered for PCB referred from [5] Heat Transfer analysis on Chip to PCB carried out by iberisa, for our simulation.
User defined material properties for PCB:
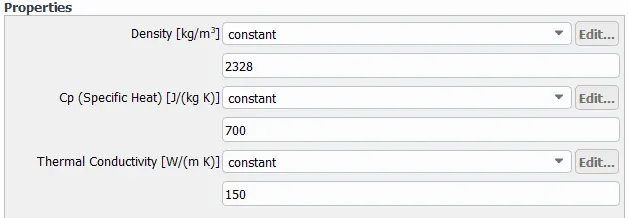
[6] [10] Processors or chips are manufactured primarily from silicon, the second most common element on the planet and some percent of copper, aluminium, plutonium, boron, cobalt, tungsten, plastics etc. Silicon is the primary ingredient in beach sand; however, in that form it isn't pure enough to be used in chips. The manner in which silicon is formed into chips is a lengthy and complicated process. Hence, user defined material properties of Silicon [11][12] is assigned for processor.
User defined material properties for Silicon based Processor or Chip:
- Cell Zone Conditions:
Cell zone condition parameters for each zone along with their respective materials are set. Enclosure is treated as fluid zone. Graphic card and its components are treated as solid zone.
Here the processor or chip is considered to be the source of heat generation.
The volume of model processor is 64 `mm^3`
[2] Chips generate from a few watts of heat to nearly 100 watts, depending on the device and application, referring specifications of various processors [13].
A typical processor has the capacity to withstand temperature [14] of 40C - 95C.
Assuming Source Term value of processor = 2e7 W/`m^3`
- Boundary Conditions:
- Inlet Velocity = 1 m/s
1A.3 Solution:
- Scaled Residuals Plot:
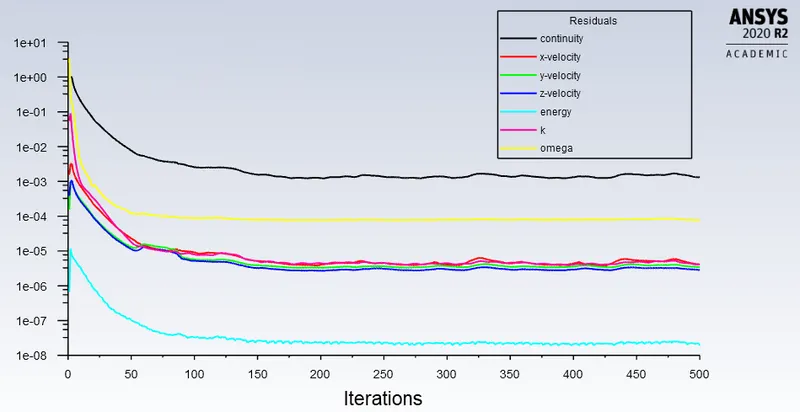
From the above residual plot, it can be seen that the Case 1A simulation has converged.
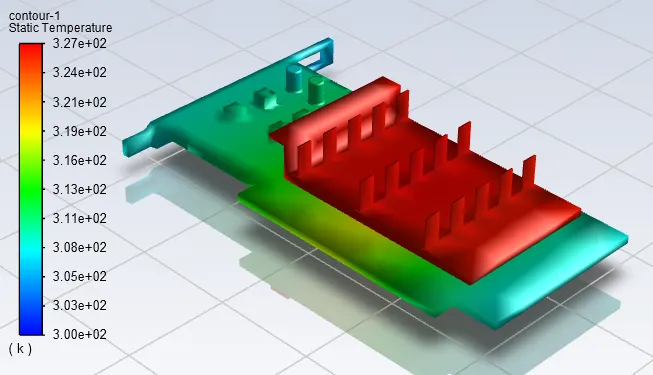
- Static Temperature Contour:
1A.4 Results:
> Temperature Contour Plots (Global):
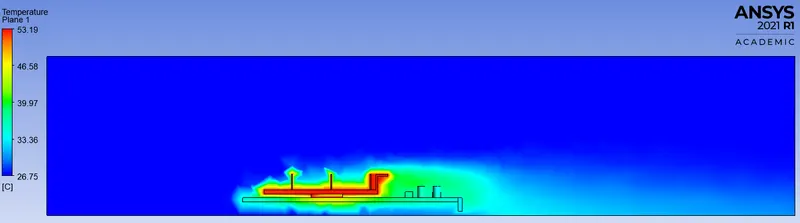
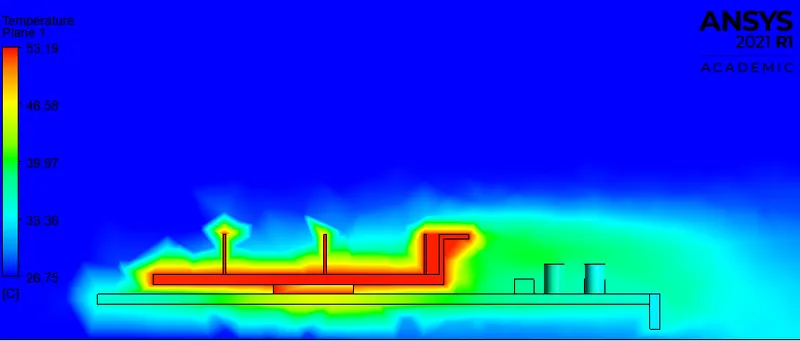
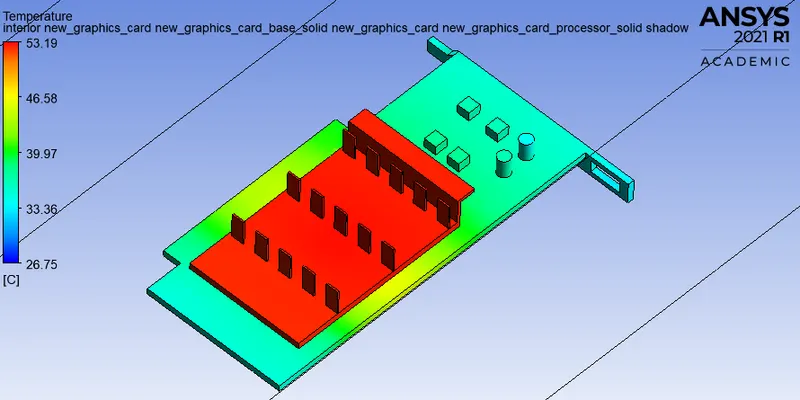
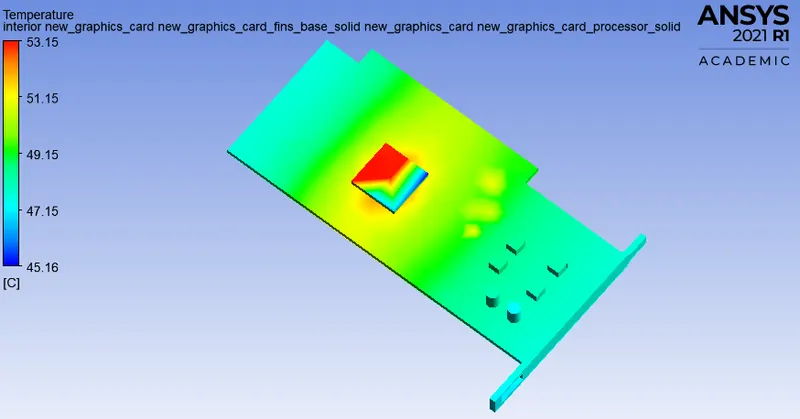
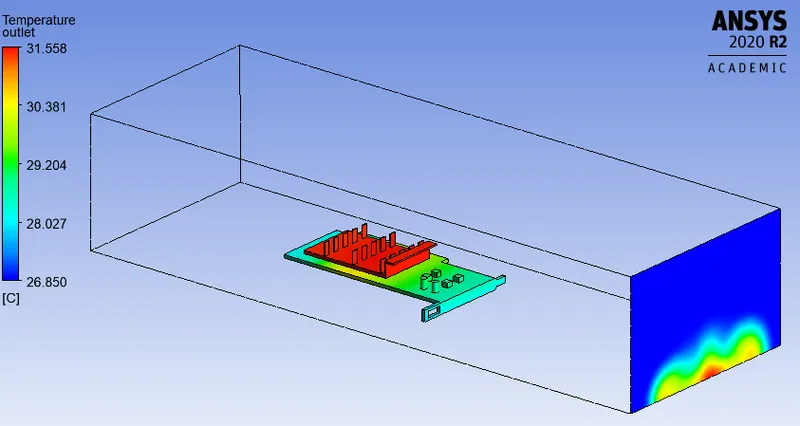
Local range is used in some contours below as it uses only the variable values on the current object at the current time step to set maximum and minimum range values. This option is useful to use the full color range on the object.
Temperature Contour of Processor (Local):
Heat sink hidden for clarity.
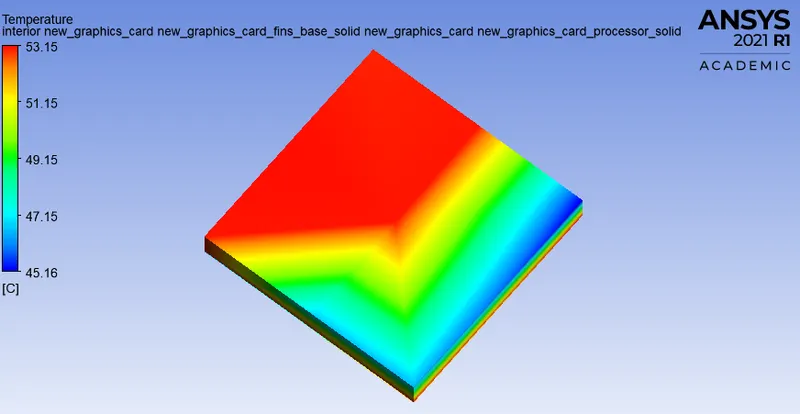
Heat sink and PCB hidden for clarity.
Temperature Contour of PCB Base (Local):
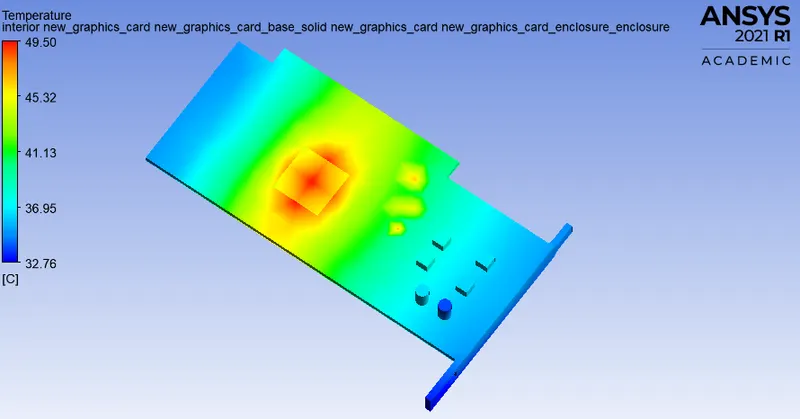
Heat sink and Processor hidden for clarity.
Temperature Contour of Heat Sink (Local):
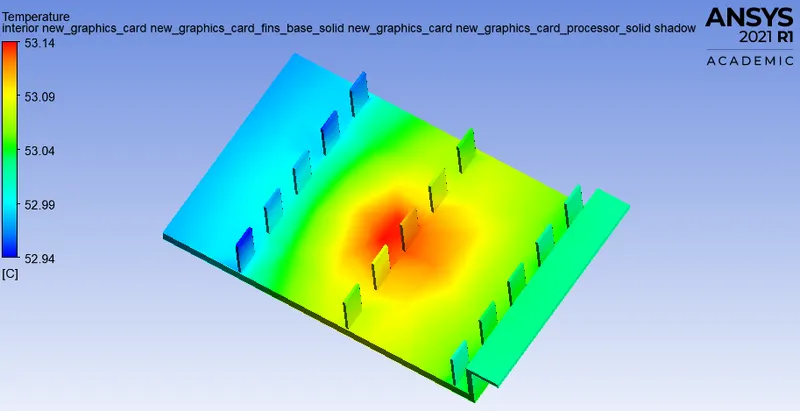
PCB and Processor hidden for clarity.
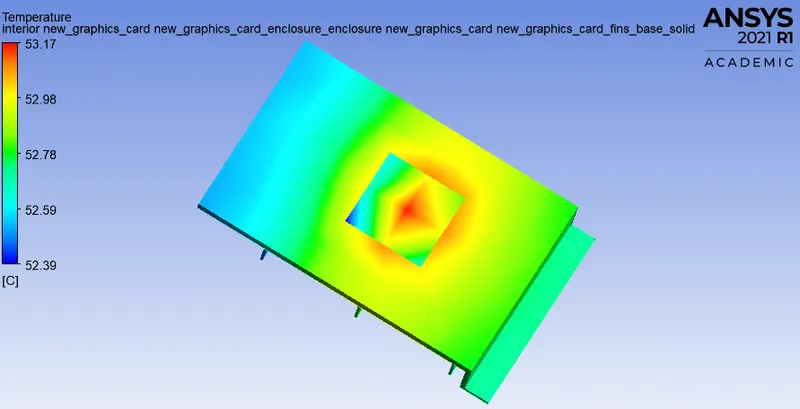
Temperature Contour of Heat Sink Base showcasing Hotspot
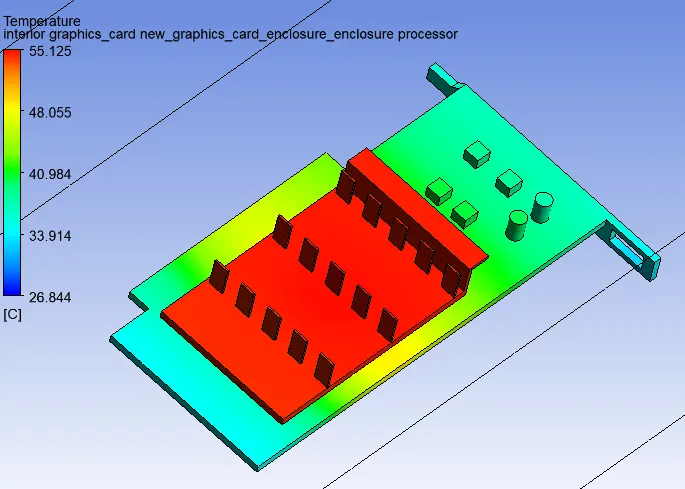
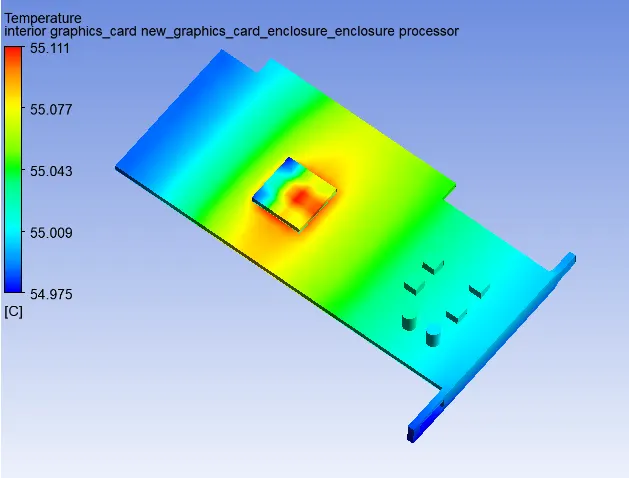
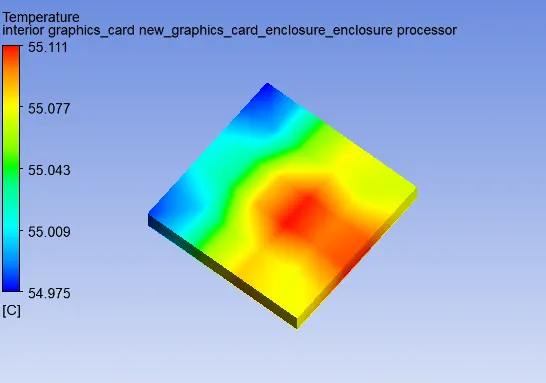
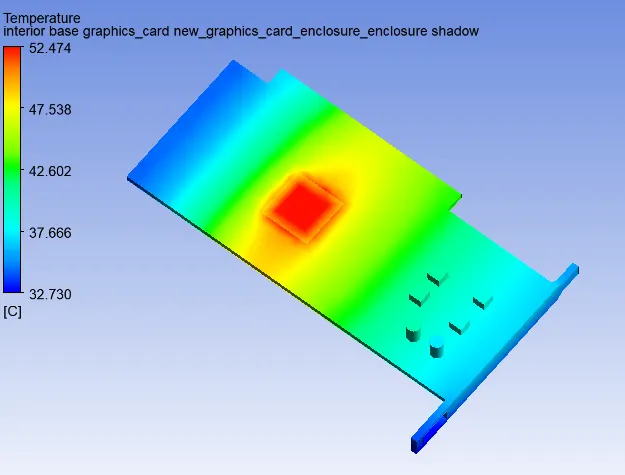
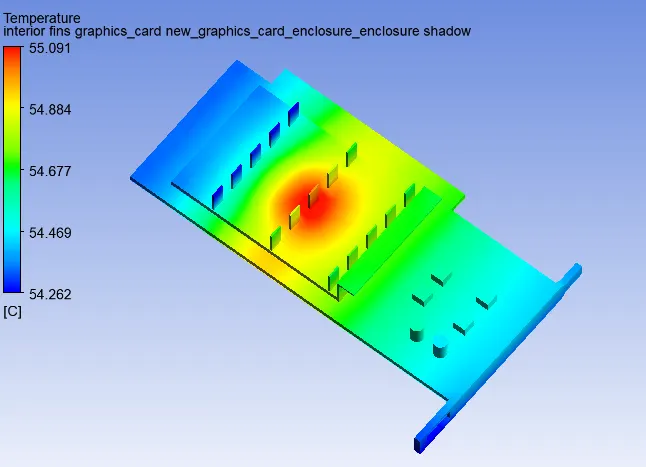
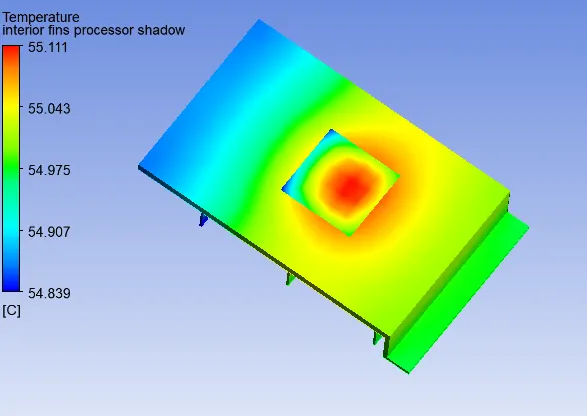
From the above temperature contours, hotspots can be seen on PCB and on heat sink where the chip is in contact, as chip is the heat source. Since the material assumed for heat sink is copper which is an effective metallic conductor, most of heat from the chip is transferred to heatsink. Cooling is further enhanced by computer fan or liquid cooling.
Temperature Contour at Outlet (Local):
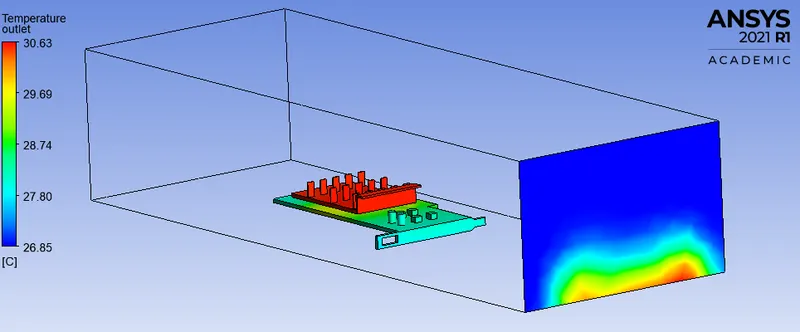
Case 1A Animation of Temperature Contours at Inlet Velocity 1 m/s:
> Velocity Contour Plot:
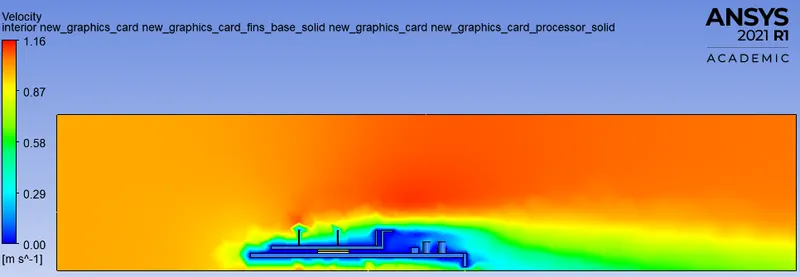
- Wall Heat Transfer Coefficient Contours:
> Wall Heat Transfer Coefficient Contour at Processor Walls:
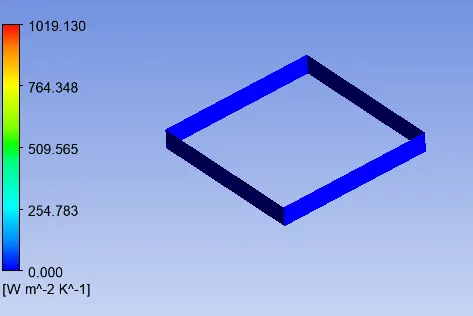
> Wall Heat Transfer Coefficient Contour of Graphic Card with Enclosure at Section XZ Plane:
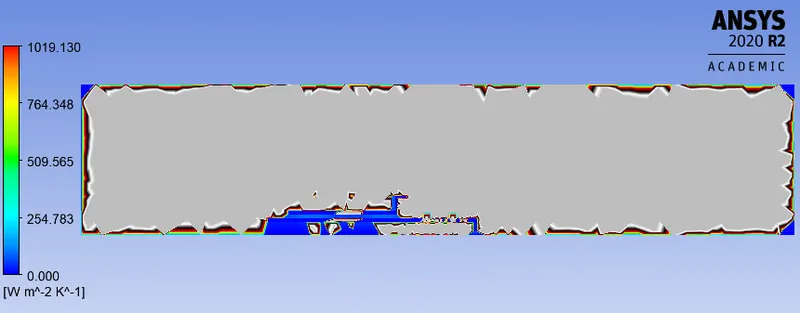
Case 1B: Simulation at Inlet Velocity 1 m/s with refined mesh size 1.6 mm.
1B.1 Meshing Details:
- Mesh Type: Tetrahedral
- Element Size: 1.6 mm
> Mesh Statistics:
- Nodes: 506190
- Number of Elements: 95458
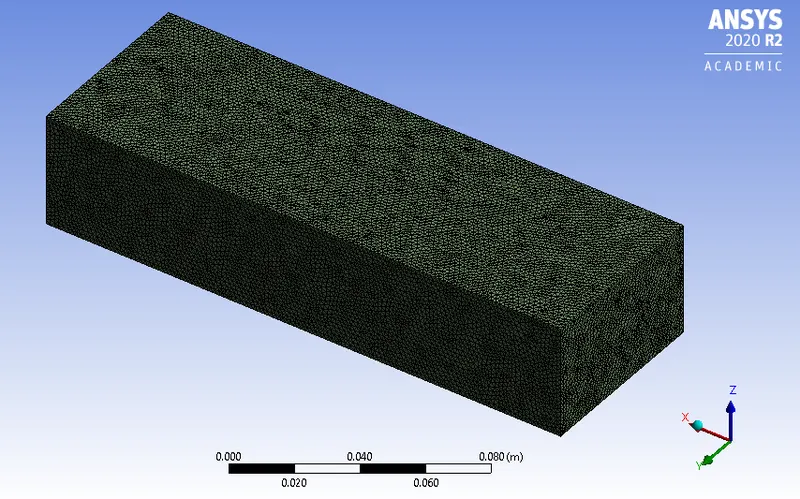
 Section Views for Mesh Clarity
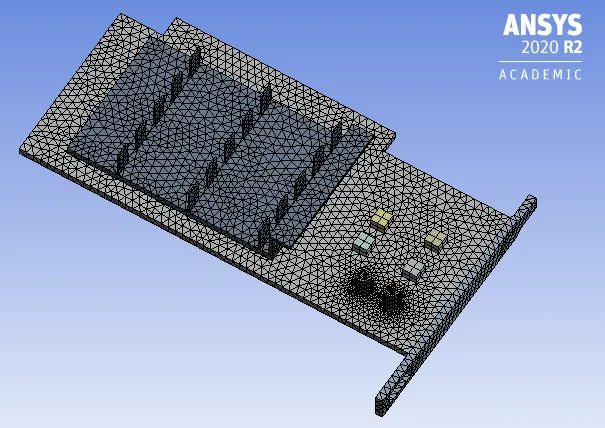
Enclosure hidden for clarity
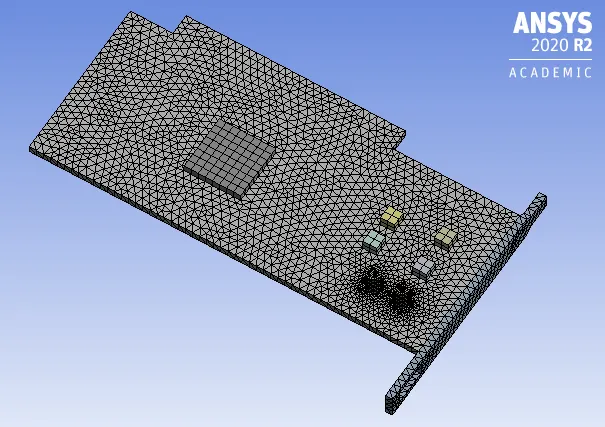
Enclosure and Heatsink hidden for clarity
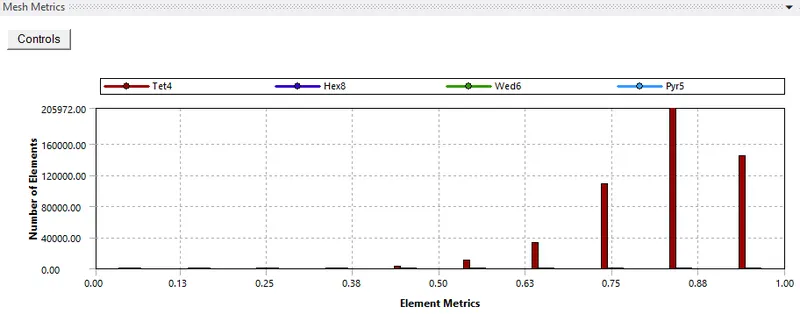 In the above meshing images of Case 1B, it can be seen that the FEA software uses the information to generate an entirely new mesh on its own. Smaller elements are used in regions where the local error is significant, and the local error throughout the model is considered. The advantage here is that the software will do all of the mesh refinement.
Since academic version of Ansys is being used here, it is limited to cases with only 512000 cells and cannot exceed above 512000 cells while meshing.

1B.2 Setup:
- Boundary Conditions:
- Inlet Velocity = 1 m/s
The other set up conditions are maintained same as Case 1A for Case 1B.
1B.3 Solution:
- Scaled Residuals Plot:
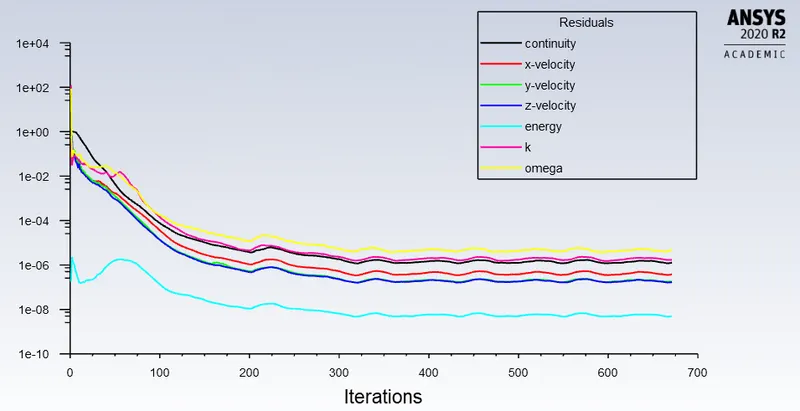
From the above residual plot, it can be seen that the Case 1B simulation has converged.
- Static Temperature Contour:
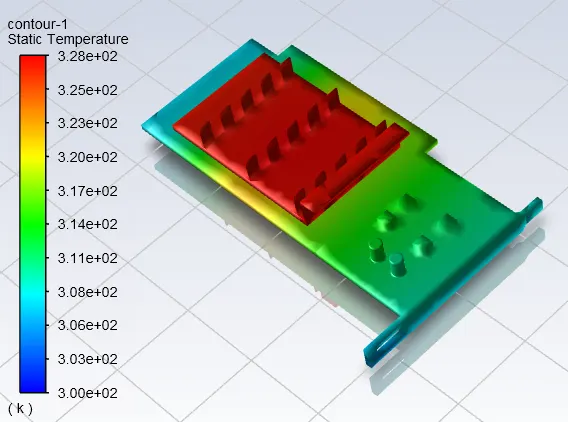
1B.4 Results:
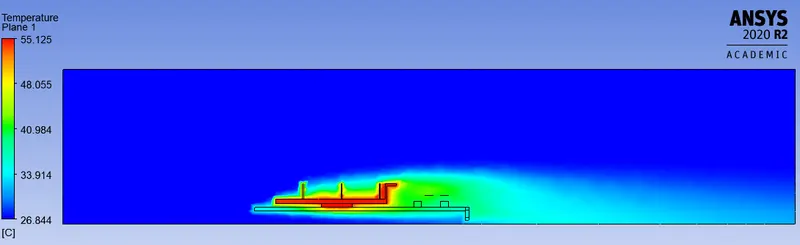
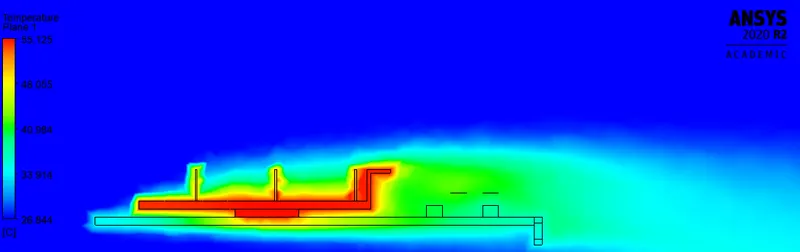
> Temperature Contour Plots (Global):
Temperature Contour of Processor (Local):
Heat sink hidden for clarity.
Heat sink and PCB hidden for clarity.
Temperature Contour of PCB Base (Local):
Heat sink and Processor hidden for clarity.
Temperature Contour of Heat Sink (Local):
Temperature Contour of Heat Sink Base showcasing Hotspot
Temperature Contour at Outlet (Local):
> Velocity Contour Plot:
- Wall Heat Transfer Coefficient Contours:
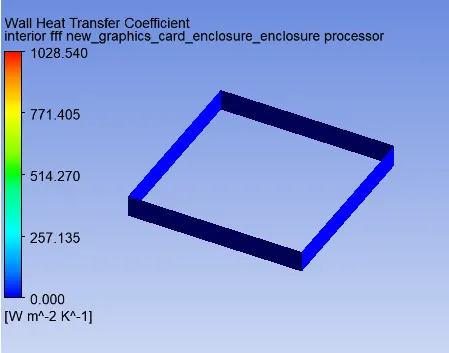
> Wall Heat Transfer Coefficient Contour at Processor Walls:
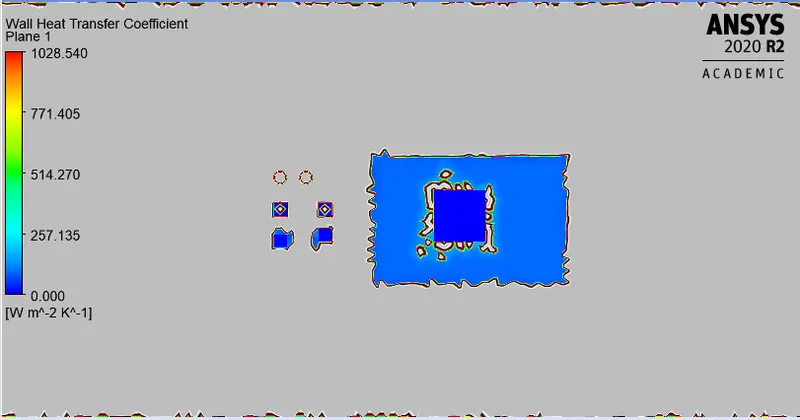
> Wall Heat Transfer Coefficient Contour of Processor at Section XY Plane:
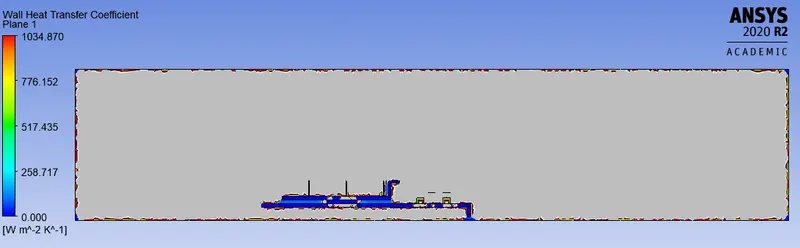
> Wall Heat Transfer Coefficient Contour of Graphic Card with Enclosure at Section XZ Plane:
1.2 Observations from Case 1A and Case 1B Simulations:
From the above mesh grid independence test performed following can be observed:
- The accuracy of all result parameters is enhanced in Case 1B due to mesh refinement.
- Better quality contours are obtained in Case 1B than Case 1A at same velocity.
- Computation time in Case 1B is comparatively higher than in Case 1A, as mesh is refined further. This might not be economical at certain cases.
Since accurate results and good quality contours are obtained in Case 1B from mesh grid independence test, simulation for further cases is performed with finer mesh size 1.6 mm.
Case 2: Simulation at Inlet Velocity 3 m/s with finer mesh size 1.6 mm.
2.1 Meshing Details: Meshing factors are maintained same as Case 1B for Case 2.
2.2 Setup:
- Boundary Conditions:
- Inlet Velocity = 3 m/s
The other set up conditions are maintained same as Case 1A for Case 2.
2.3 Solution:
- Scaled Residuals Plot:
From the above residual plot, it can be observed that the simulation has converged.
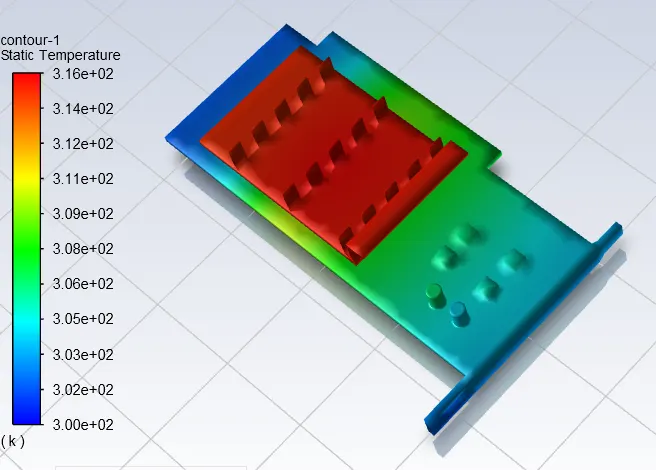
- Static Temperature Contour:
2.4 Results:
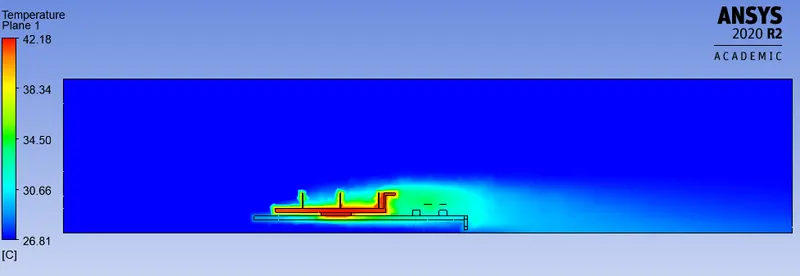
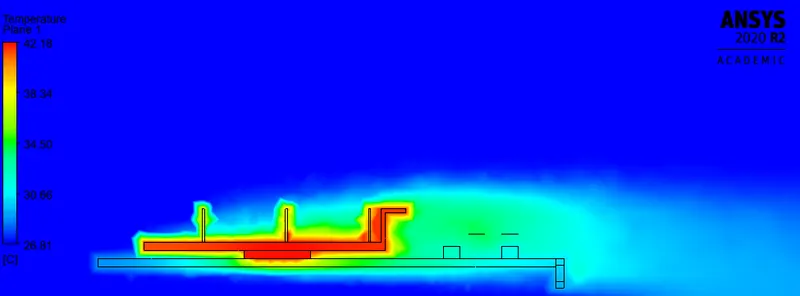
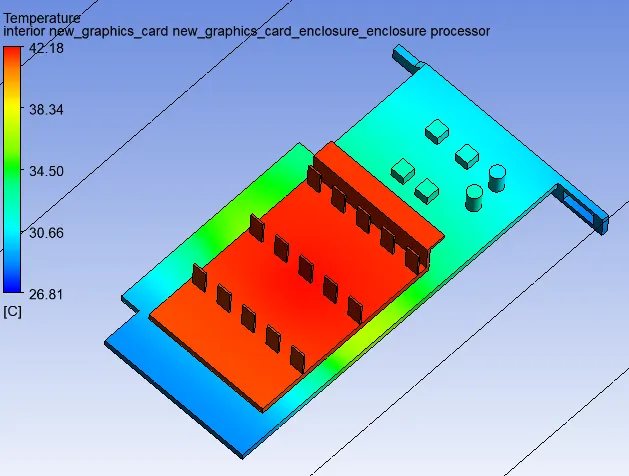
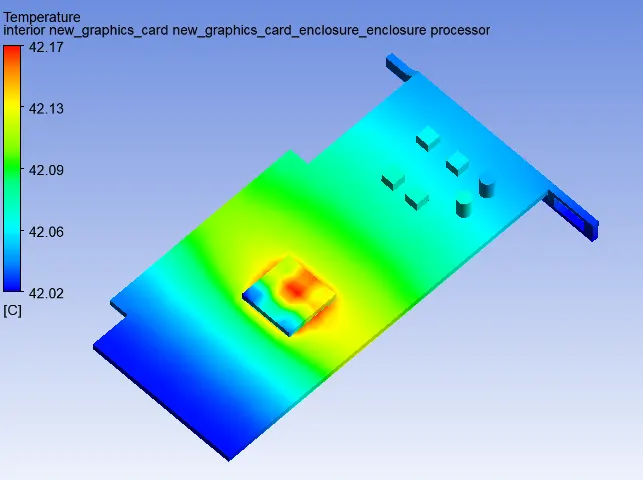
> Temperature Contour Plots (Global):
Temperature Contour of Processor (Local):
Heat sink hidden for clarity.
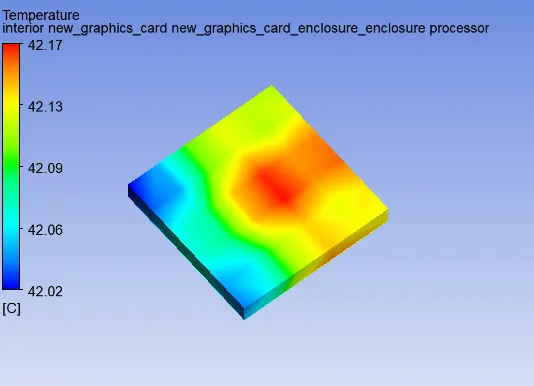
Heat sink and PCB hidden for clarity.
Temperature Contour of PCB Base (Local):
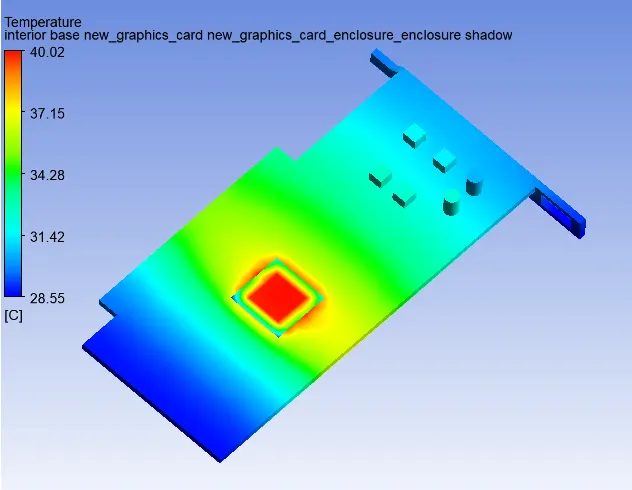
Heat sink and Processor hidden for clarity.
Temperature Contour of Heat Sink (Local):
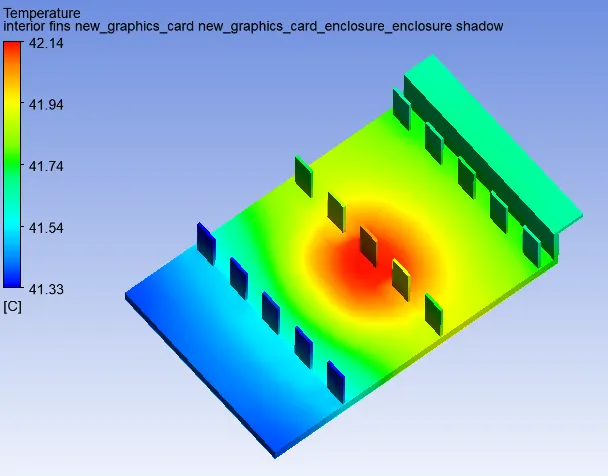
PCB and Processor hidden for clarity.
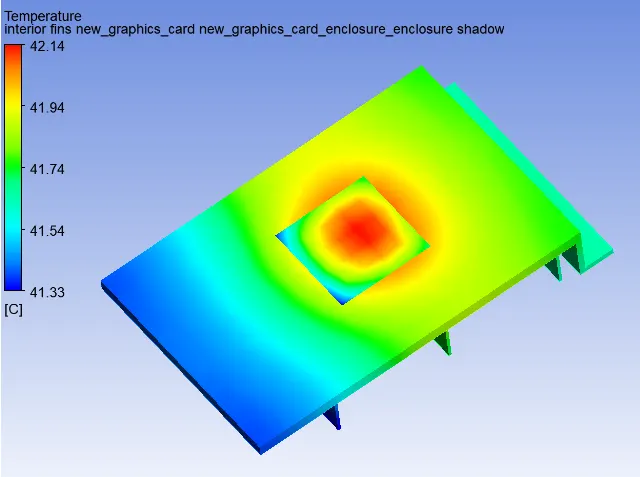
Temperature Contour of Heat Sink Base showcasing Hotspot
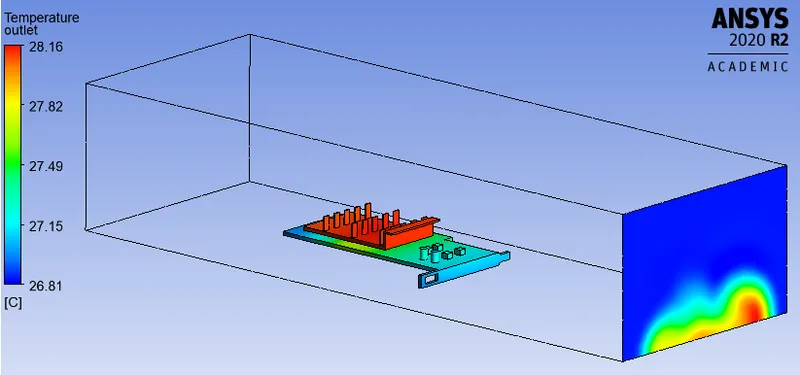
Temperature Contour at Outlet (Local):
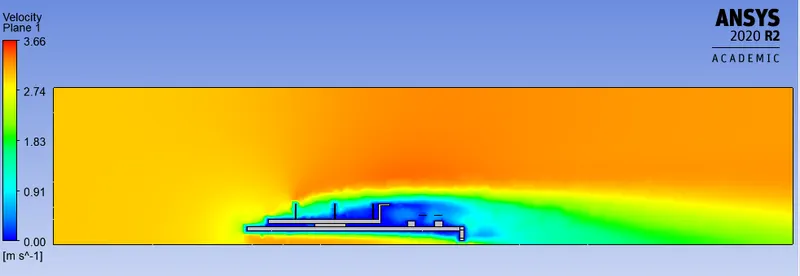
> Velocity Contour Plot:
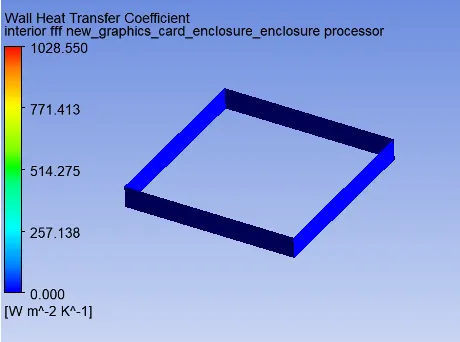
- Wall Heat Transfer Coefficient Contours:
> Wall Heat Transfer Coefficient Contour at Processor Walls:
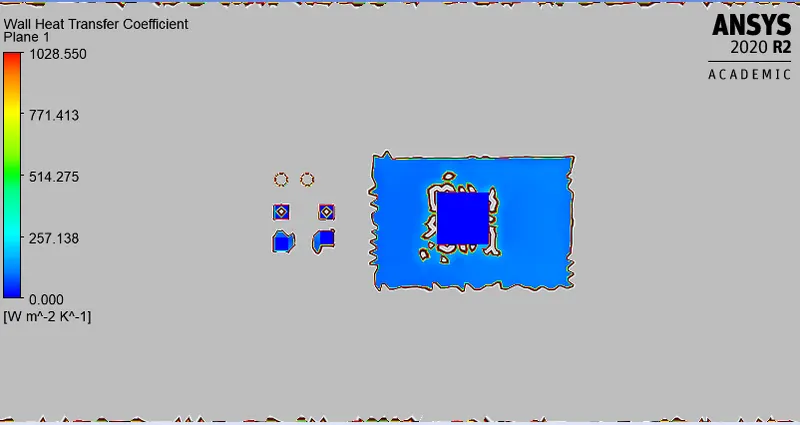
> Wall Heat Transfer Coefficient Contour of Processor at Section XY Plane:
> Wall Heat Transfer Coefficient Contour of Graphic Card with Enclosure at Section XZ Plane:
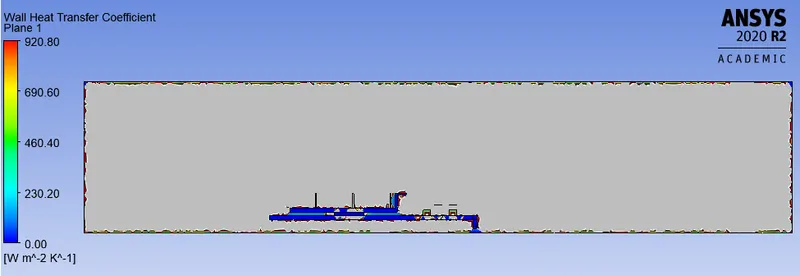
Case 3: Simulation at Inlet Velocity 5 m/s with finer mesh size 1.6 mm.
3.1 Meshing Details: Meshing factors are maintained same as Case 1B for Case 3.
3.2 Setup:
- Boundary Conditions:
- Inlet Velocity = 5 m/s
The other set up conditions are maintained same as Case 1A for Case 3.
3.3 Solution:
- Scaled Residuals Plot:
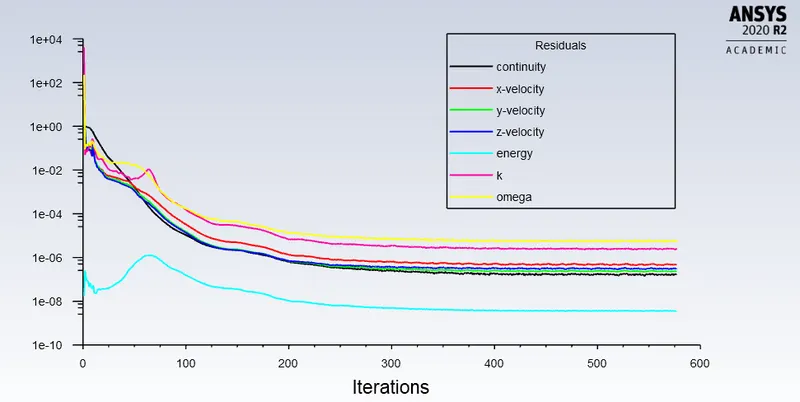
From the above residual plot, it can be observed that the simulation has converged.
- Static Temperature Contour:
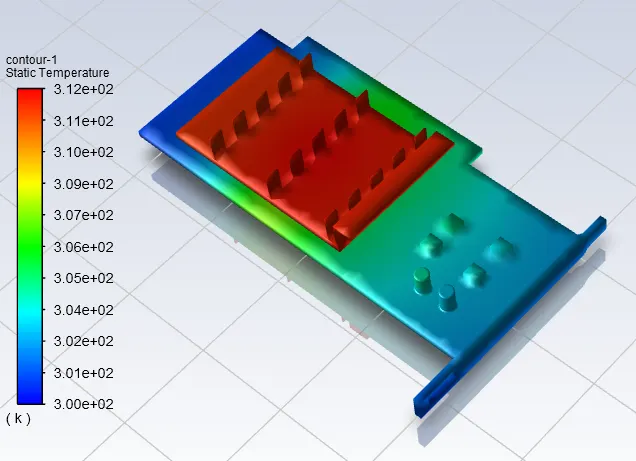
3.4 Results:
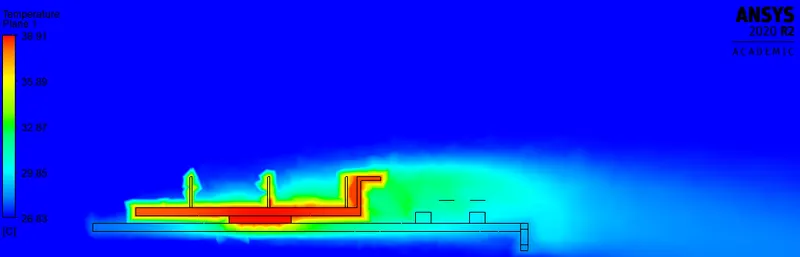
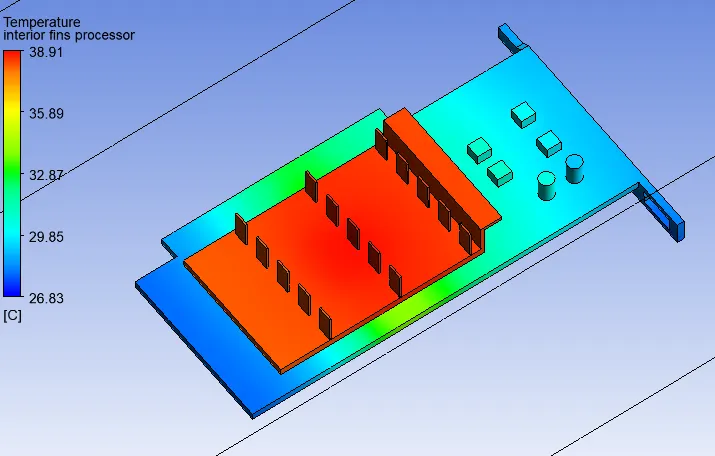
> Temperature Contour Plots (Global):
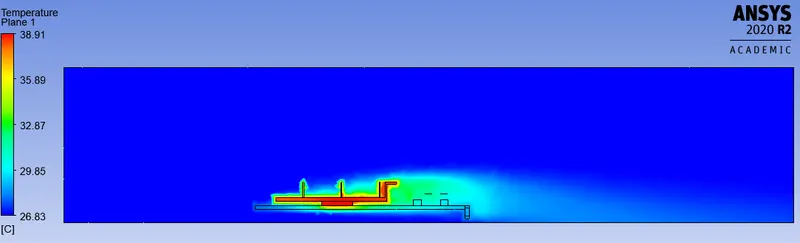
Temperature Contour of Processor (Local):
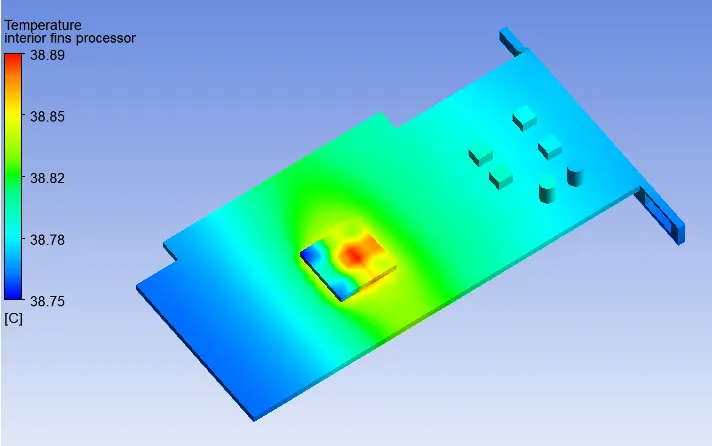
Heat sink hidden for clarity.
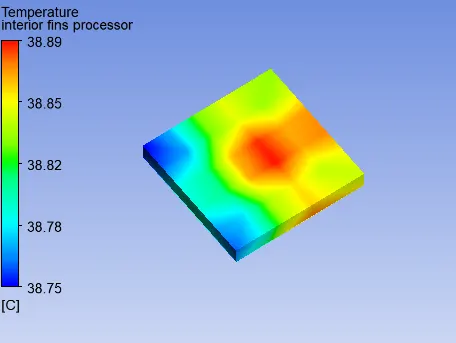
Heat sink and PCB hidden for clarity.
Temperature Contour of PCB Base (Local):
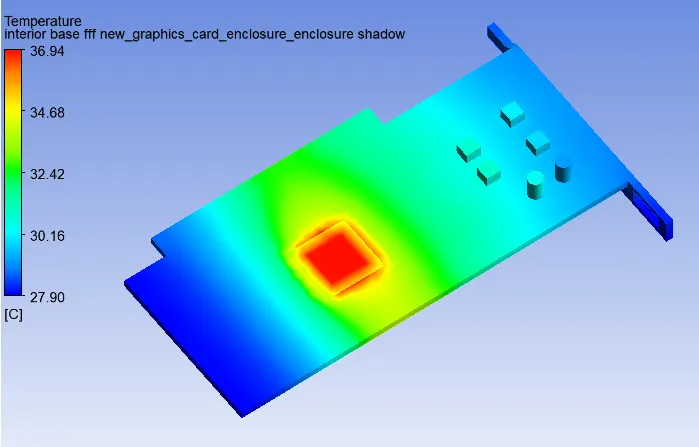
Heat sink and Processor hidden for clarity.
Temperature Contour of Heat Sink (Local):
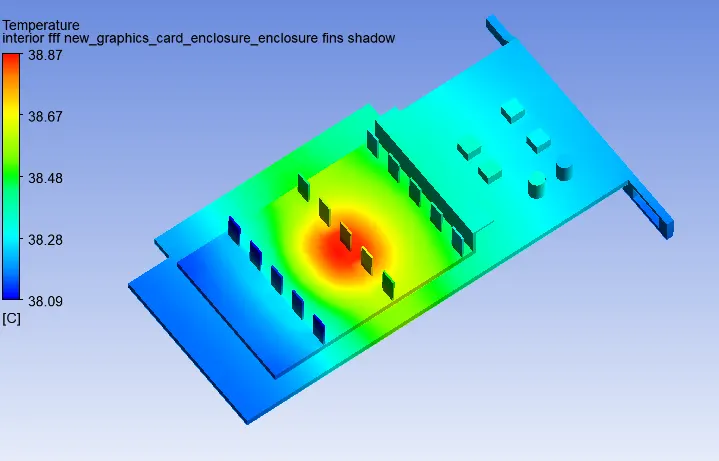
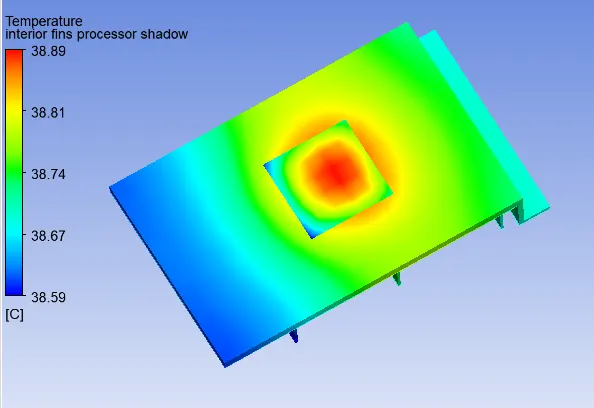
Temperature Contour of Heat Sink Base showcasing Hotspot
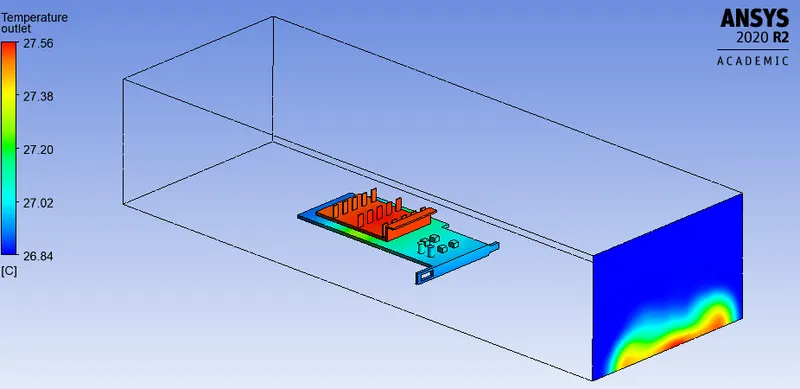
Temperature Contour at Outlet (Local):
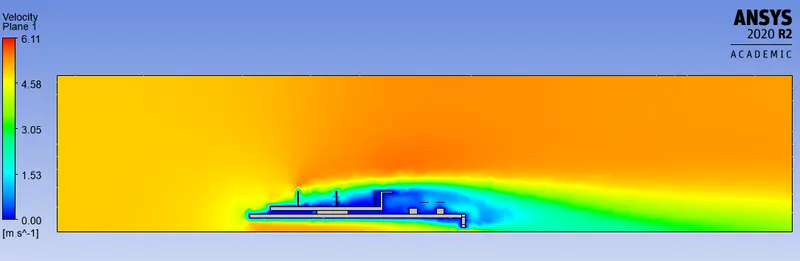
> Velocity Contour Plot:
- Wall Heat Transfer Coefficient Contours:
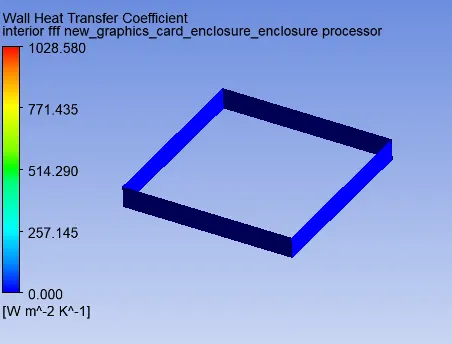
> Wall Heat Transfer Coefficient Contour at Processor Walls:
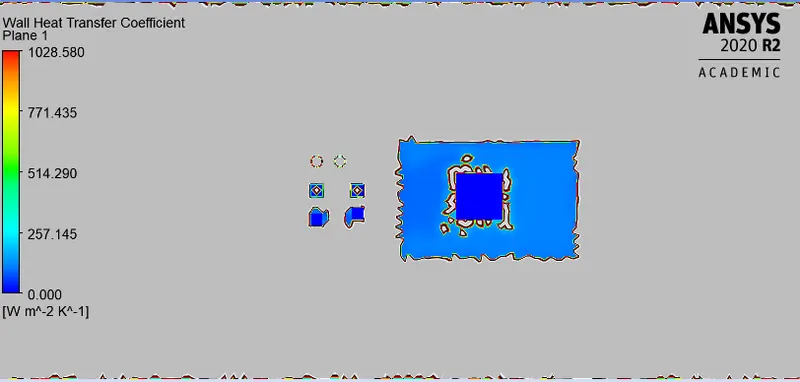
> Wall Heat Transfer Coefficient Contour of Processor at Section XY Plane:
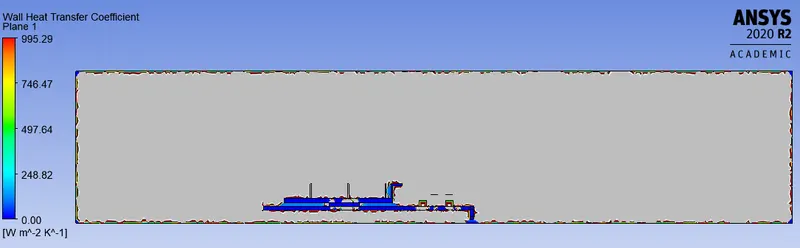
> Wall Heat Transfer Coefficient Contour of Graphic Card with Enclosure at Section XZ Plane:
IV. Inferences:
- Simulations are run at velocities 1m/s, 3m/s and 5m/s at finer mesh size of 1.6mm. Following results are obtained.
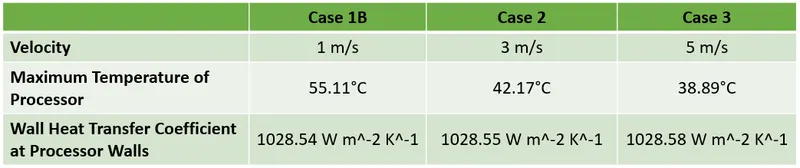
Based on the above results obtained it can be concluded that, as air inlet velocity is increased the temperature of graphic card processor temperature reduces. - Simulation has achieved convergence in all the cases, which is evident from the residual plots shown above in each case.
- From above local temperature plots of processor and PCB in all cases, it can be observed that upper surface of PCB, lower surface of heatsink (where the processor is contact to both heatsink and PCB) and contact surfaces of processor are the potential hotspots on the graphic card model.
- The quality of the contours and results are enhanced in cases 1B, 2 and 3 by refining the mesh from coarser to finer. Accepted level of results are achieved from Grid Independence test.
V. References:
[1] https://en.wikipedia.org/wiki/Video_card#Parts
[3] https://en.wikipedia.org/wiki/Computer_cooling
[4] https://www.ijeit.com/Vol%205/Issue%204/IJEIT1412201510_17.pdf
[5] http://www.iberisa.com/soporte/femap/termico/Heat_Transfer_from_Chip_to_PCB.htm
[6] https://www.engineering.com/story/what-raw-materials-are-used-to-make-hardware-in-computing-devices
[7] https://en.wikipedia.org/wiki/Orthotropic_material
[8] https://skill-lync.com/knowledgebase/conjugate-heat-transfer-cht-shell-conduction
[9] https://www.wellpcb.com/pcb-material.html#anchor-2
[10] https://www.informit.com/articles/article.aspx?p=482324&seqNum=5
[11] https://www.pveducation.org/pvcdrom/materials/general-properties-of-silicon
[12] http://www.ioffe.ru/SVA/NSM/Semicond/Si/thermal.html
[13] https://ark.intel.com/content/www/us/en/ark.html#@PanelLabel122139
[14] https://www.computerhope.com/issues/ch000687.htm
[15] Zambri Harun, Mahir Faris, Eslam Reda. Computational Fluid Dynamics Simulation on the Heat Sink Performance of a Graphics Processing Unit Thermal Management