Week 6 - CHT Analysis on a Graphics card
Aim: To perform a steady-state conjugate heat transfer analysis on a model of a graphics card.
Objective:
- To simulate the velocity by varying from 1m/sec to 5m/sec for at least 3 velocities and to discuss the results.
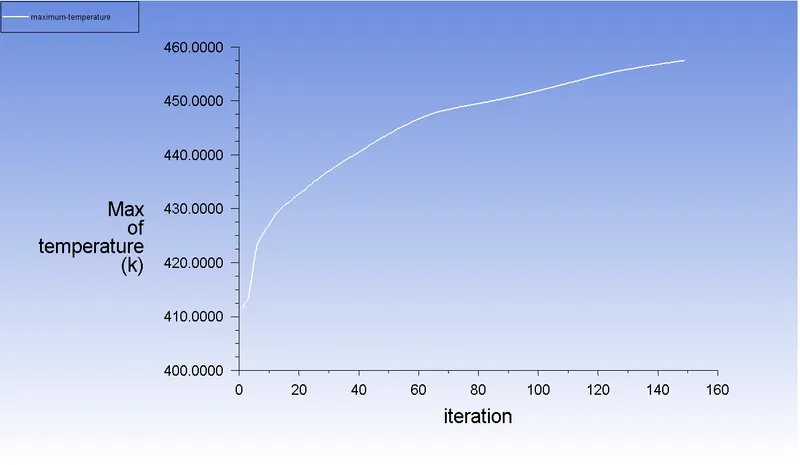
- To find out the maximum temperature and heat transfer coefficient attained by the processor.
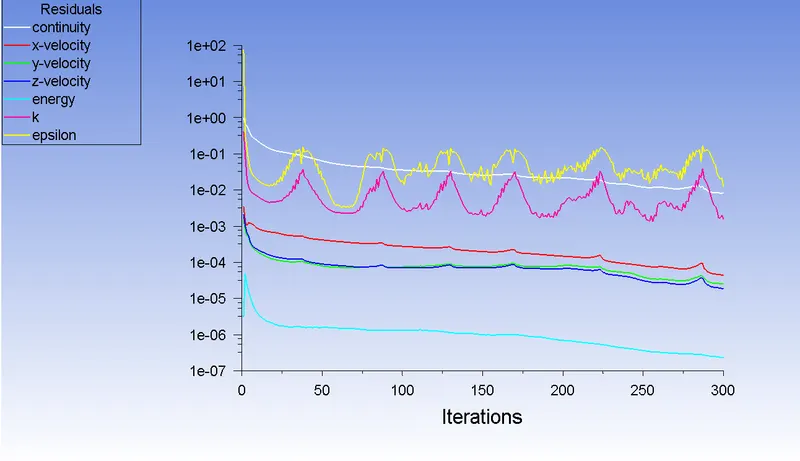
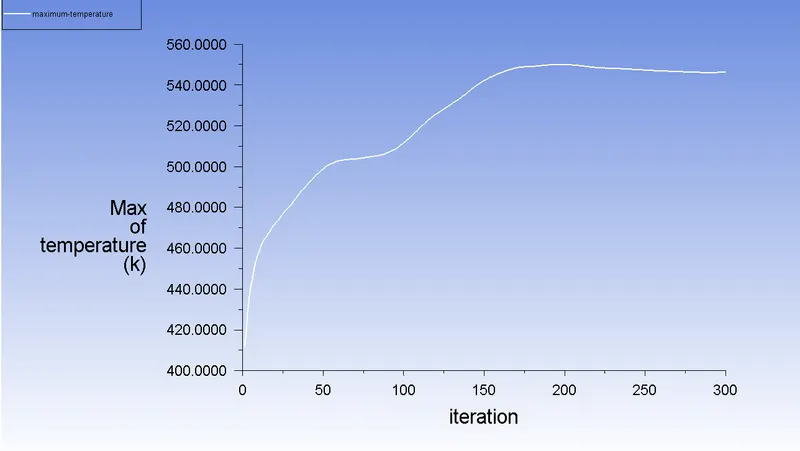
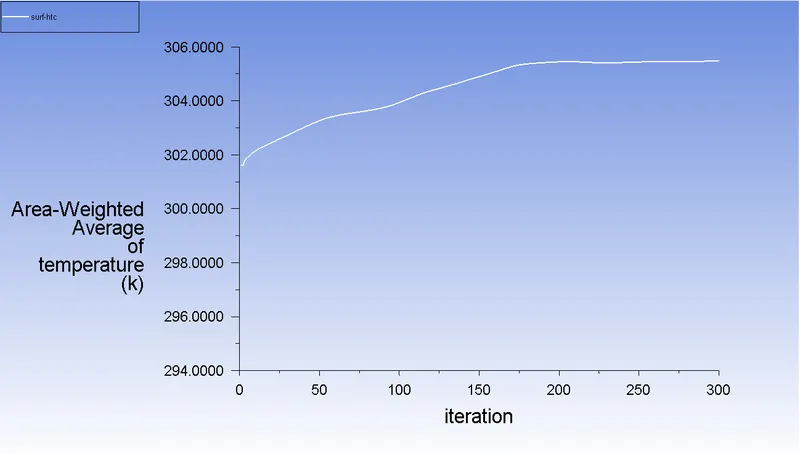
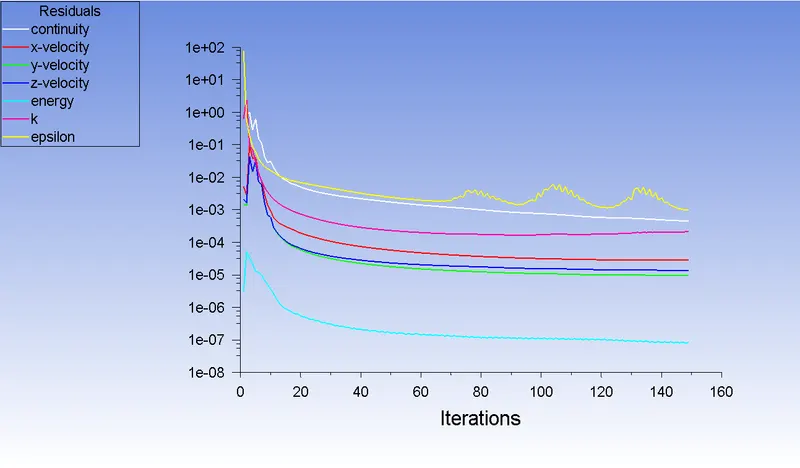
- To prove that the simulation has achieved convergence with appropriate images and plots.
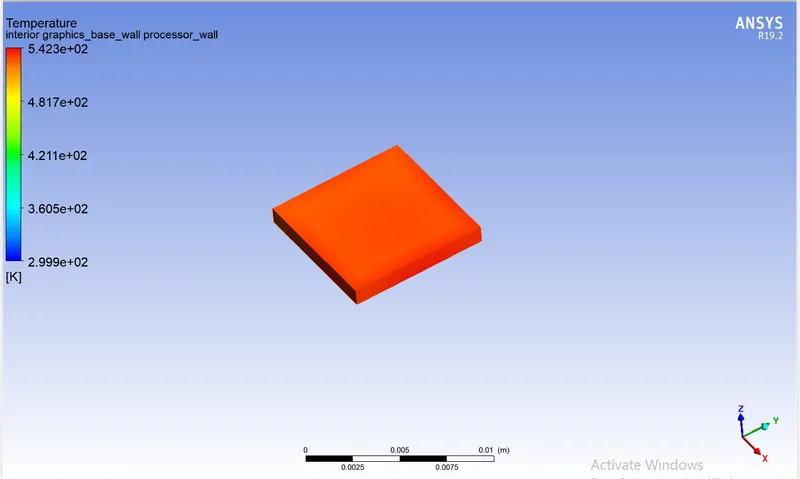
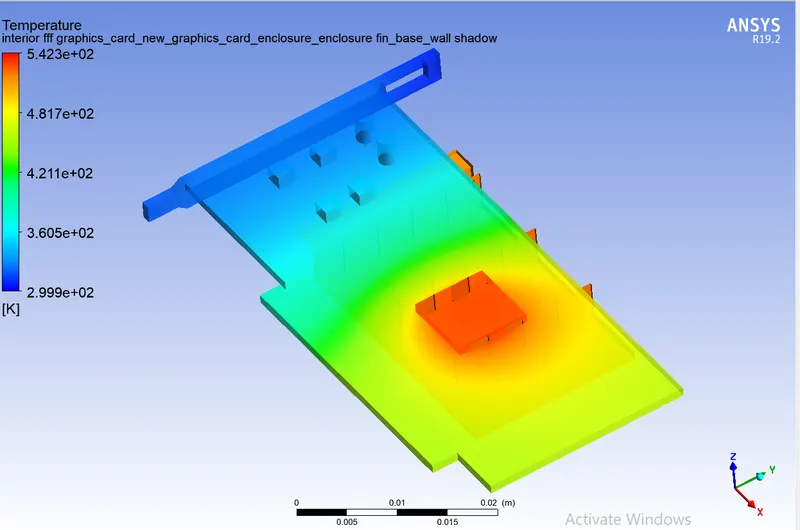
- To identify potential hotspots on the model.
FACTORS ENTAILED:
Conjugate Heat transfer(CHT) :
- By exchanging thermal energy at their interfaces, the conjugate heat transfer analysis type enables the simulation of heat transfer between solid and fluid domains. Common uses for this type of analysis include, but are not limited to, heat exchanger simulation, cooling of electronic equipment, and general-purpose cooling and heating systems.
-
Examples: The internal combustion engine, Heat exchanger, Heat sink, Boiler, Turbocharger etc
Graphics card:
- The graphics card (video card, display card, display adapter) is an expansion card that generates a feed of output images to a display device (such as a computer monitor ). The integrated graphics processor can perform additional processing, removing this task from the central processor of the computer.
Solving & Modelling approach:
GEOMETRY:
- The model of the specified graphics card is open in Spaceclaim. in the enclosure, which. In order to achieve conformal mesh between various components and allow for information sharing between various mesh zones, share topology between the various components must be enabled.
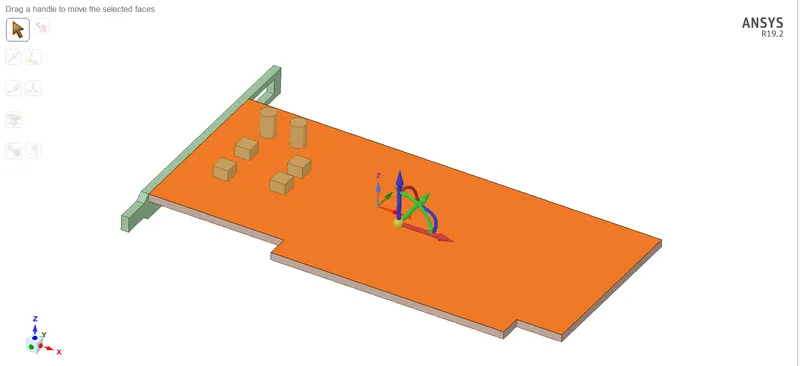
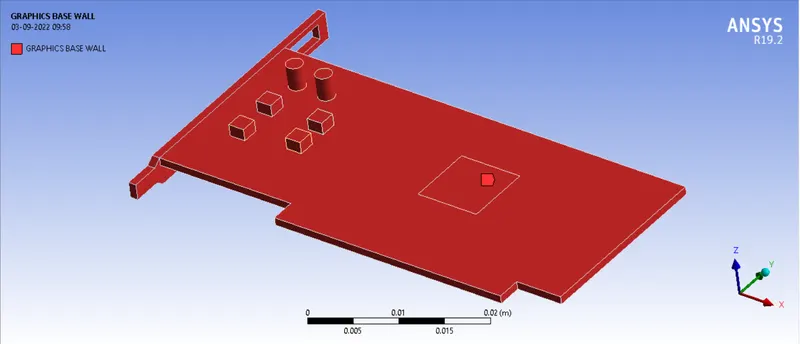
Base:
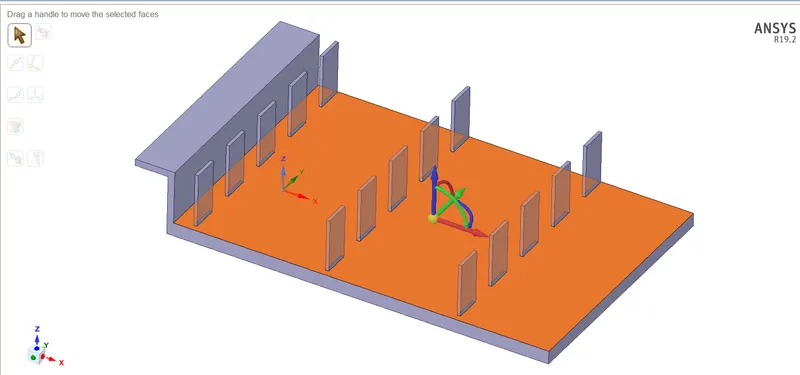
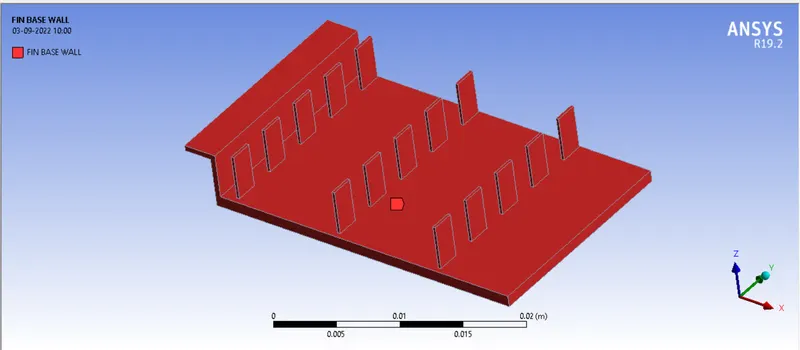
Fins:
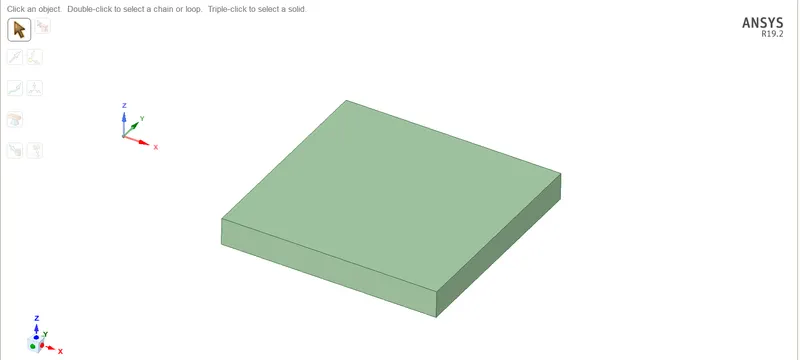
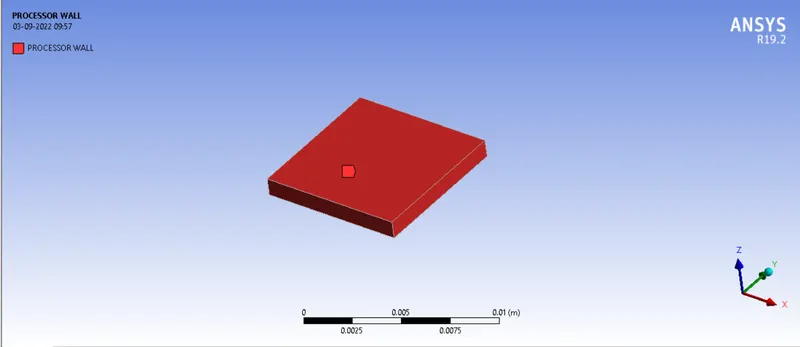
Processor:
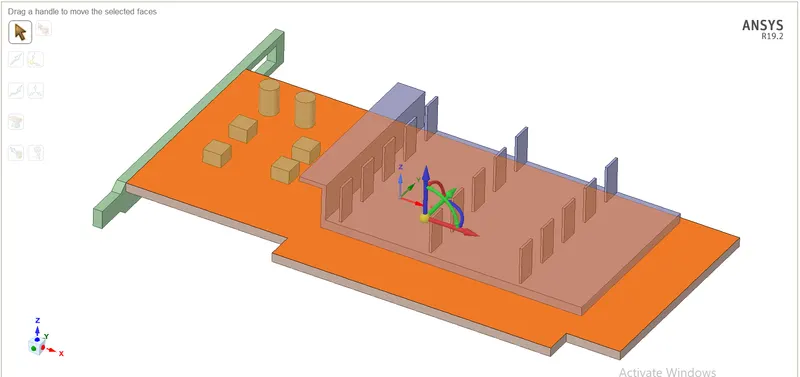
Final Geometry:
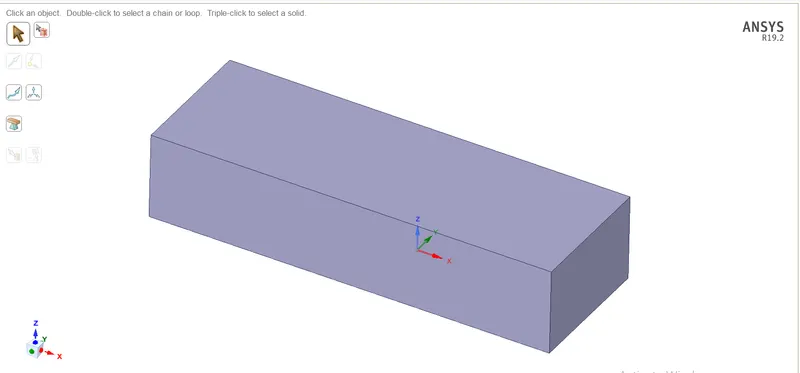
Enclosure:
MESHING:
- To make the mesh conformal and to lower interpolation error, the shared topology is developed.
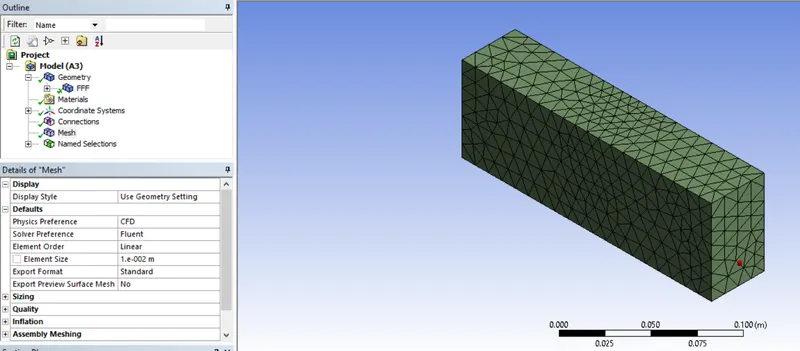
- The baseline mesh of 0.01 mm is generated after the geometry has been imported into the meshing interface.
- For the graphics card interface, the named decision is made.
Fins:
Processor:
Base:
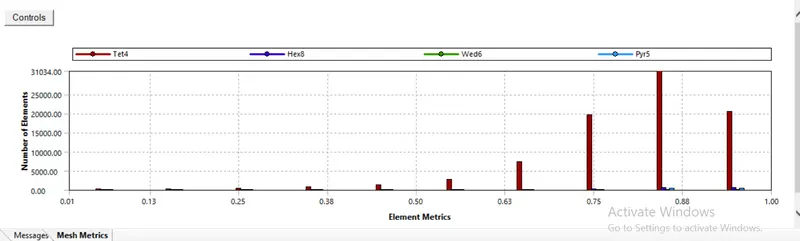
Elemental Quality:
Mesh Metrics:
Element size:

Setup:
- Turn on the energy Equation as the temperature is involved in the problem,
Solver: Steady
Type: Pressure Based
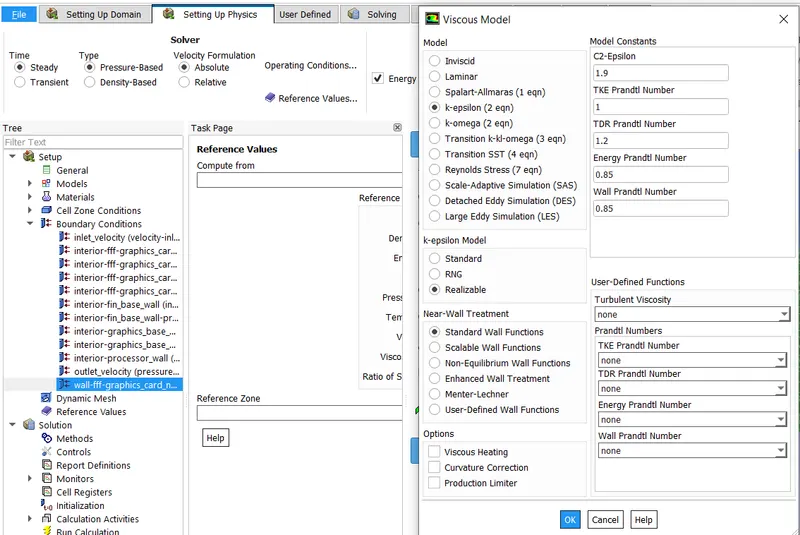
Turbulence Model: k-Epsilon (Realisable)
Materials: Different materials are used for each part, Some of which are custom created
Parts Material
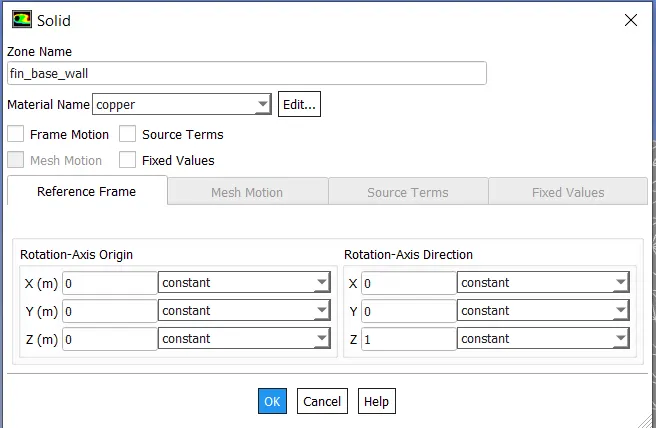
Fins - Copper
Processor - Titanium
Base - Steel (created)
Enclosure - Air
(1) Copper:
(2) Air:
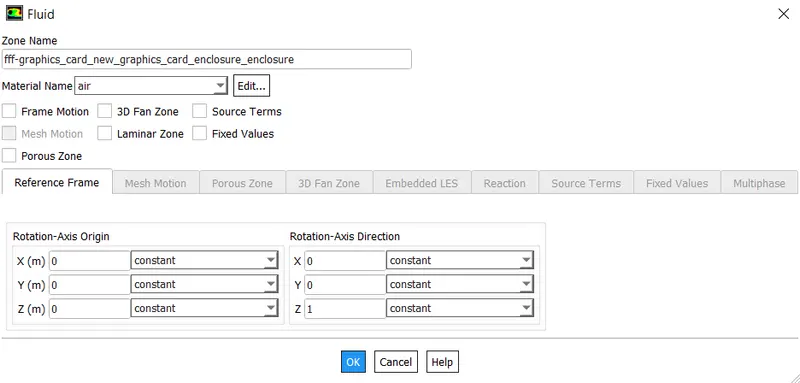
(3) Steel :
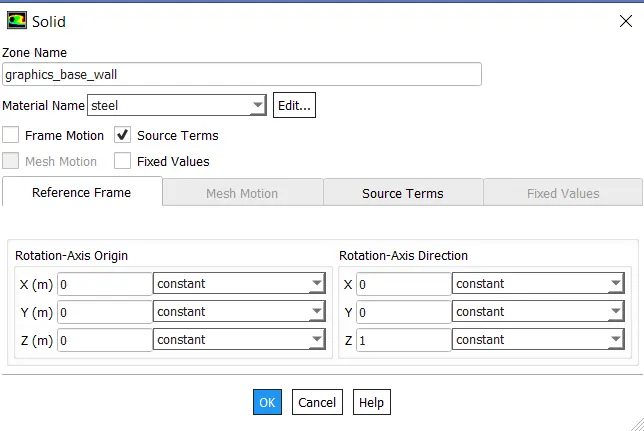
(4) Titanium :
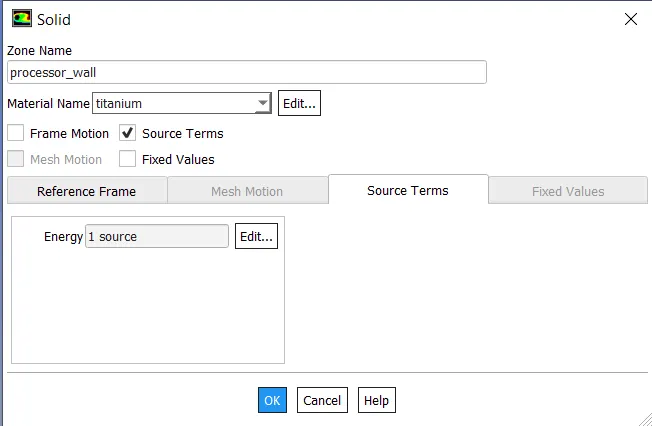
Boundaries :
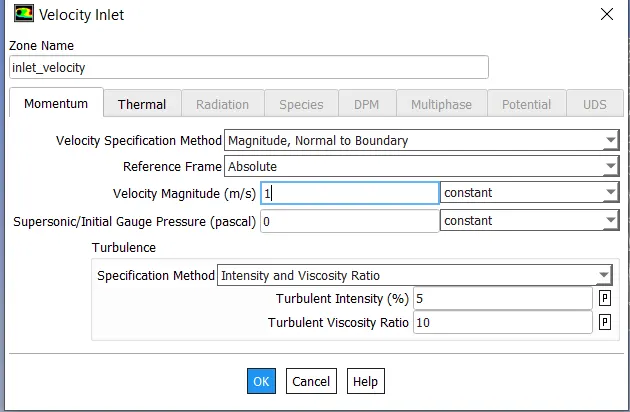
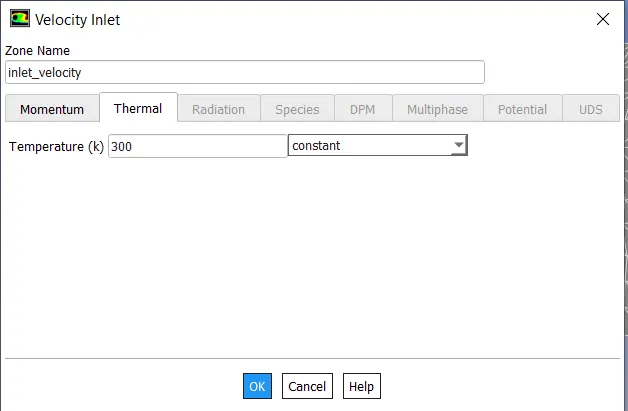
- Inlet:
Type: Velocity inlet
Velocity: 1 m/sec
Temperature: 300K
- Outlet:
Type: Pressure outlet
Pressure: 0 Pa (gauge pressure)
Method of initialization: Hybrid.
Cell Zone:
- The processor wall is selected in the zone tab's edit option, the source term is enabled by choosing one source, and the volumetric heat source value of 5e7 w/m3 is entered as a constant. This equates to 150 W, which is sufficient for the majority of graphics cards but necessitates more for cards like the Nvidia RTX, which needs more than 320 W and a system power of 750 W. Since most mid-range cards only require 150 W, these typically have a 6 pin power connector. GPU power connectors are discussed at https://www.gpumag.com/.
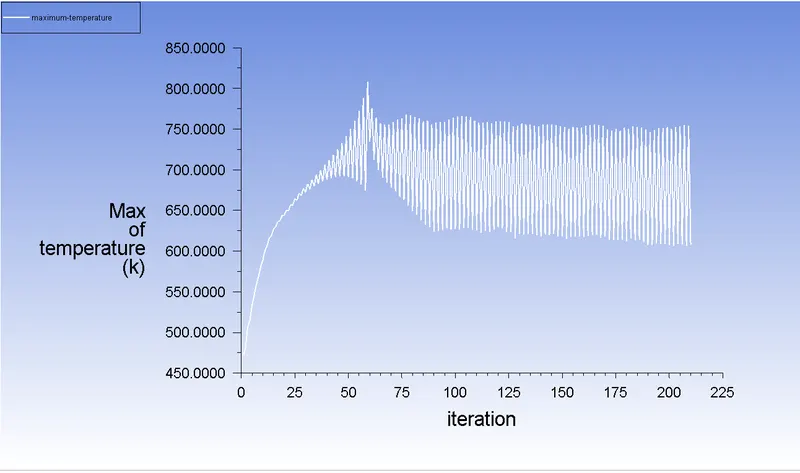
- Selecting the processor wall results in the creation of the maximum temperature plot.
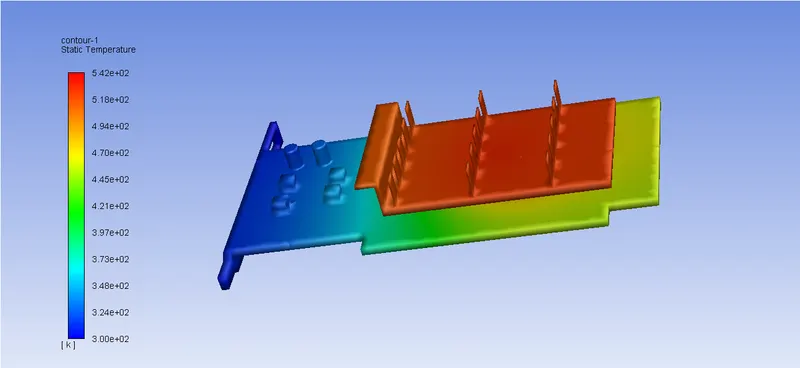
- The complete graphics card zones are chosen to generate the temperature contour.
SOLUTION:
CASE- 1: BASE MESH:
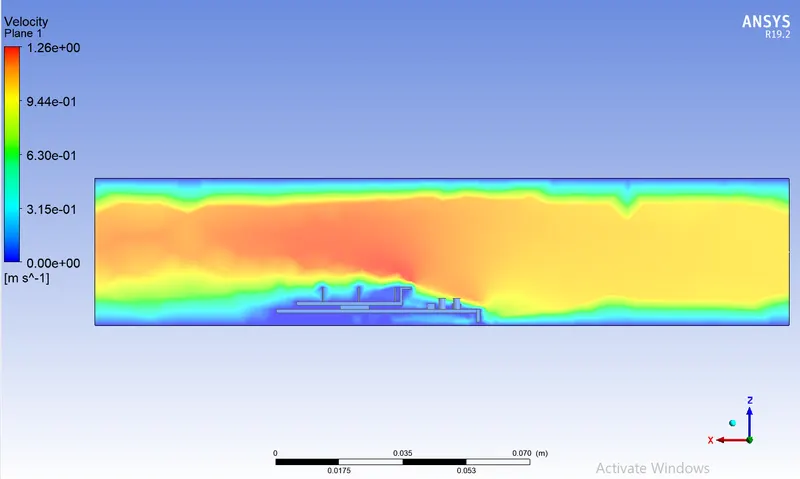
- Velocity : 1m/s, Temperature : 300 K:
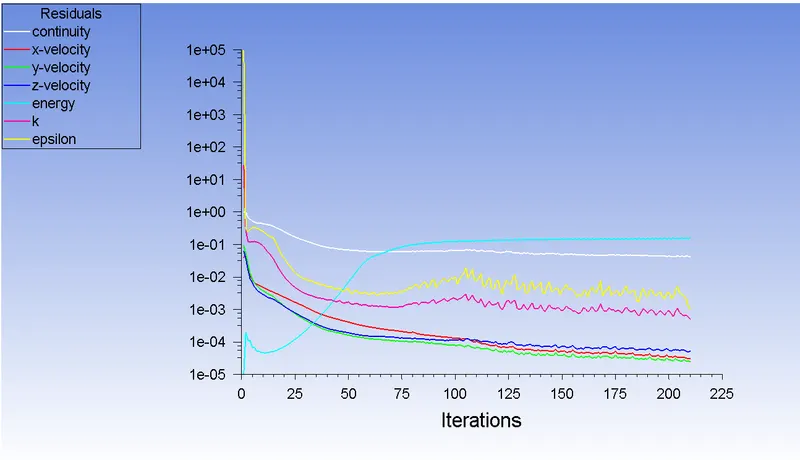
- Residual plot:
- Maximum Temperature plot:
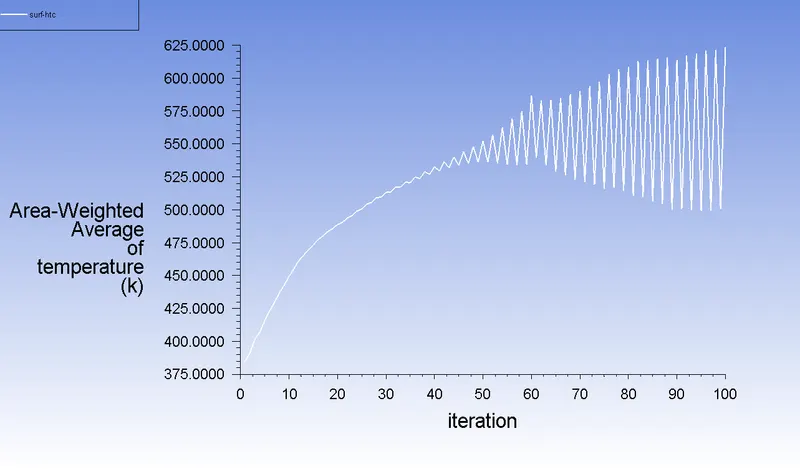
- Surface heat transfer Coefficient plot:
- Velocity Contour:
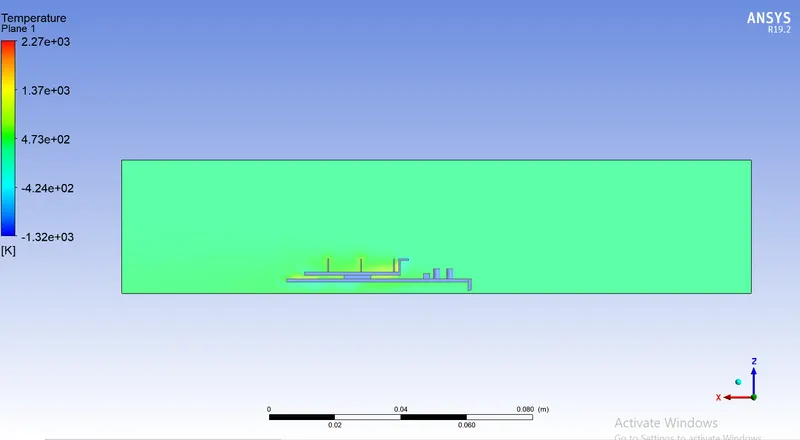
- Temperature Contour:
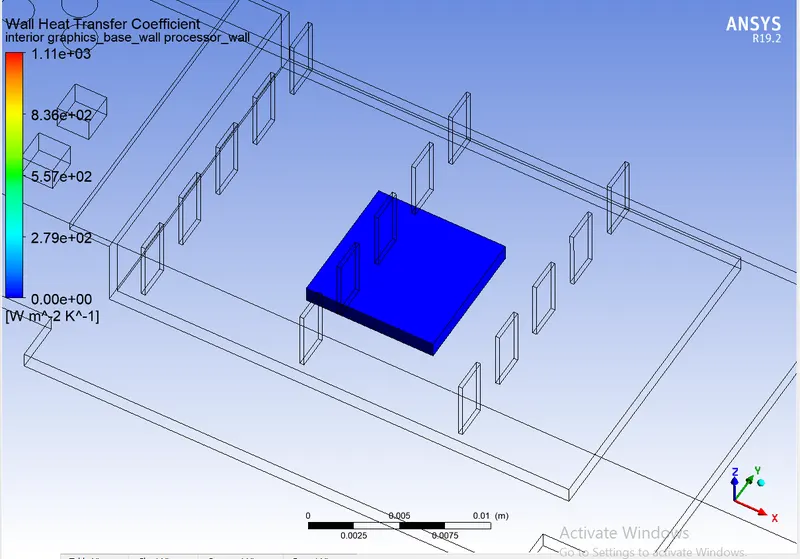
- Wall Heat Transfer Coefficient For Processor:
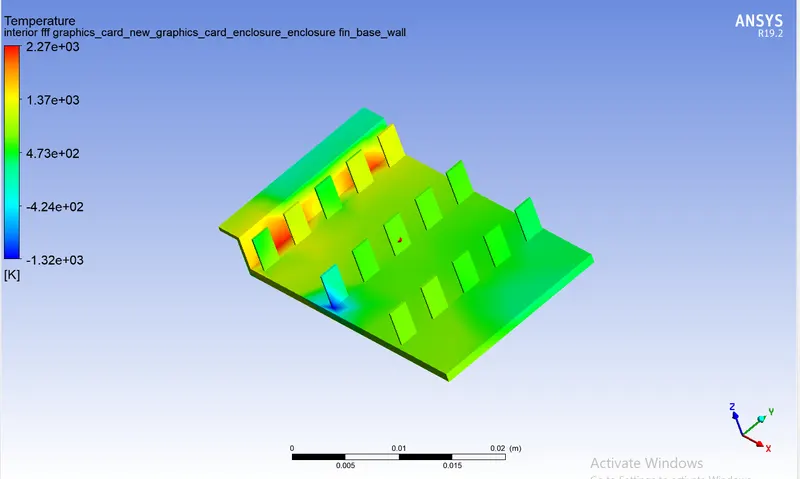
- Fin Temperature:
- Overall Static Temperature:
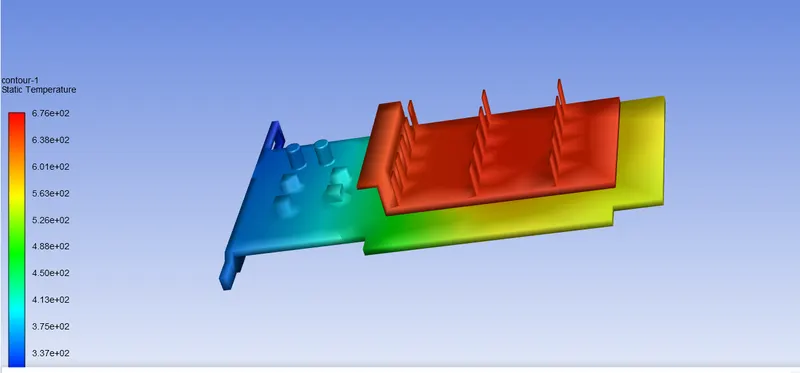
CASE- 2: REFINED MESH:
- The Refined mesh of 0.001 mm is generated after the geometry has been imported into the meshing interface.
- Velocity : 2.5m/s, Temperature : 300 K:
Element Statistics:

Mesh Metrics:
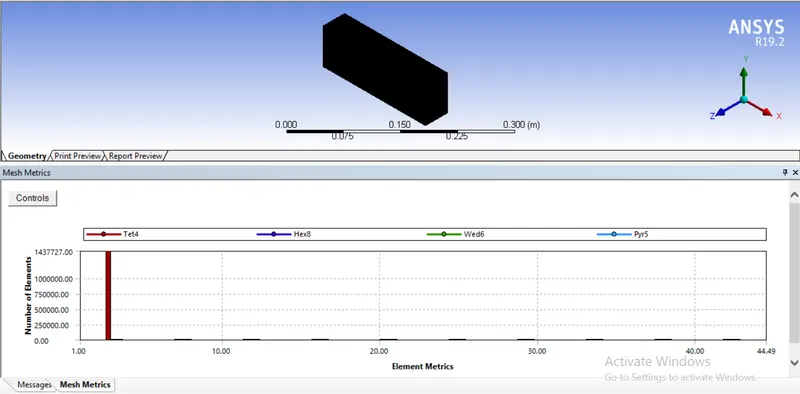
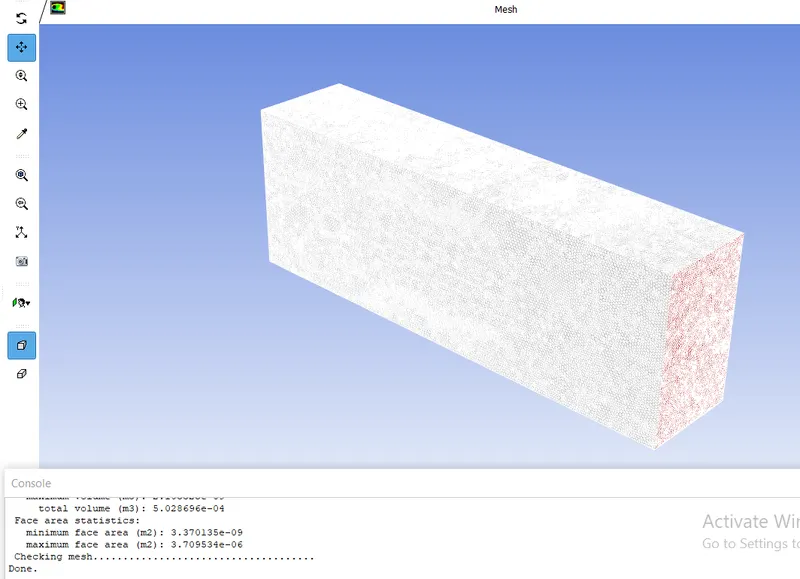
Mesh Check:
- Residual plot:
- Maximum Temperature plot:
- Surface heat transfer Coefficient plot:
- Processor (Hotspot):
- Temperature Around the Fin:
- Overall Static Temperature:
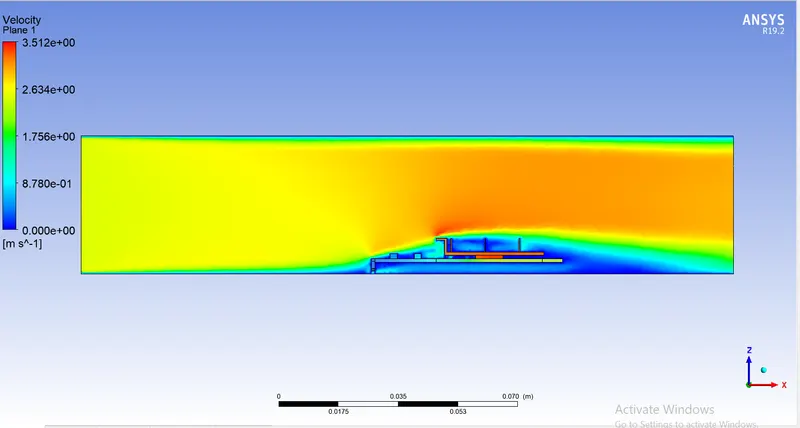
- Velocity Contour:
- Temperature Contour:
CASE- 3: BASE MESH:
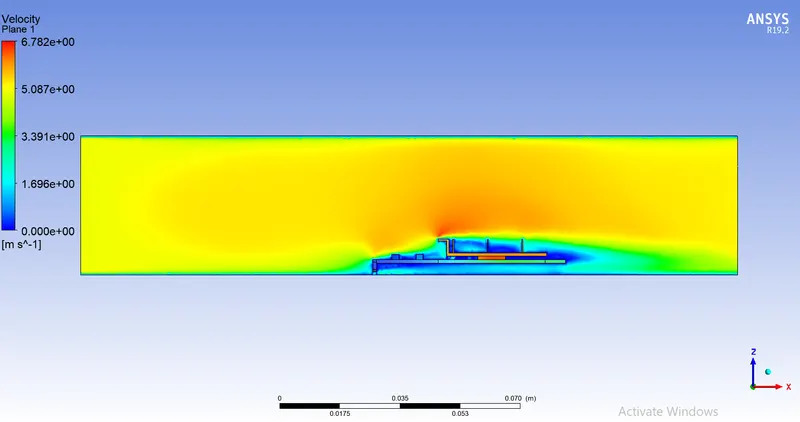
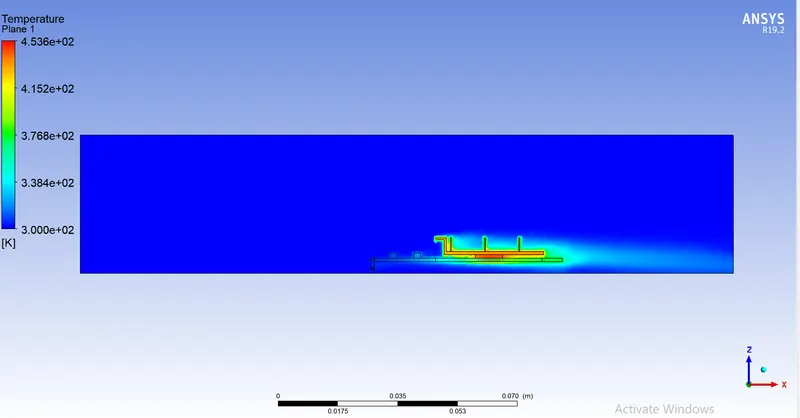
- Velocity : 5m/s, Temperature : 300 K:
- Residual plot:
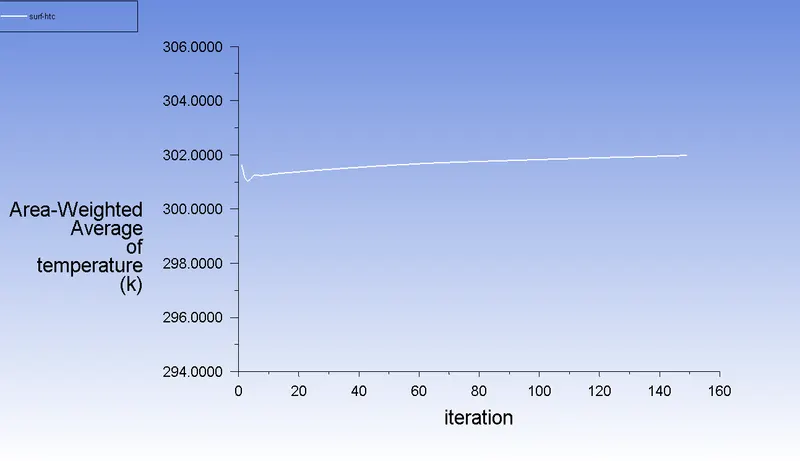
- Maximum Temperature plot:
- Surface heat transfer Coefficient plot:
- Processor (Hotspot):
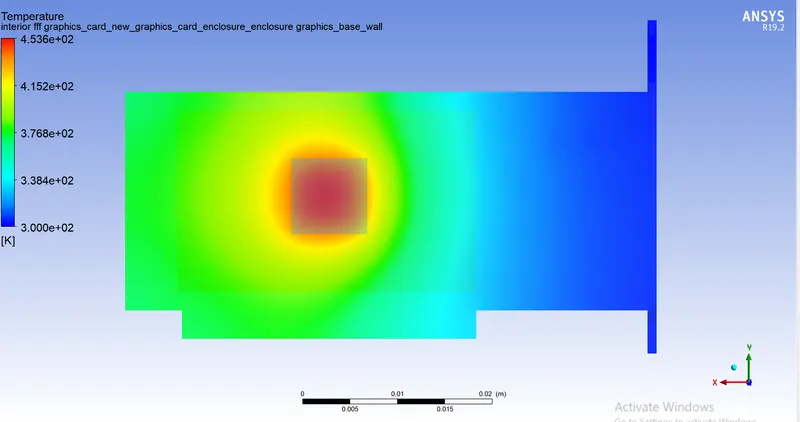
- Temperature Around the Fin:
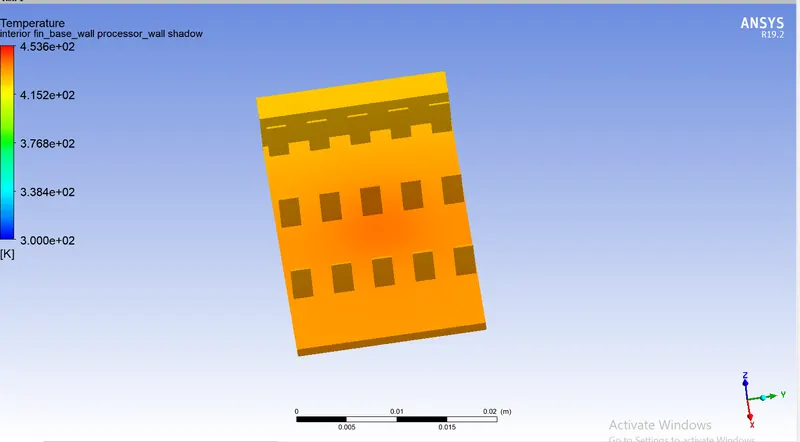
- Overall Static Temperature:
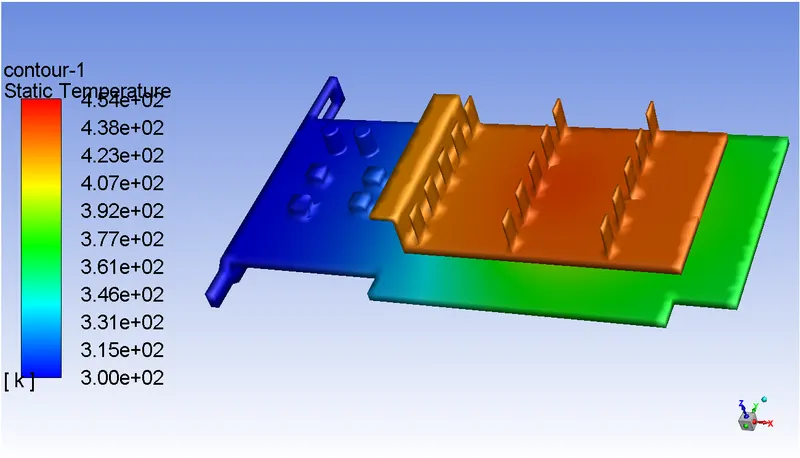
- Velocity Contour:
- Temperature Contour:
RESULTS:
| CASES | VELOCITY(m/s) | TOTAL TEMPERATURE OF GRAPHICS CARD(K) | TOTAL HEAT TRANSFER COEFF ON GRAPHICS CARD (W/m^2K) |
| CASE 1 (Base mesh) | 5 | 1078 | 1134 |
| CASE 2( Refined Mesh ) | 2.5 | 852 | 1175 |
| CASE 3 ( Refined Mesh) | 1 | 967 | 1156 |
CONCLUSION:
- Hence, accurate data on the temperature distribution are obtained as the number of elements increases.
- It is clear from the data above that as inlet velocity rises, graphics card component net temperatures decrease.
- It can be inferred as a result that a higher inlet velocity results in better cooling and a lower average temperature, safeguarding the components.
- Thus, it can be inferred that a higher inlet velocity results in better cooling and less throttling. Further evidence that greater velocity enhances cooling comes from the fact that component temperatures increase as inflow velocity falls from 5 m/s to 1 m/s. An average temperature keeps the parts from being damaged.
- In Case 3 ( Refined mesh) the 149 th iteration is converged.
- Hence from that observations, we can say that the higher inlet velocity results in better cooling and lower average temperature thus we can maintain the optimum temperature at the processor to avoid damage to components.
REFERENCE:
- https://www.simscale.com/projects/hkonka/conjugate_heat_transfer_analysis_using_graphic_card/
- https://www.paanduv.com/profile/prasoon-kumar
- https://www.researchgate.net/publication/332963034_Computational_Fluid_Dynamics_Simulation_on_the_Heat_Sink_Performance_of_a_Graphics_Processing_Unit_Thermal_Management
- https://www.gpumag.com/