Week 6 - CHT Analysis on a Graphics card
AIM:
The aim of the report is to perform steady-state conjugate heat transfer analysis on a graphics card model and validate the results. The conjugate heat transfer analysis is done in which conduction and convection mode of heat transfer takes place simultaneously and simulation is performed by using turbulence model in Ansys fluent.
THEORY:
In modern days, due to advancements in science and technology requirement of high computational power computer systems has been increased. Due to an increase in the computational power, the heat generated by the CPU, mother board, GPU and remaining components in the computer is increased, which leads to rise in the temperature of the system components. Due to rise in the temperature of the components, the computer system may shut down or it will not work properly. So, it is important to dissipate the heat by using fins and cooling fans.
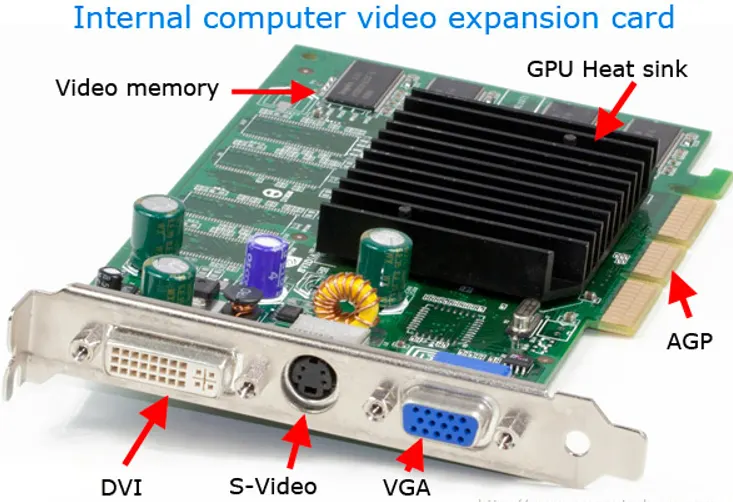
In this report, the thermal analysis of graphics card is performed. A graphics card is an expansion card which renders images to display. High end GPUs are used for gaming, ray tracing, graphics production etc. So, inorder to render high quality images, graphics card should be used.
PROCEDURE:
In this report, thermal analysis of graphics card is performed in 3 different case setup.
Case 1 - Inlet air flow velocity of 1m/s
Case 2 - Inlet air flow velocity of 3m/s
Case 3 - Inlet air flow velocity of 5m/s
In order to perform conjugate heat transfer analysis in Ansys fluent, certain steps have to be followed.
Step 1 - Geometry
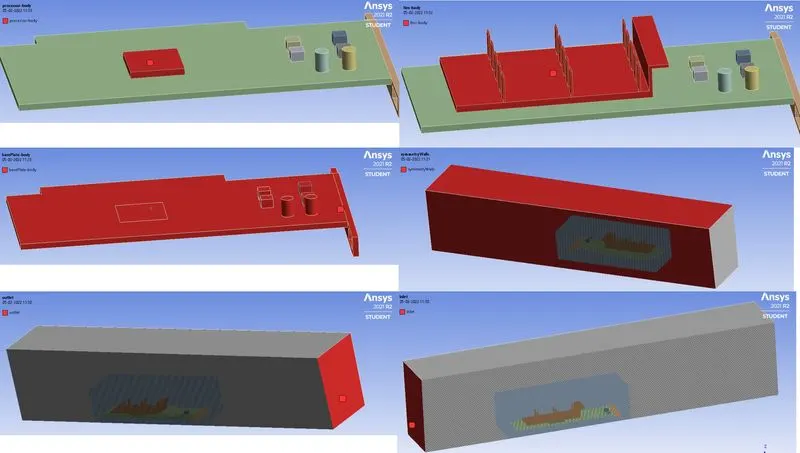
First import the cad model in space claim. The cad model contains the following parts.
1) PCB - A thin plate on which chips and other electronic components are placed.
2) Processor - The main part in the GPU which performs tasks, where major heat generation takes place.
3) Fins - Placed above the processor and extracts the generated heat.
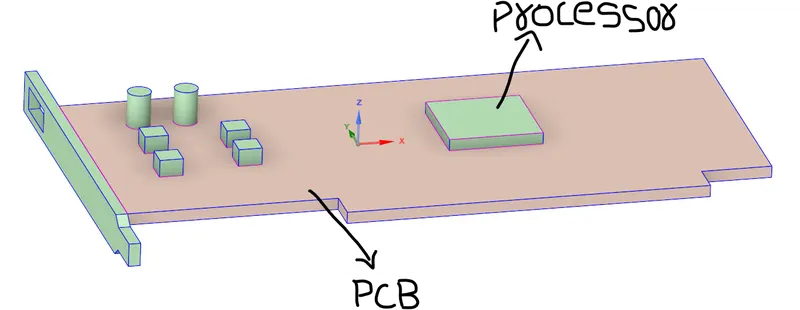
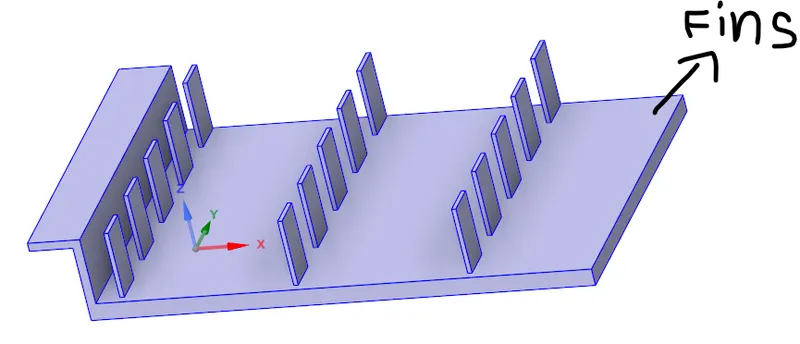
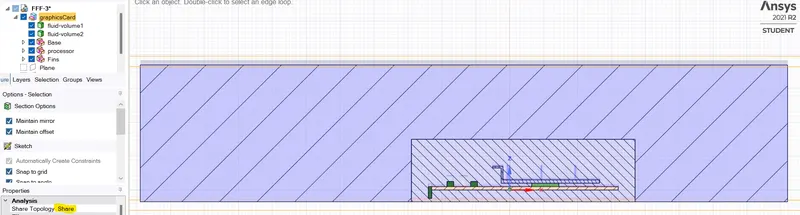
Next, create two-fluid enclosures around the graphics card such that more refined mesh is generated in the inner enclosure and enable share topology as shown in the fig.
Step 2 - Mesh
First, before generating the mesh, assign names to the parts and boundaries in named selection.
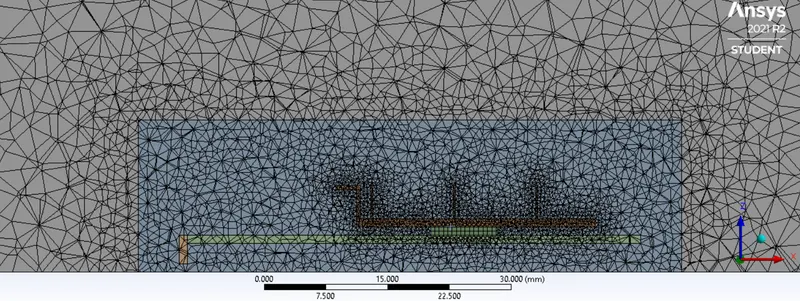
First, generate mesh element size 5mm.
Generate mesh of element size 1.5mm in the inner enclosure.
Generate mesh of element size 0.5mm in fins such that refined mesh is generated near the fins as shown in the fig.
Since, maximum convection heat transfer takes place near the fins, a much-refined mesh is generated near the fins.
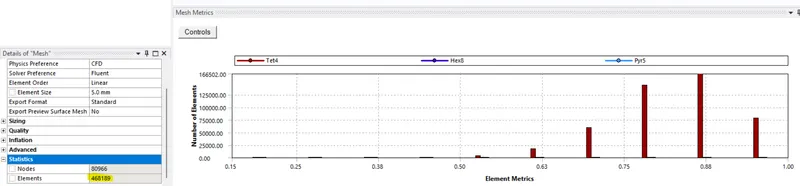
The minimum element quality is greater than 19% and a total of 4,68,189 elements are generated.
Step 3 - Setup
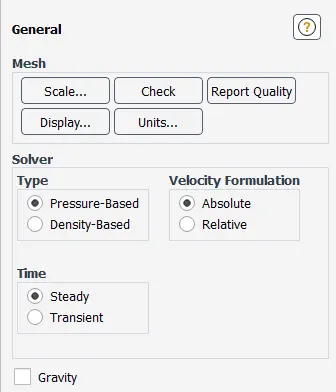
Solver type - Pressure based, Velocity formulation - Absolute, Time - tansient
In CHT analysis of graphics card, since maximum heat transfer takes place due to forced convection, gravity is not included in the analysis.
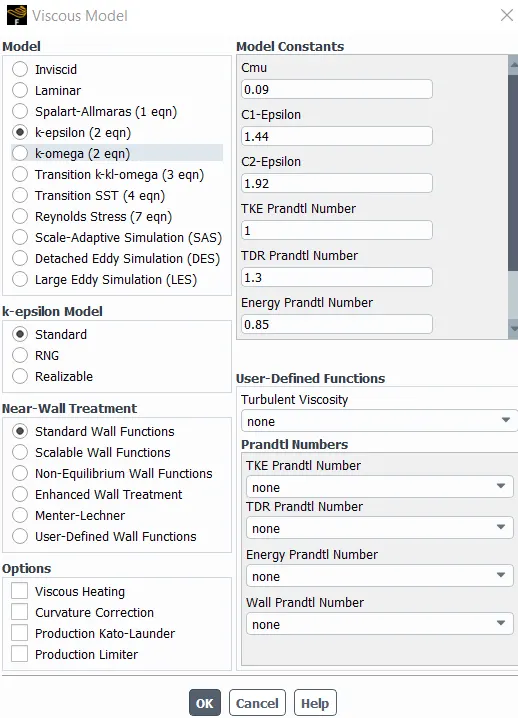
Turbulence model - K - epsilon model
Material type -
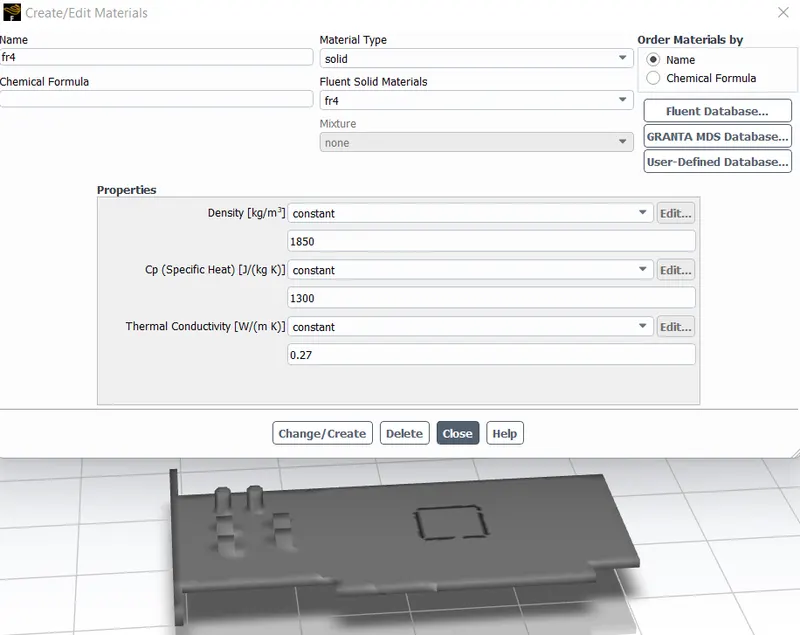
1) Base plate - The substrate most commonly used in printed circuit boards is a glass fiber reinforced (fiberglass) epoxy resin with a copper foil bonded onto one or both sides. The material used for PCB should be non-conductive, FR4 material is used.
2) Fins - In general, aluminum material is used for fins, but due to its high thermal conductivity, copper fins are also used in some applications. In this report, copper material is used to model fins. 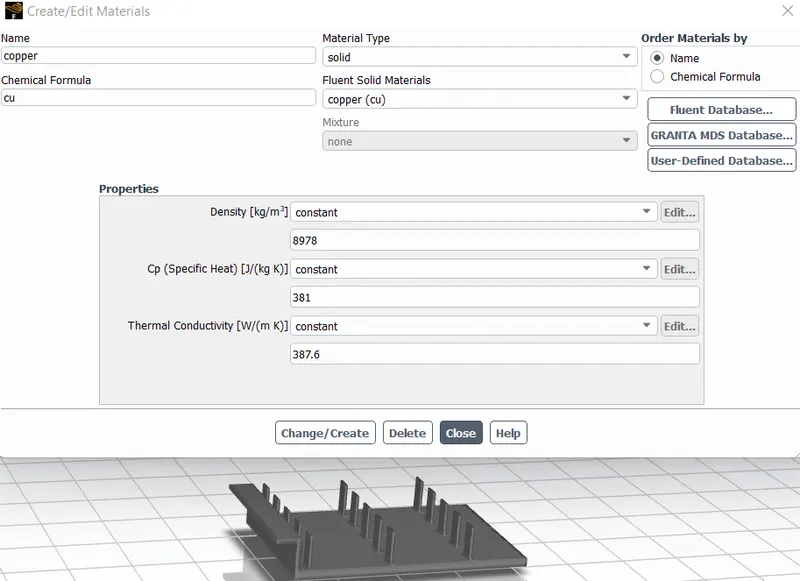
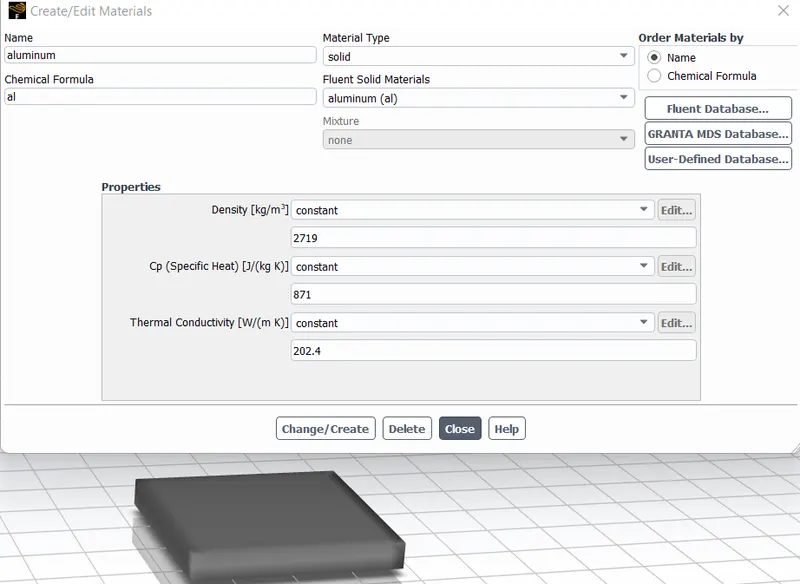
3) Processor - In this report, aluminium material is used to model processor.
4) The working fluid is air.
Boundary conditions -
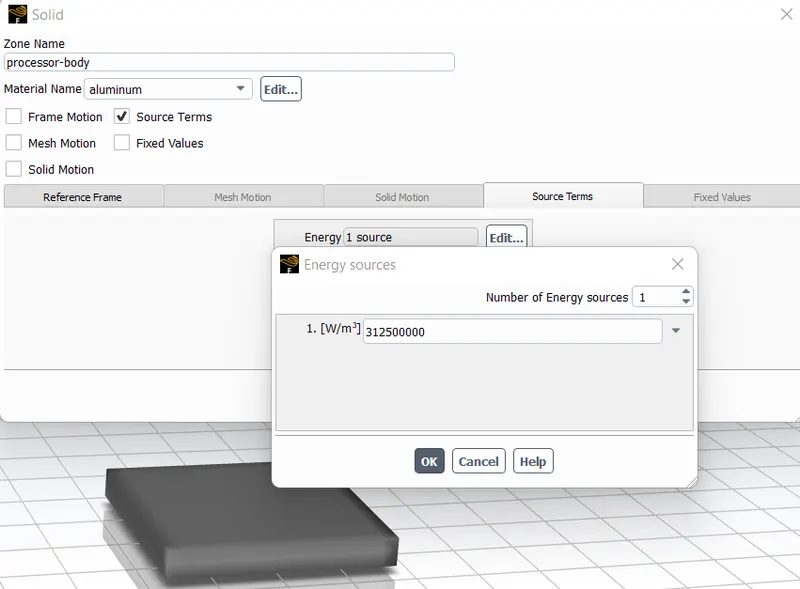
1) Heat source - In the processor, 20 Watt heat generation takes place. since the processor volume is around 64 mm3, a total volumetric heat generation of 0.3125e9 Watt/m3 takes place.
2) Inlet - Type velocity inlet with 1 m/s, temperature = 27 degree celsius.
3) Outlet - Pressure outlet with zero pressure gradient
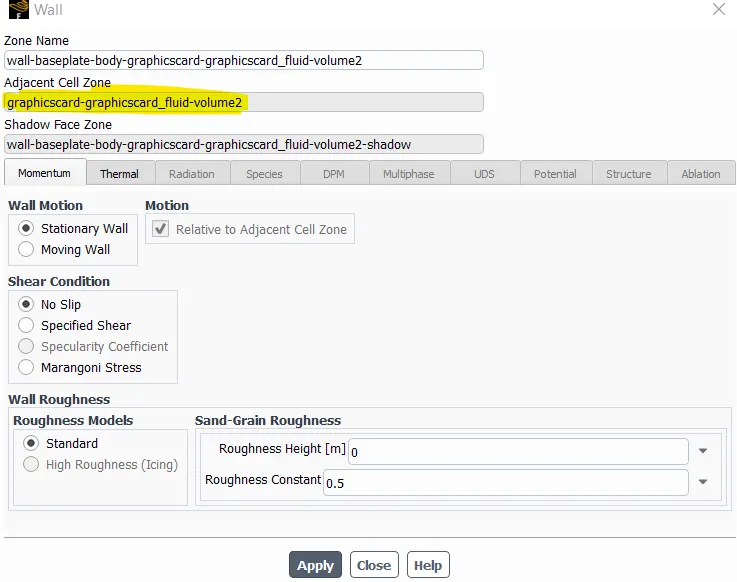
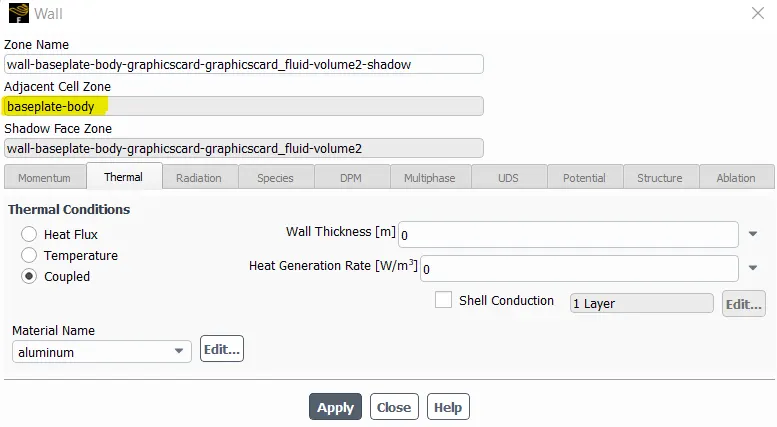
4) Walls - For walls adjacent to the fluid boundary, no-slip boundary conditions are applied and for walls adjacent to the solid boundary, coupled conditions are applied.
Initialize -
Standard method initialization is done with reference values computed from inlet boundary conditions.
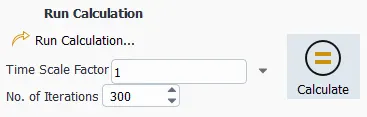
Perform the calculation with a total of 300 iterations.
Step 4 - Solution
The residuals are converged
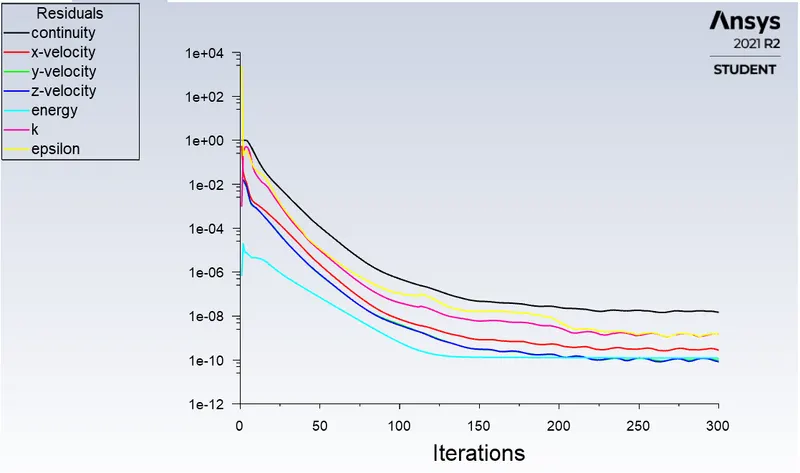
Convergence test -
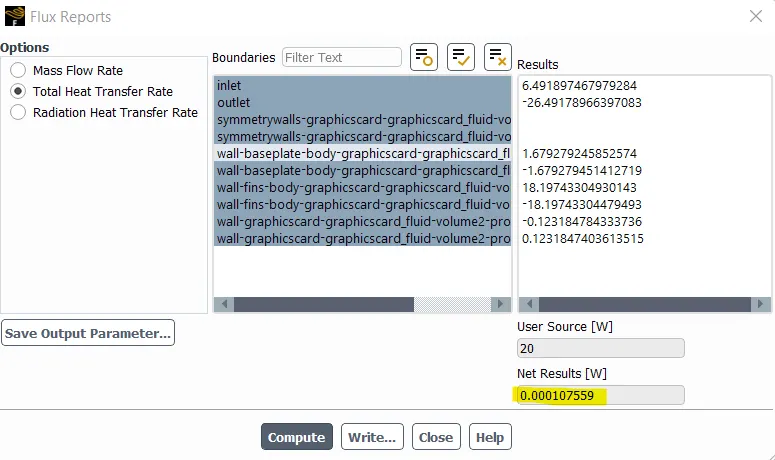
1) Flux -
The following fig shows the total heat transfer rate in the entire domain. The heat generated in the processor is 20Watt. Since, the error is about 0.000107559 Watt (0.005%), convergence is achieved.
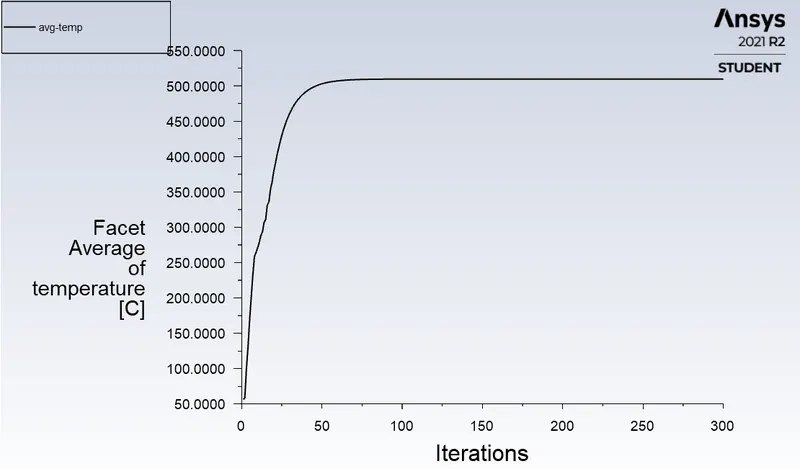
2) Average Surface temperature of processor -
The following fig shows the avg surface temperature of the processor after 300 iterations. It is observed that after 75 iterations, a steady-state temperature of 509.64 degree celsius is achieved. Since, steady-state temperature is achieved, it is noted that convergence is achieved.
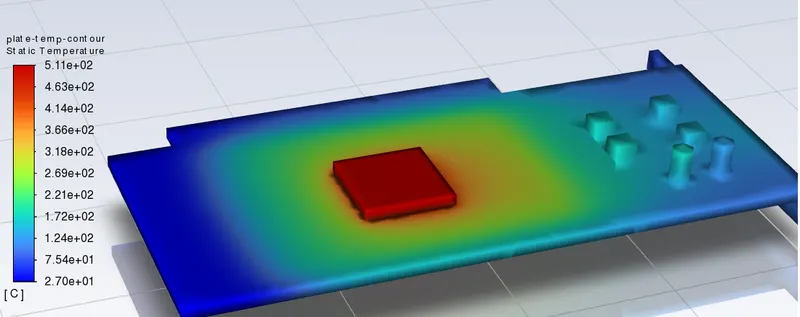
Contours -
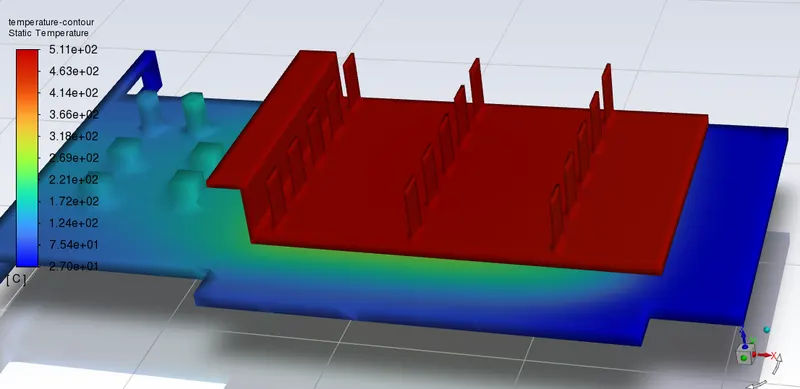
The following fig shows the temperature contour of PCB and processor. The maximum temperature obtained in the processor is about 511.37 degrees celsius.
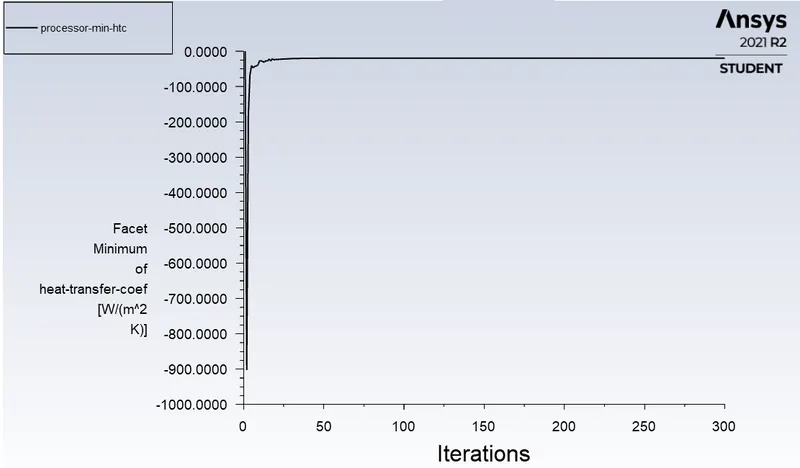
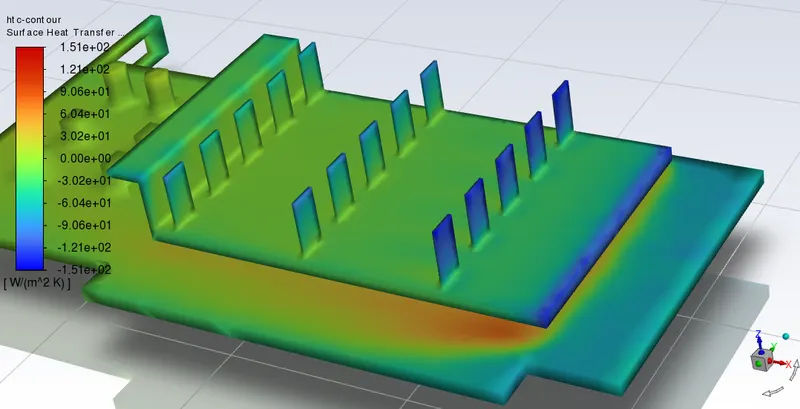
The following plot shows the convective heat transfer coefficient at processor and air interface. Since, heat flows from processor to the air, heat transfer coefficient is represented by -ve sign. At steady state, the magnitude of heat transfer coefficient is 19.69 W/m2K.
The following fig shows the temperature contour of the entire graphics card model.
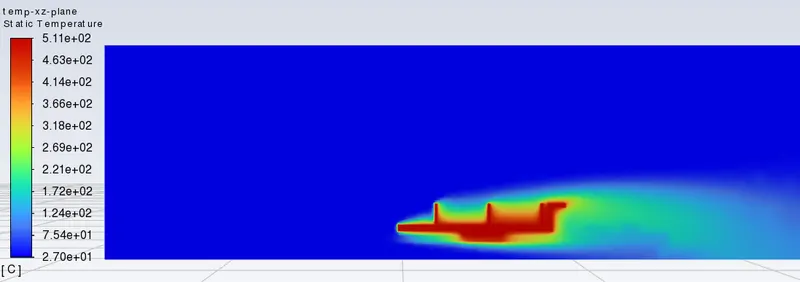
Since, velocity of inlet air is 1m/s, turbulence modeling is performed, formation of thermal boundary layer takes place.
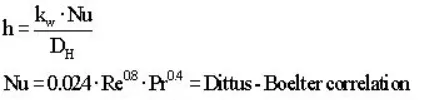
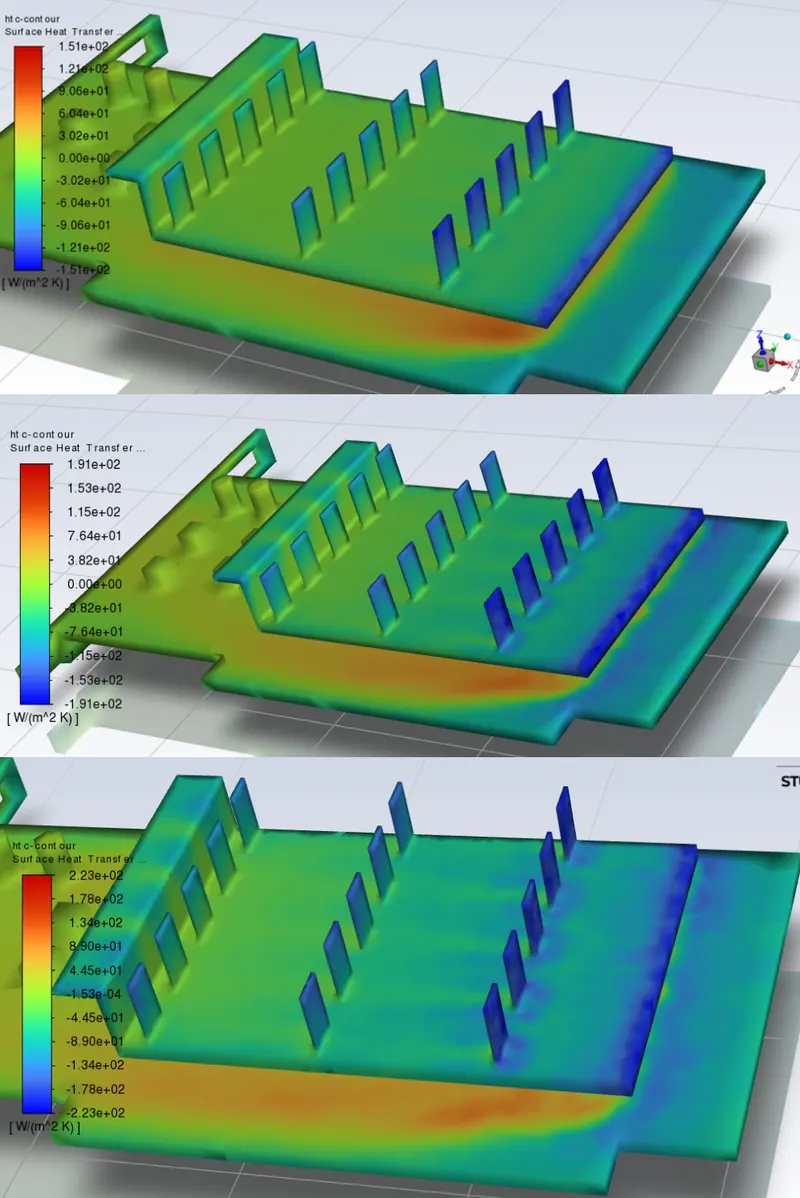
Due to formation of boundary layer, the velocity varies throughout the domain. Since, in forced convection, local heat transfer coefficient depends on the velocity of flow of fluid, the heat transfer coefficient varies through out the domain as shown in the fig. It is observed that since velocity of fluid is maximum at front row of fins, the maximum heat trasfer coefficient of 156.78 W/m2k is obtained.
RESULTS:
The CHT simualtion is performed for 3 different cases of inlet velocity 1,3,5m/s.
| S.No | Velocity | Max temp in processor
[C] |
Max temp in fins
[C] |
Max htc in processor
[W/(m^2 K)] |
Max htc in fins
[W/(m^2 K)] |
| 1 | 1 m/s |
511.3718 |
510.86073 |
19.693205 |
156.78453 |
| 2 | 3 m/s |
271.51843 |
270.9998 |
38.104664 |
237.80209 |
| 3 | 5 m/s |
208.32968 |
207.80496 |
64.745605 |
277.31198 |
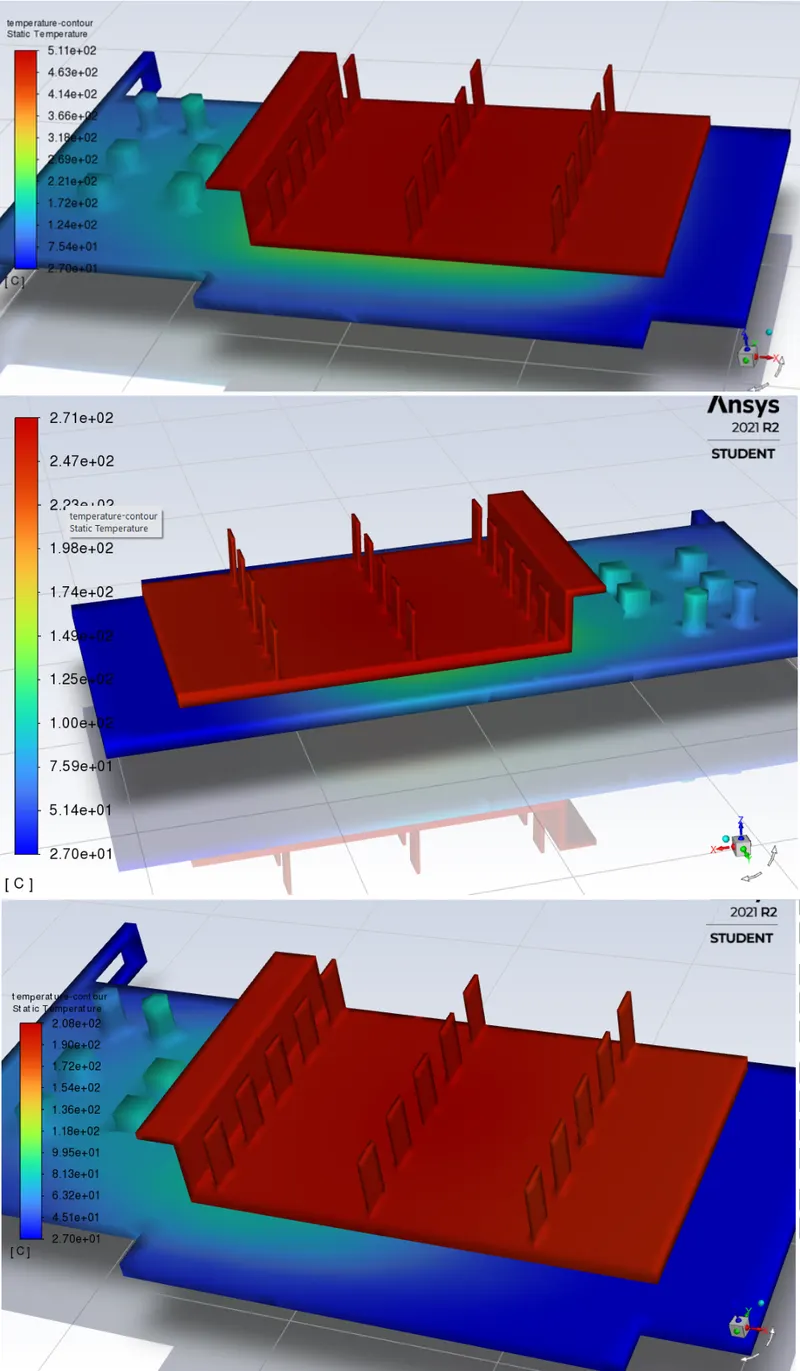
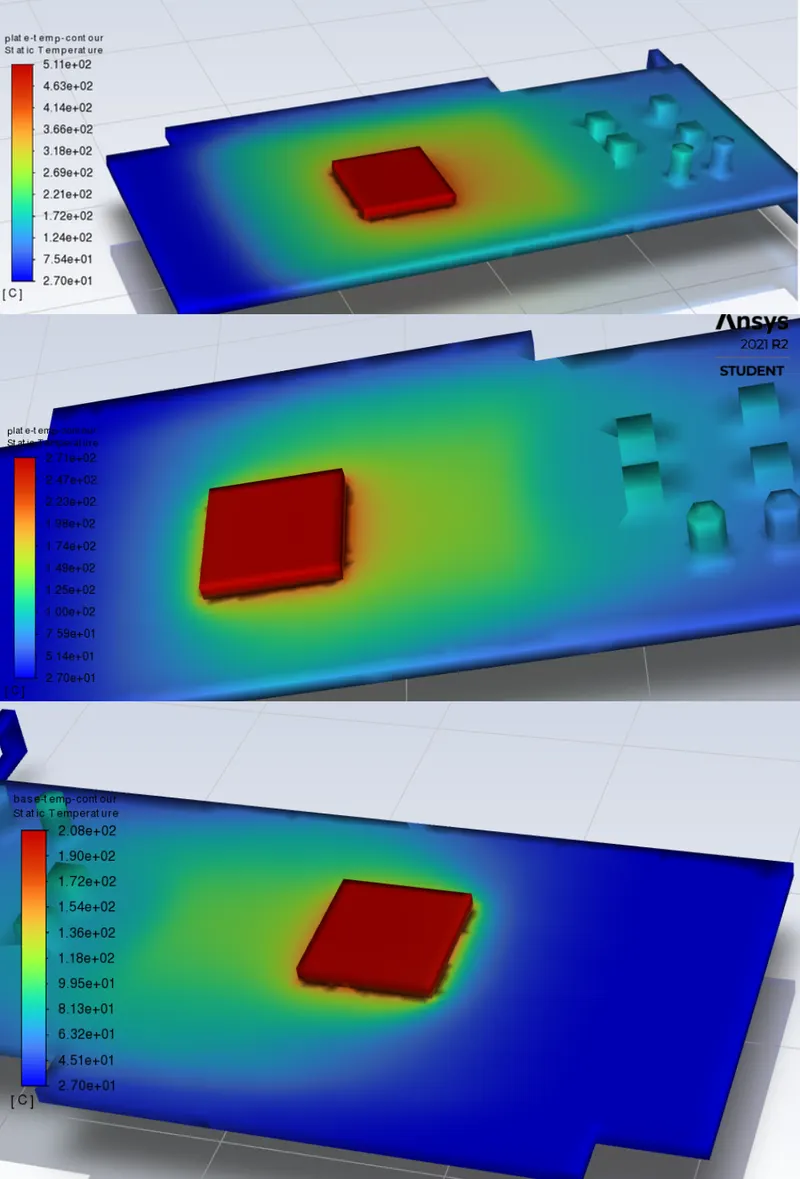
From the table and fig, it is observed that as the air flow inlet velocity increases, the surface heat transfer coefficient value also increases. It is observed from the table, as the velocity increased by a factor of 5 from 1m/s to 5m/s, the maximum heat transfer coefficient is increased by a factor of 2 and maximum temperature attained in the graphics model is decreased by a factor of 2.45
From the above fig, the heat-affected region towards the inlet boundary at PCB is decreased when the inflow velocity is increased.
CONCLUSION:
It is concluded that inlet velocity is increased by a factor of 5, the maximum temperature attained in the graphics model is decreased by a factor of 2.45, and the heat-affected zone in the PCB is also decreased. The maximum temperature hot spots regions exists in the processor and in the region near the processor.