Week-6 Calculate the Stretch Ratio by comparing the ELFORM (-2,-1,1,2) with Ogden_Material Model.
AIM:
The objective of the report is to perform the tensile test with different element formulations and validate the results.
EXPLANATION:
Tensile testing is a type of destructive testing used to determine material properties such as yield strength, ultimate tensile strength, ductility, strain hardening characteristics, Young's modulus and Poisson's ratio.
PROCEDURE:
In this report, virtual tensile test simulation is performed for a block with 1, 2, -1, -2 element formulations. In LS-PREPOST, create a block of 10mmx10mmx10mm dimension with 10 elements for each direction by ELEMENT AND MESH > SHAPE MESHER as shown in fig1.
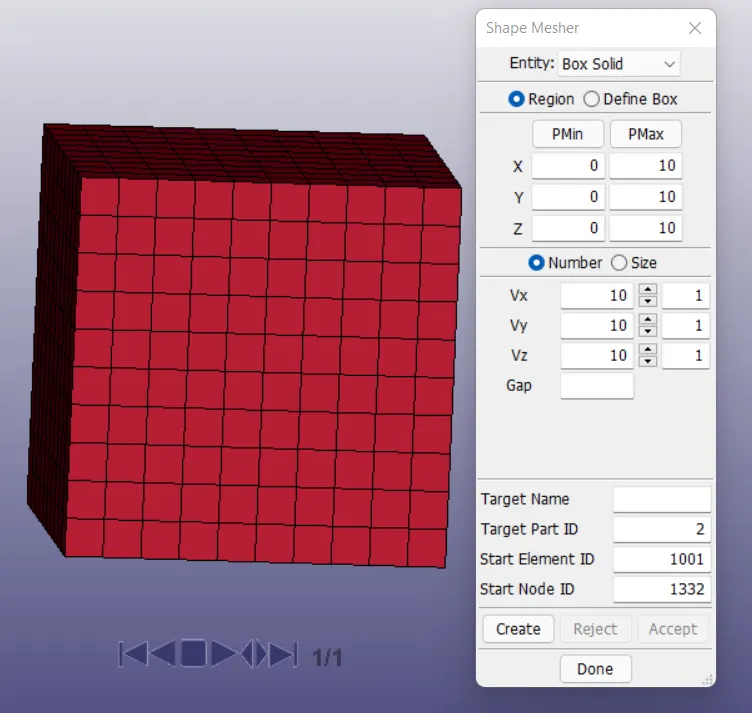
FIG 1- BOLCK OF 10X10X10 mm
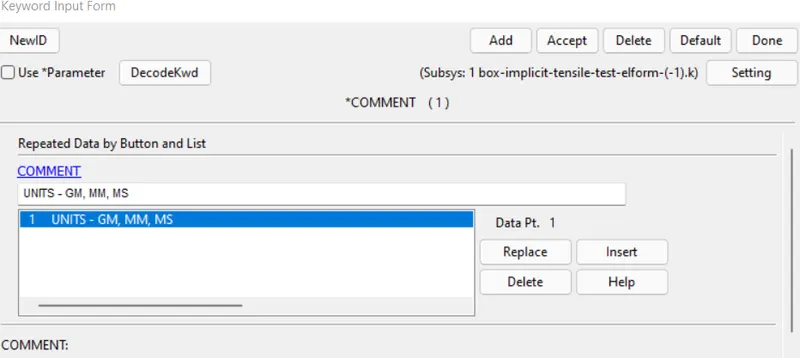
UNITS -
Ls dyna do not follow any default units, the user has to mention the units. In this report, gm,mm,ms unit system is followed
In this report, hyperelastic material model is assigned to the part as shown in fig 2.
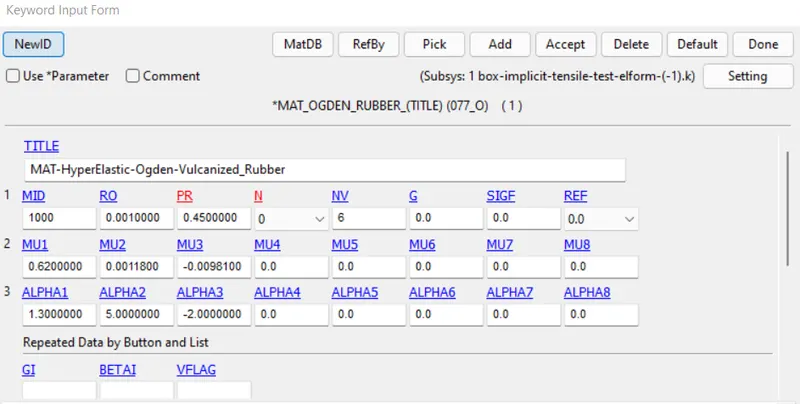
FIG 2- OGDEN_RUBBER MATERIAL CARD
SECTION CARD -
In FEM solvers, stress and strain results are computed in the integration points. Based on the arrangement of integration points within the element, different element formulations are formed. In this report, 4 element formulations are considered for analysis.
- ELFORM: 1 constant stress solid element
- ELFORM: 2 fully integrated S/R solid
- ELFORM: -1 fully integrated S/R solid intended for elements with poor aspect ratio, efficient formulation.
- ELFORM: -2 fully integrated S/R solid intended for elements with poor aspect ratio, accurate formulation.
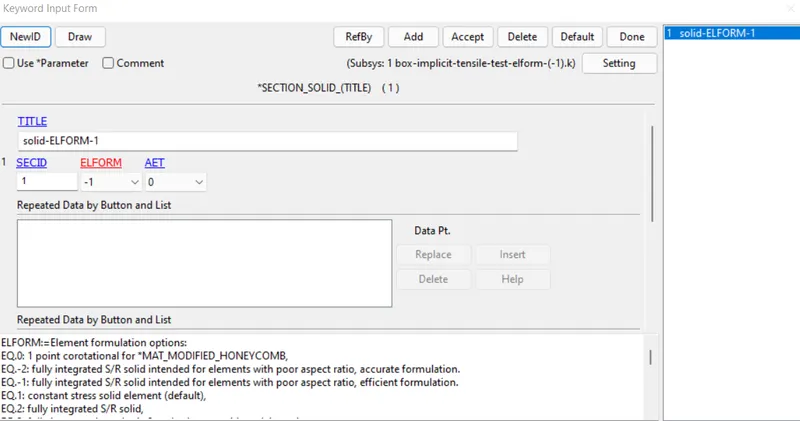
FIG 3 - SOLID_SECTION CARD OF ELFORM 1
BOUNDARY CONDITIONS -
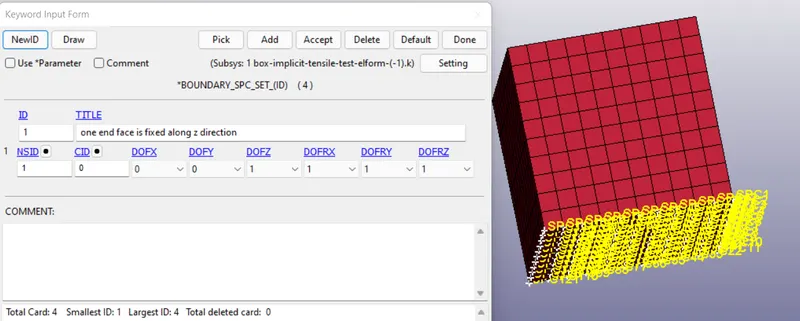
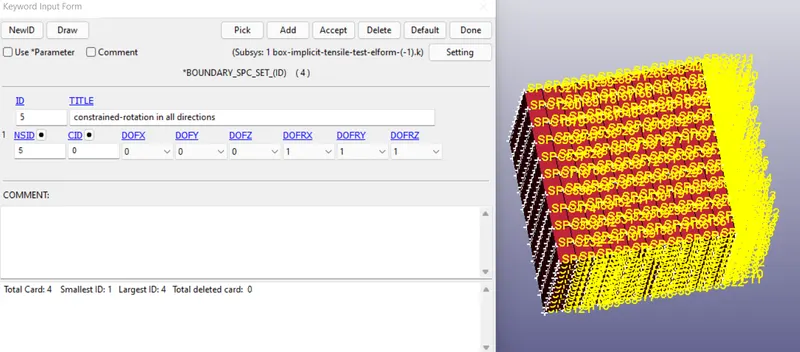
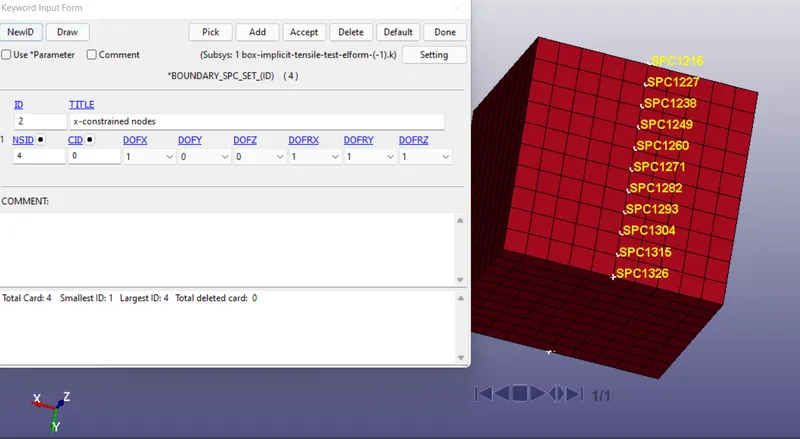
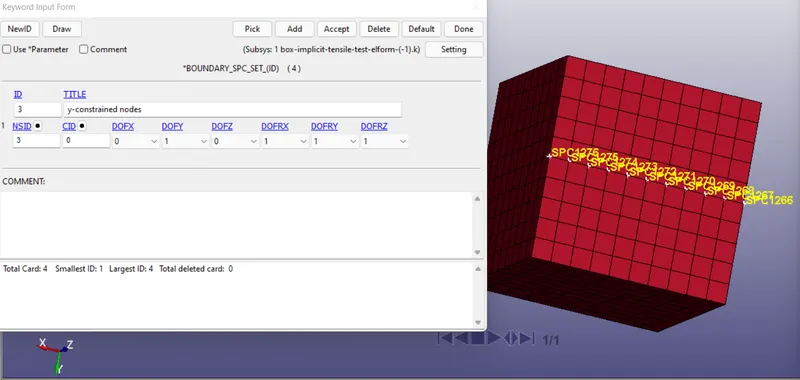
In this virtual tensile test simulation, the force is applied on the block along global z-direction and the following boundary conditions are applied to the block.
- Fixing bottom face of the block
- Applying rotation constraints to the block in global x, y, z directions
- As the block deforms uniformly along z-axis, the following constraints are applied to the block on top and bottom face
INPUT LOAD -
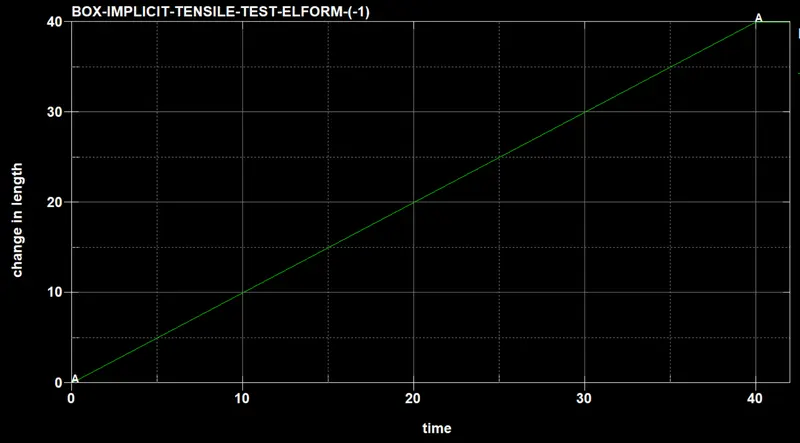
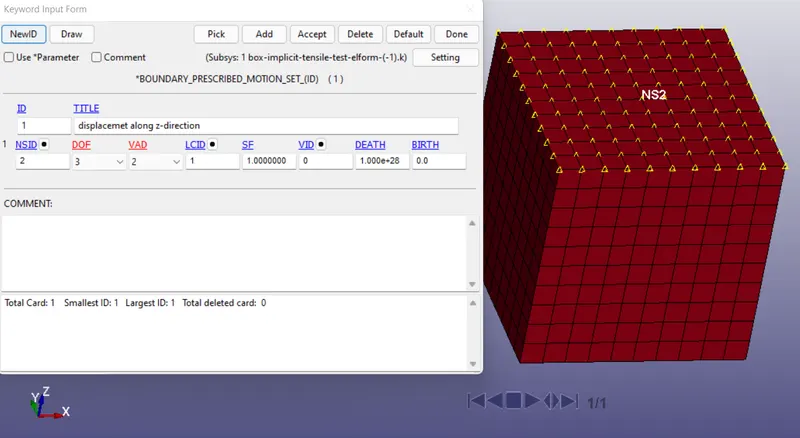
The load curve is defined in such a manner that at the end of the simulation, the final block height should be 5 times of the initial block height. So, prescribed motion set keyword is assigned to the top face of the block.
OUTPUT KEYWORD -
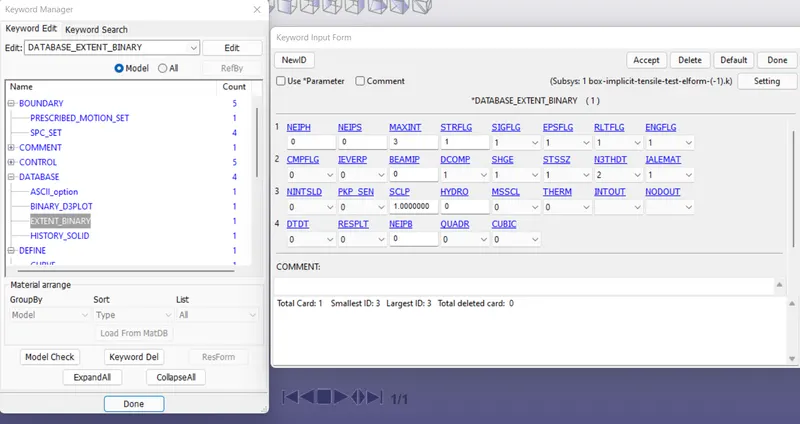
In the output d3 plot, true stress and true strain values are displayed. In order to display the true strain values, allot database_extent_binary and set STRFLG to 1 as shown in fig.
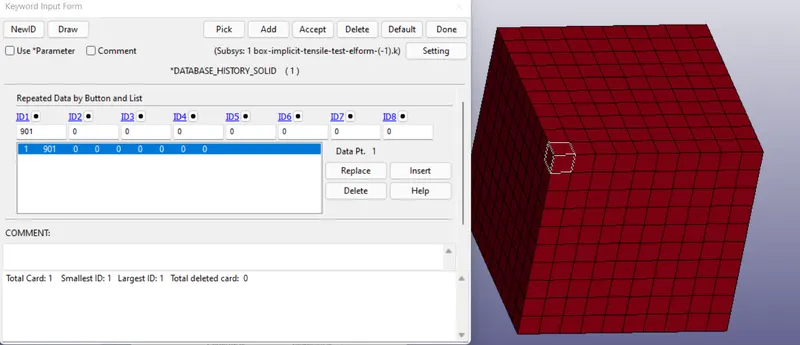
Inorder to compare the stress values for the different element formulations, one element in the solid is considered for analysis as shown in the fig and assign DATABASE_HISTORY_SOLID.
IMPLICIT KETWORD -
In order to perform implicit analysis, certain keywords have to be defined.
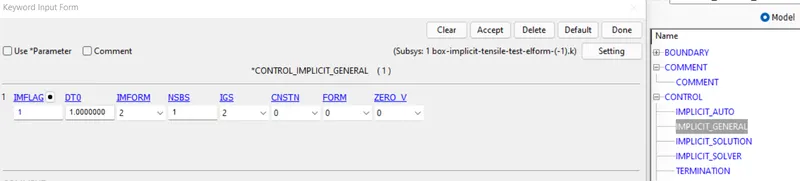
In CONTROL_IMPLICIT_GENERAL keyword, set IMFLAG to 1 such that Implicit solver is gets activated.
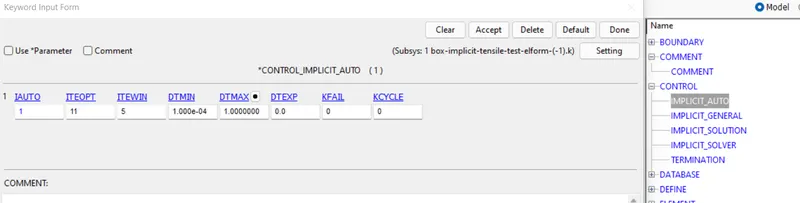
CONTROL_IMPLICIT_AUTO keyword, set IAUTO to 1 such that automatic time step size gets activated in case when convergence is not achieved.
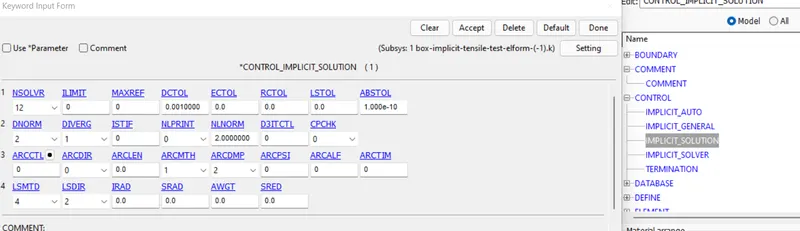
CONTROL_IMPLICIT_SOLUTION is the keyword for non linear solver in IMPLICIT analysis. DCTOL is the distance convergence tolerance limit, if the error (or) residue in the iteration step is less than DCTOL, convergence is achieved in the current step.
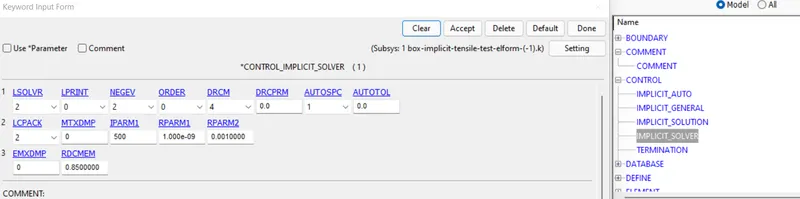
CONTROL_IMPLICIT_SOLVER is the keyword for linear solver in IMPLICIT analysis
CALCULATION -
σ = Eng stress
ε = Eng strain
λ = Stretch ratio = 1 + ε
True stress = σ *(1+ε) = σ *(λ ) ------------------------------------------------------(1)
From (1), we get σ = True stress/λ
True strain = ln(1+ε) = ln(λ ) ----------------------------------------------------------(2)
From (2), we get λ = Lf/L0 = e^(True strain)
TERMINATION -
In control keyword, global settings for the entire analysis can be done. Control_Termination keyword is used to assign the time for the simulation. In this model end time of 40ms is given.
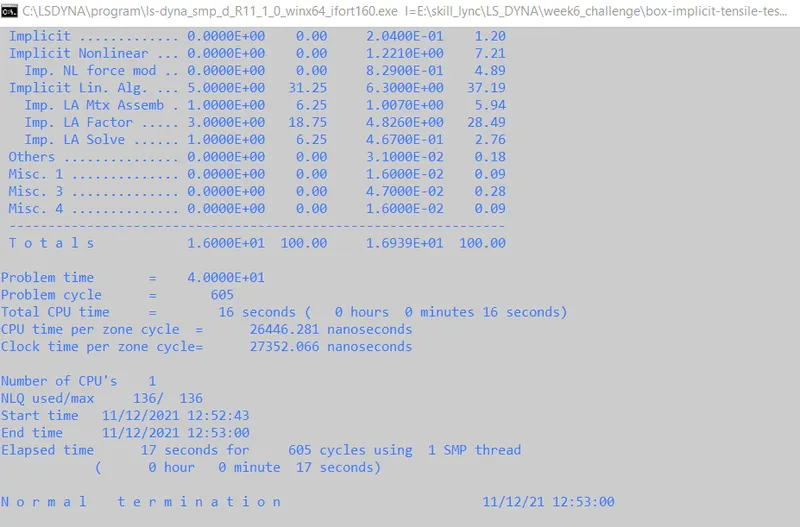
FIG - TERMINATION TIME FOR ELFORM (-1)
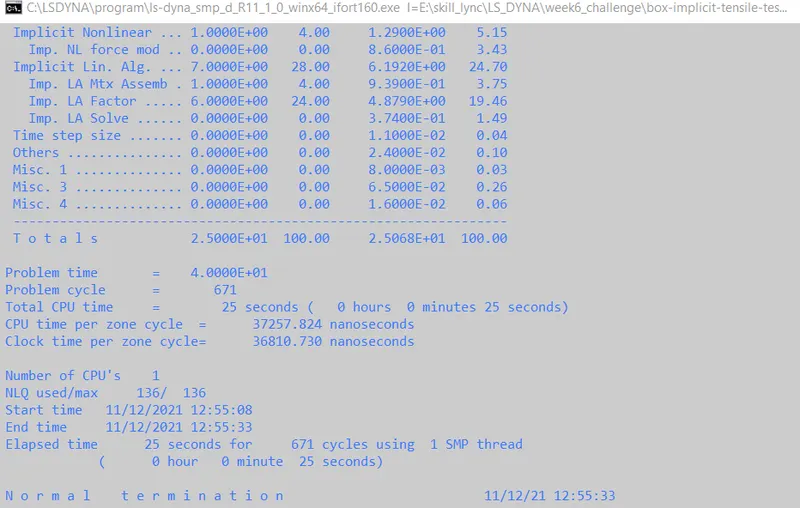
FIG - TERMINATION TIME FOR ELFORM (-2)
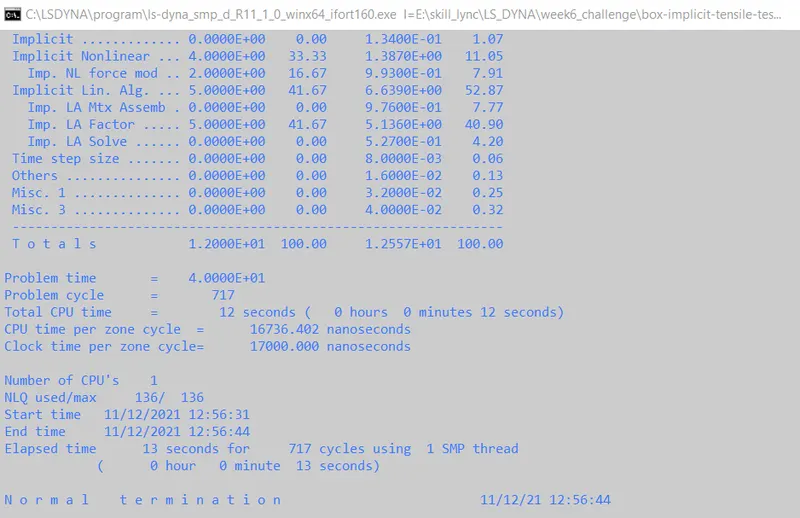
FIG - TERMINATION TIME FOR ELFORM (1)
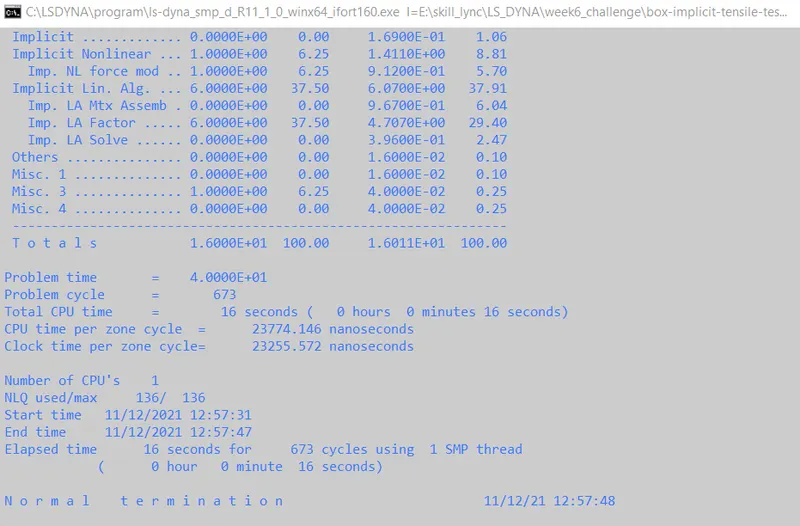
FIG - TERMINATION TIME FOR ELFORM (2)
| ELFORM | COMPUTATIONAL TIME(SEC) |
| -2 | 25 |
| -1 | 16 |
| 2 | 16 |
| 1 | 12 |
RESULTS:
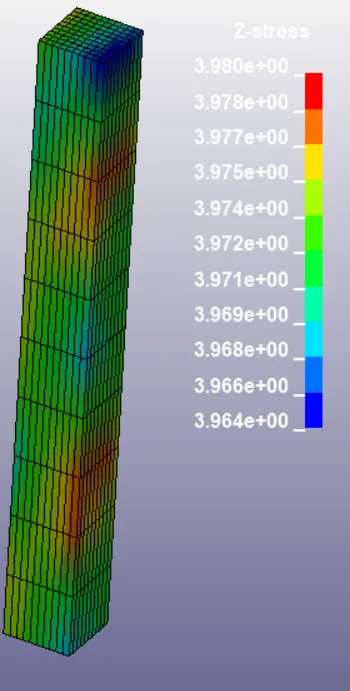
The following fig shows the 3D contour plot of True stress along z-direction of element formulation (-1)
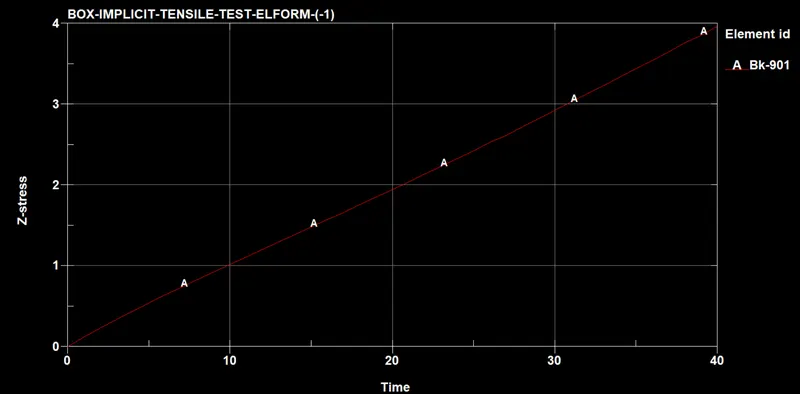
Load the ASCII - ELOUT graph and plot the True z- stress value as shown in the fig
Now, import the above values in the excel sheet and calculate Eng Z - Stress values and plot the graph. The following fig shows the plot of ENG STRESS v/s STRETCH RATIO
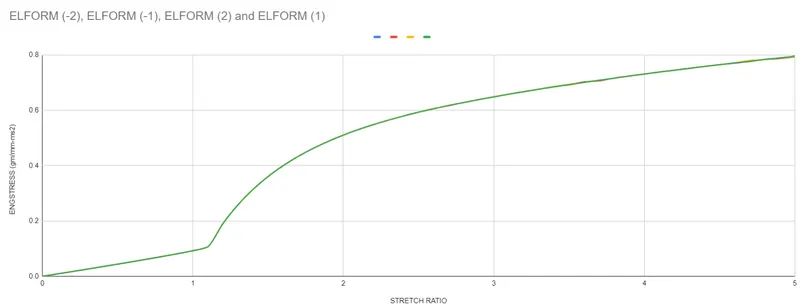
From the above plot, it is observed that the true stress values for all the 4 element formulations are nearly same, there is silght variation in the peak values.
| LEGEND COLOUR | ELFORM | PEAK ENG STRESS VALUE |
| Blue | -2 | 7.94E-01 |
| Red | -1 | 7.93E-01 |
| Yellow | 2 | 7.94E-01 |
| Green | 1 | 7.96E-01 |
CONCLUSION:
The Tensile test simulation was performed and the results are validated. By analysing the results, all the 4 types of element formulation shows nearly similar stress values but the computational time is less for Element formulation (1) type solid.