Week - 5 - Modelling Spotwelds
Aim :
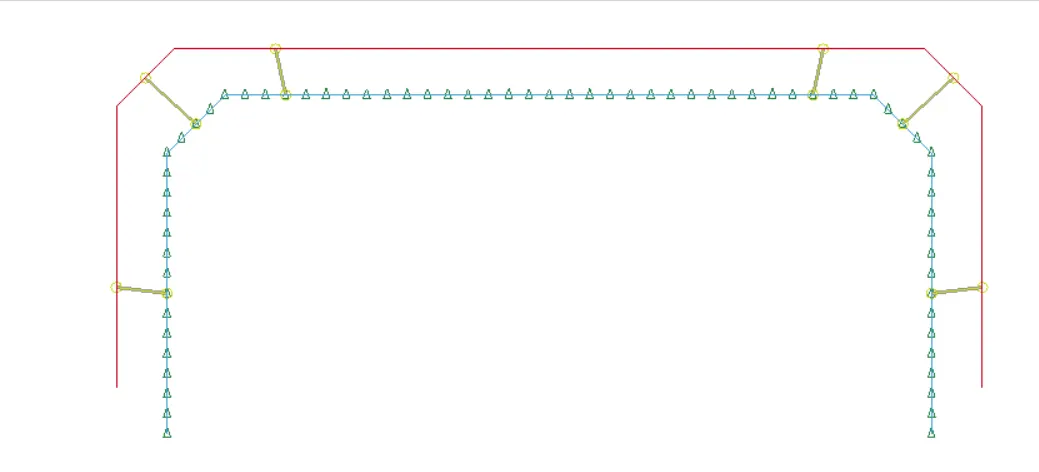
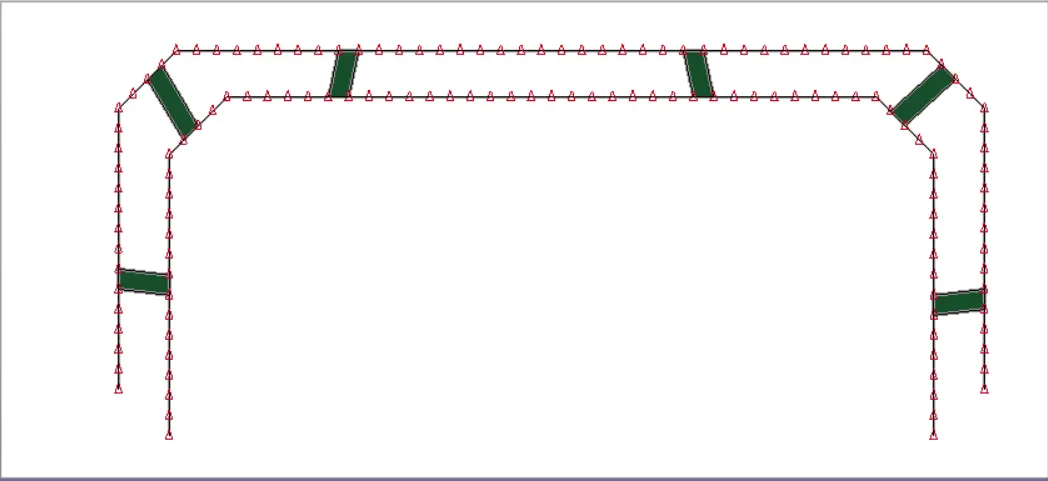
In this assignment, we need to model spotwelds for the given assembly of parts and run a crash test. Details about spotweld location is in the image below. The yellow line signifies the spotweld directions. we need to use 3-7 spotwelds along this line, in a symmetric manner, before running the simulation
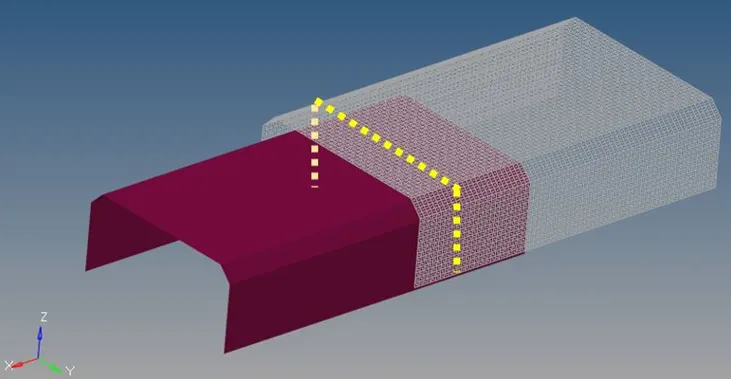
The spotwelds should be modeled using beam elements and solid elements separately. While using solid elements, one spotweld should have one solid element. The axial and shear force should be compared among beam and solid elements. The same material card using *MAT_SPOTWELD should be used for both beam and solid elements. You can use steel material data for *MAT_SPOTWELD cards and calibrate the failure data according to your results. The best simulation should have a failure at half of the termination time.
Procedure :
- As the given model contains meshed surface already so we just need to assign boundary conditions, loads, materials, section, etc.,
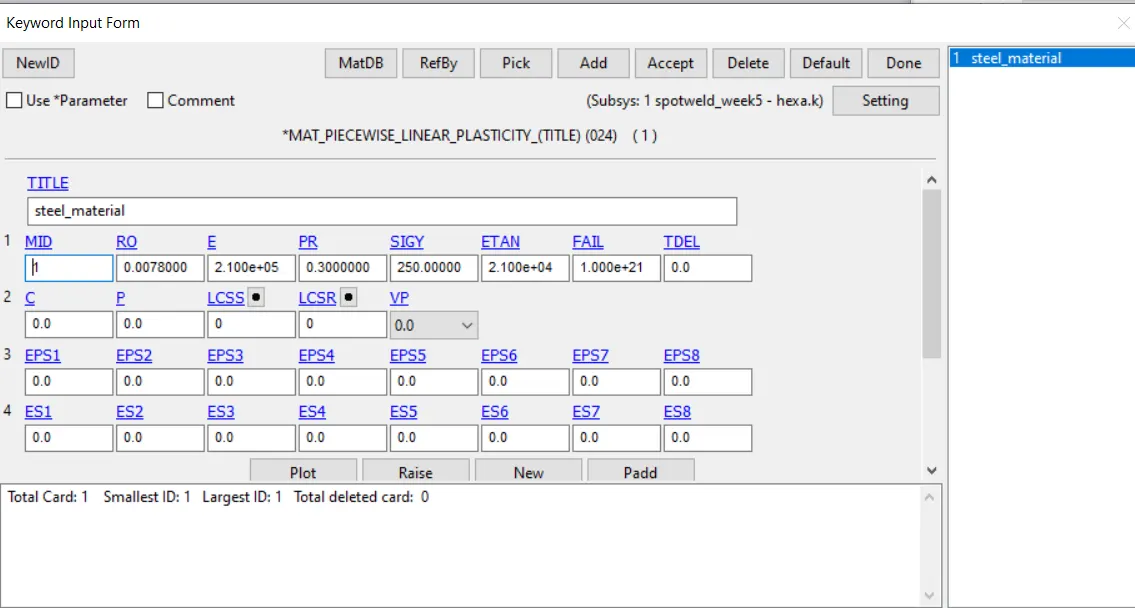
- MATERIAL :
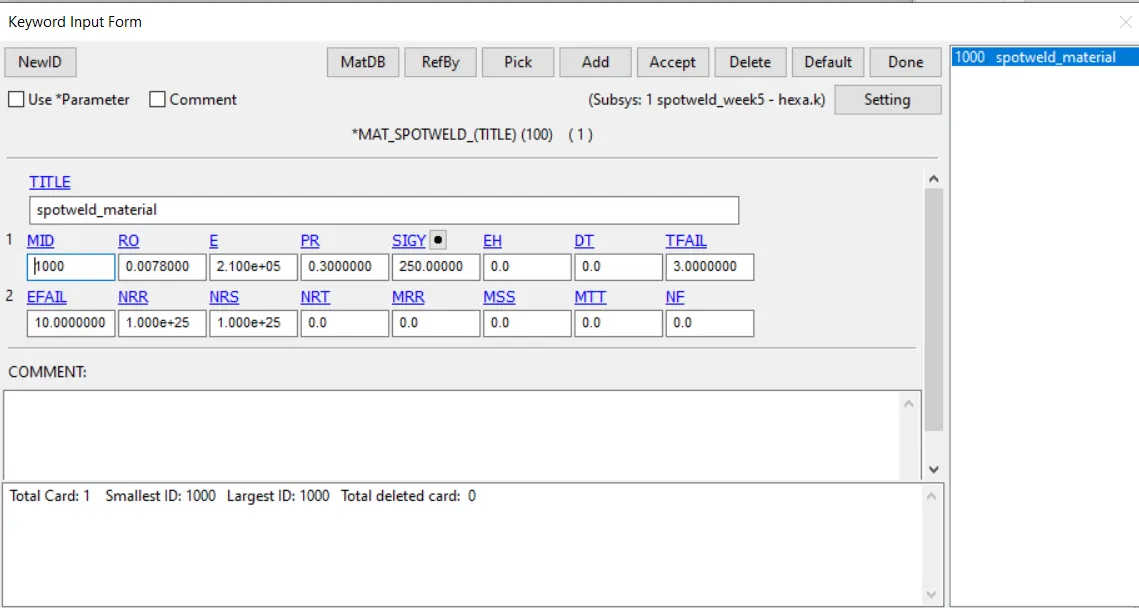
MAT-024-PIECEWISE_LINEAR_PLASTICITY is defined just giving the steels density value, young’s modulus, poisson’s ratio value And MAT SPOTWELD.
- SECTION :
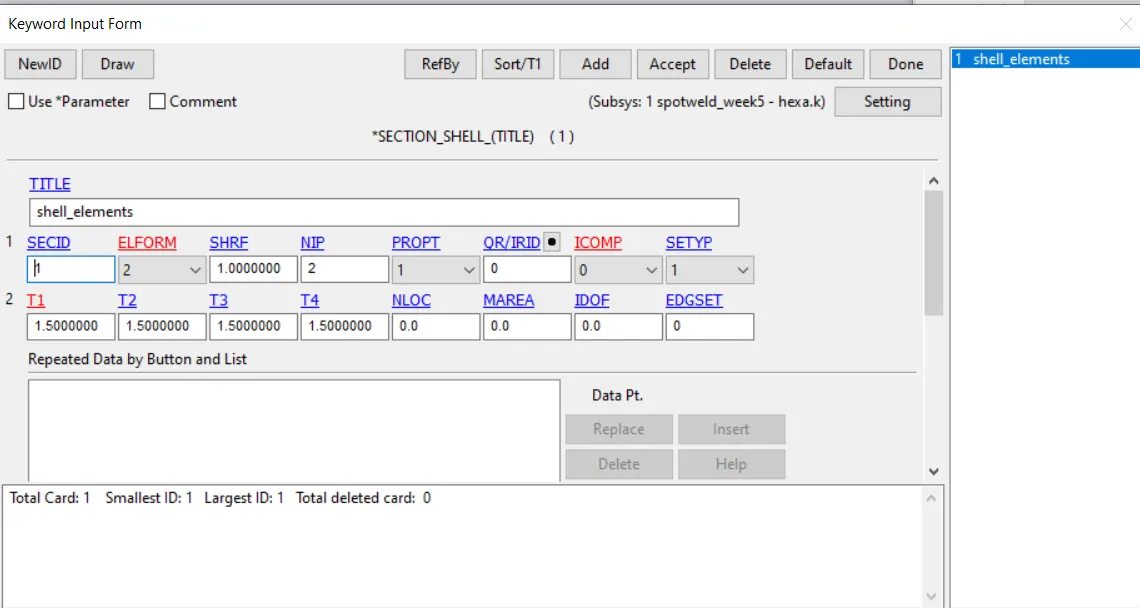
Giving the element formulation and thickness of 1.5mm and defining the section. Solid for hexa elements and beam section beam elements.
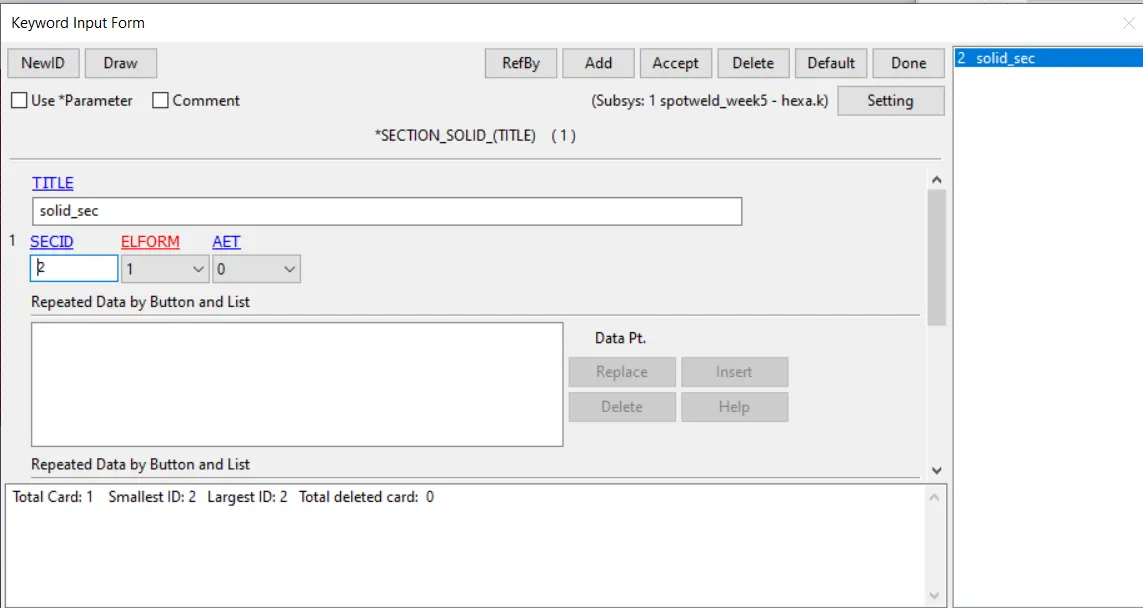
- PART :
Assigning the section and material to the part.
- CONTACT :
Creating the automatic single surface where giving slave segment set id shell set and creating the contact spotweld where slave segment is top and bottom part of the model and master segment is hexa or beam spotwelds.
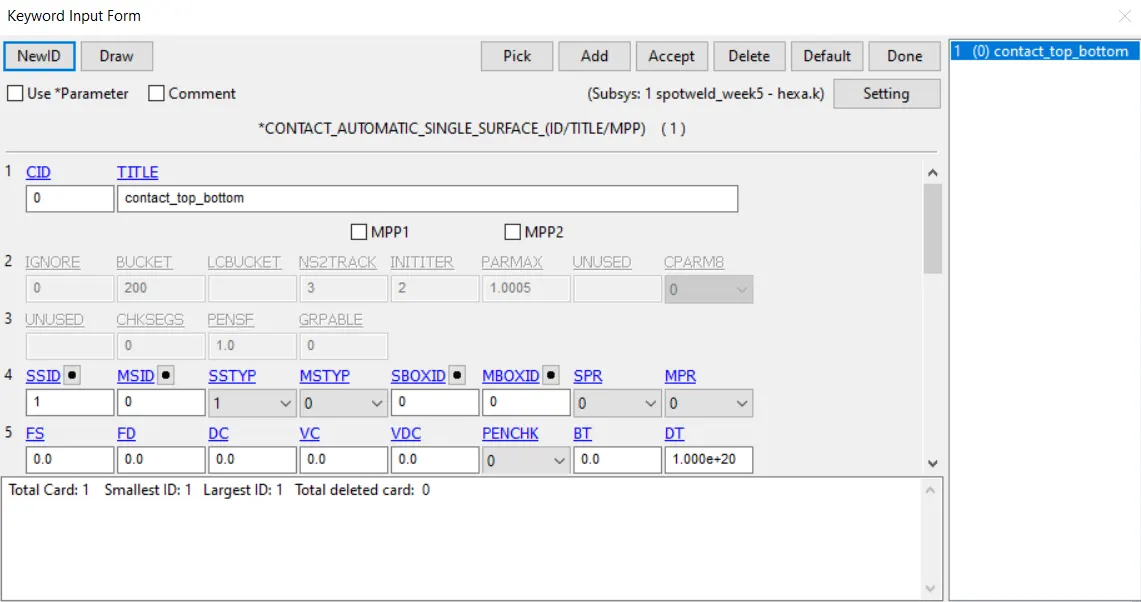
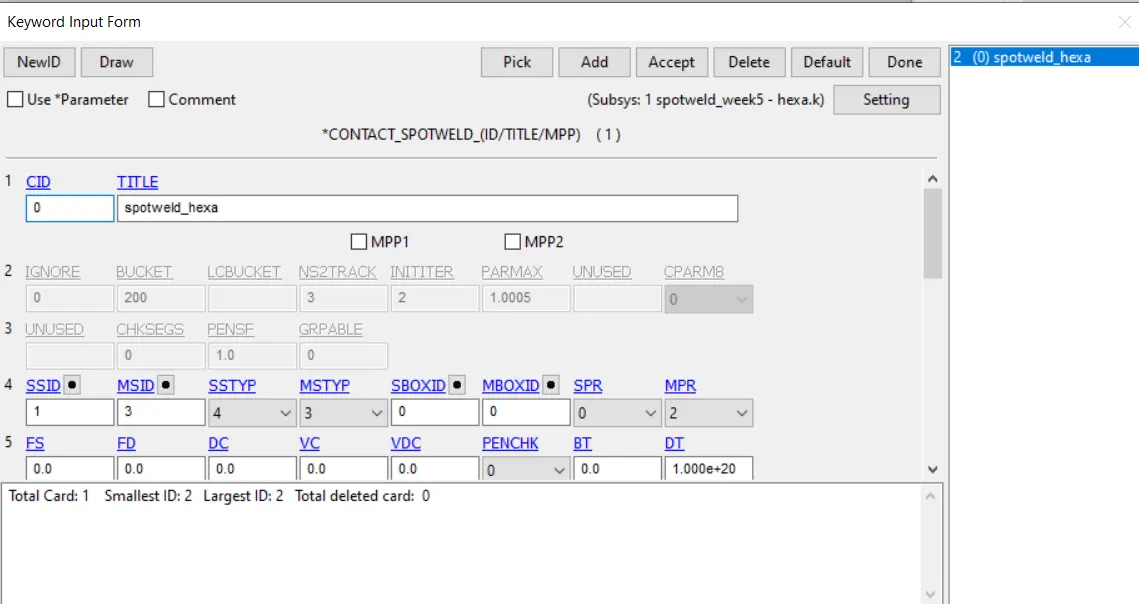
- CONTROL :
Giving the end time value.
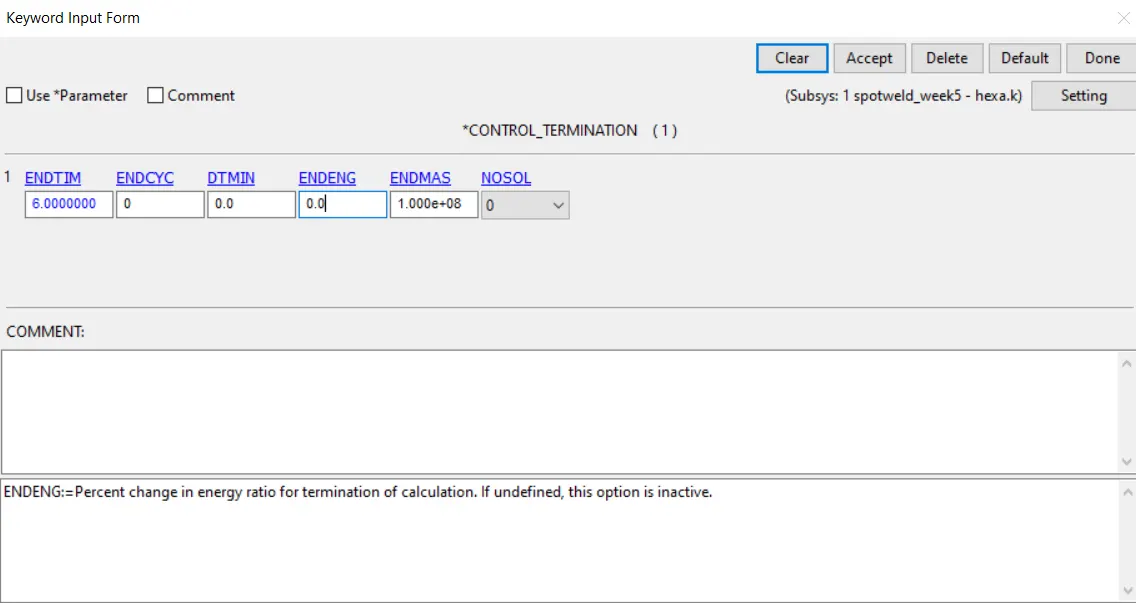
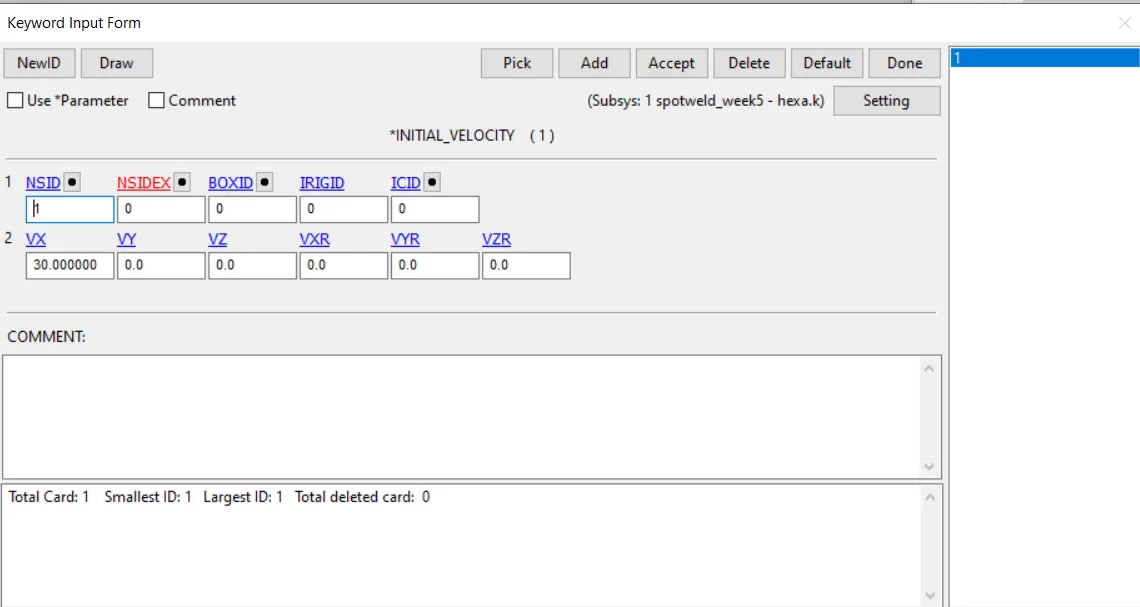
- INITIAL VELOCITY :
Giving the velocity along x axis as 30 mm/ms.
- RIGIDWALL PLANNER :
Creating the rigid planner.
- DATABASE :
Binary d3plot as been chosen to give the time steps and ascii option is used to get the output of SECFORC(Cross section forces data),SLEOUT(Sliding interface energies), GLSTAT (Global stastics), Nodal displacement/velocity/acceleration data), RCFORC(resultant interface force), is chosen to get the output of required with giving the time interval between outputs.
Results :
NOTE: 1st case shown in below images is for Beam connections and 2nd case shown in below images is for Hexa connections.

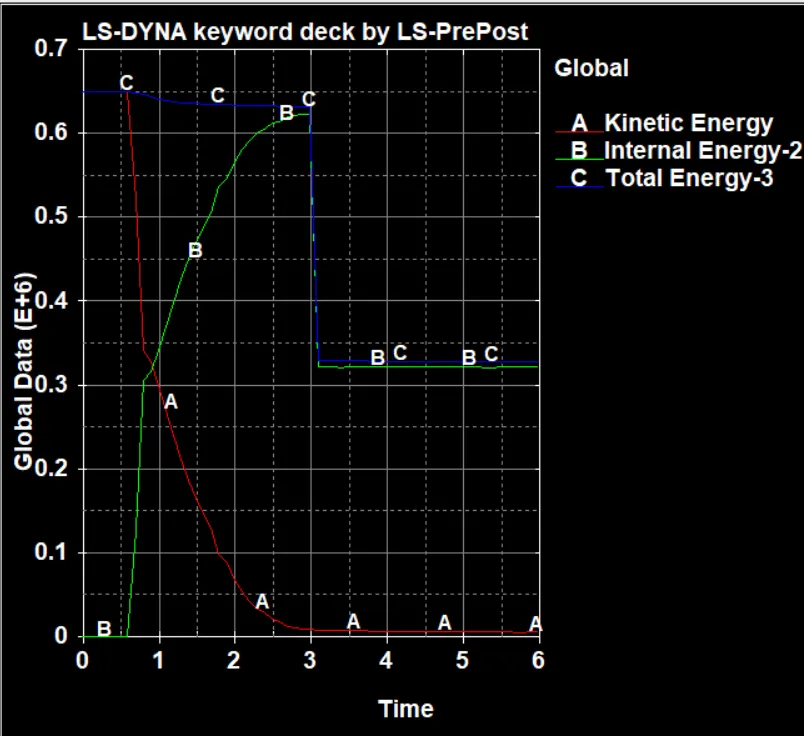
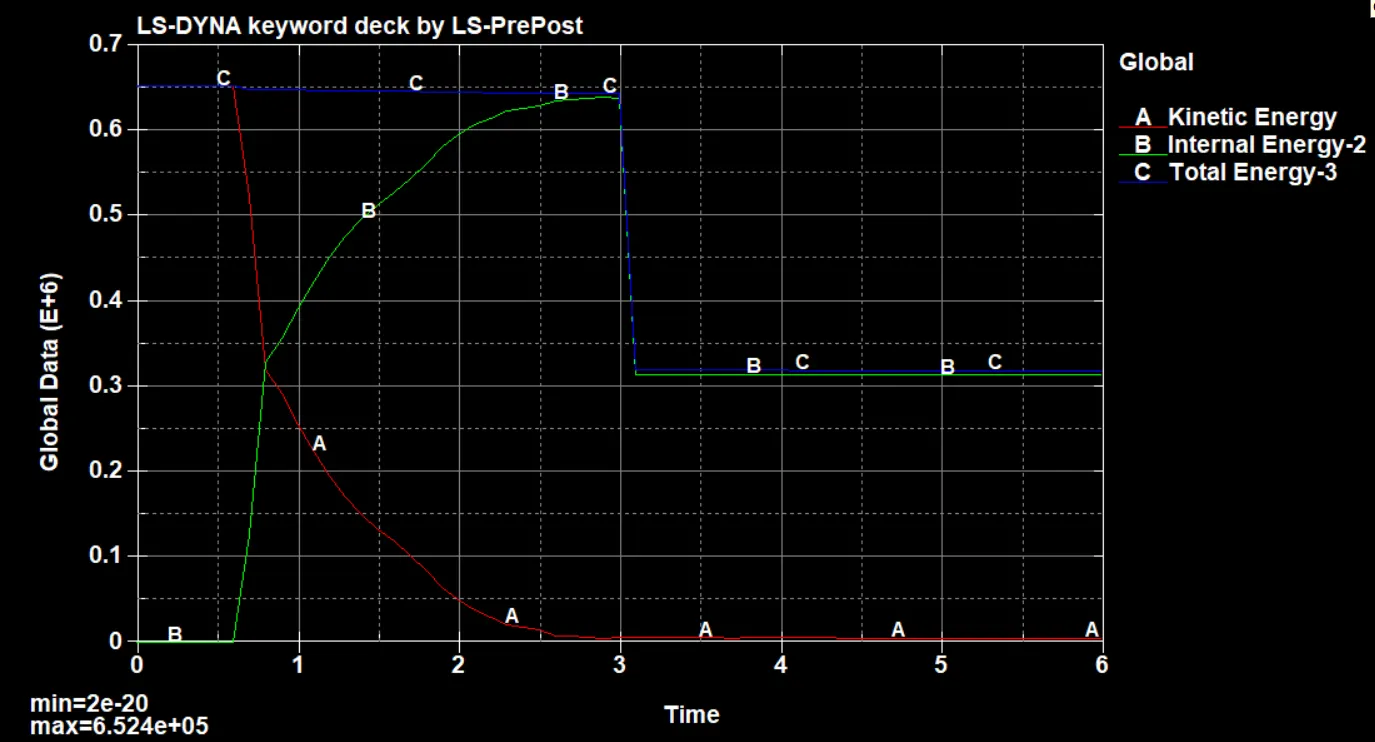
As the above figure shows the global data of K.E , I.E and T E. So it shows the when the model is impacting on the rigid wall the internal energy of the model is going to increase and kinetic energy of the model is going to decrease but when the model is on the time of 3ms the spotweld is going to fail so in that time the internal energy of the whole model is going to decrease.
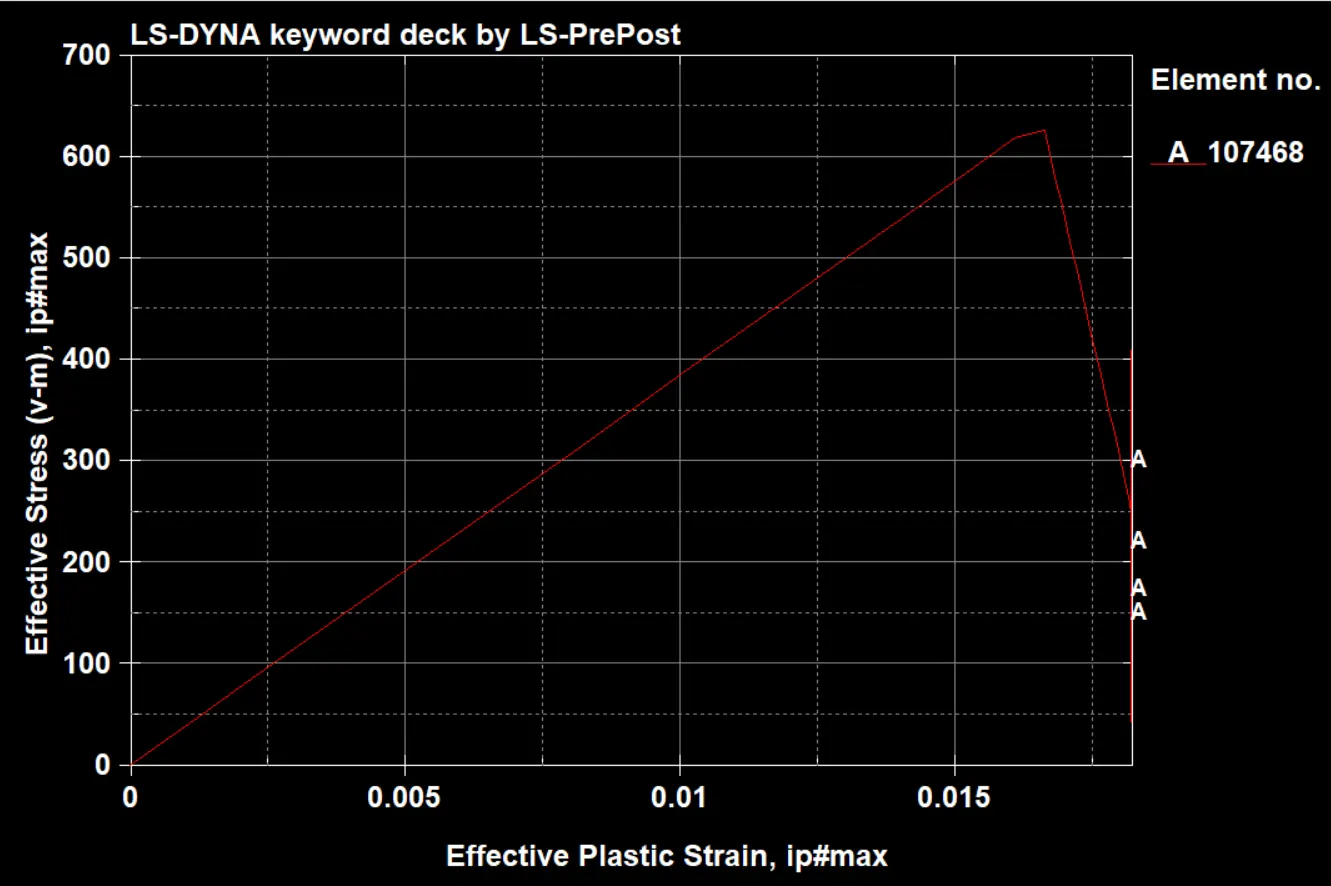
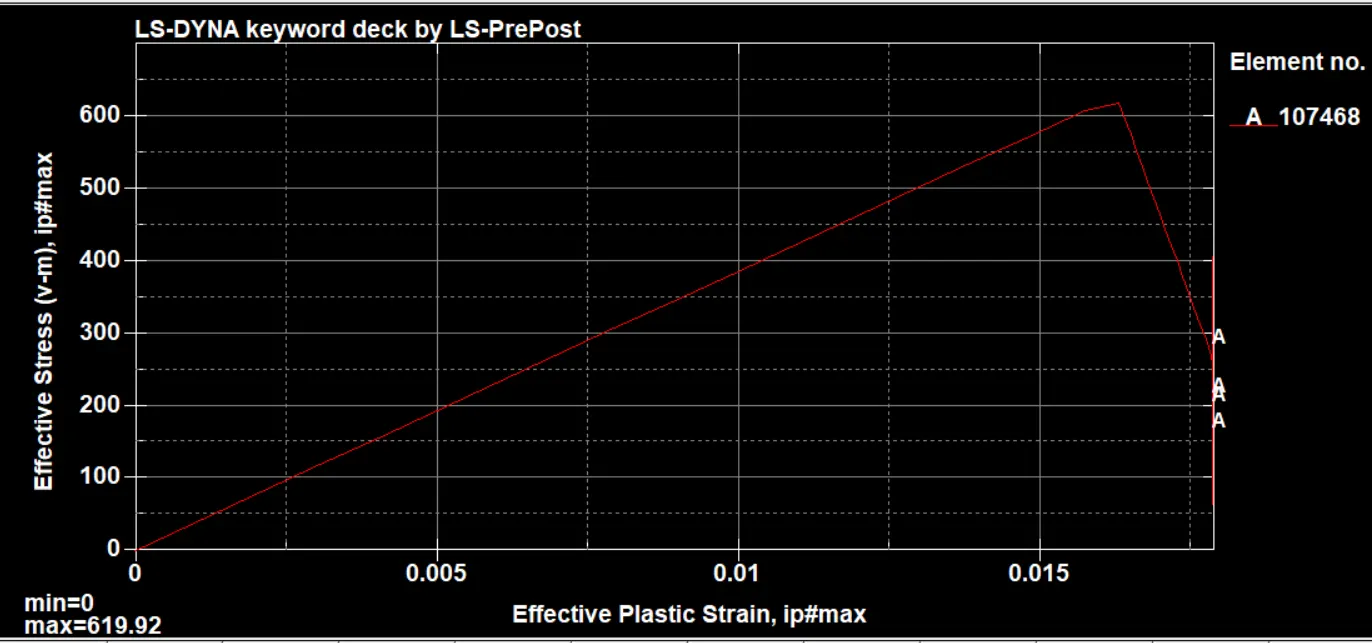
From the above graphs we can see the stress vs strain graph where max stress is 620 N/mm2 and at 0.0017 strain the stress is gradually decresing due to plastic strain
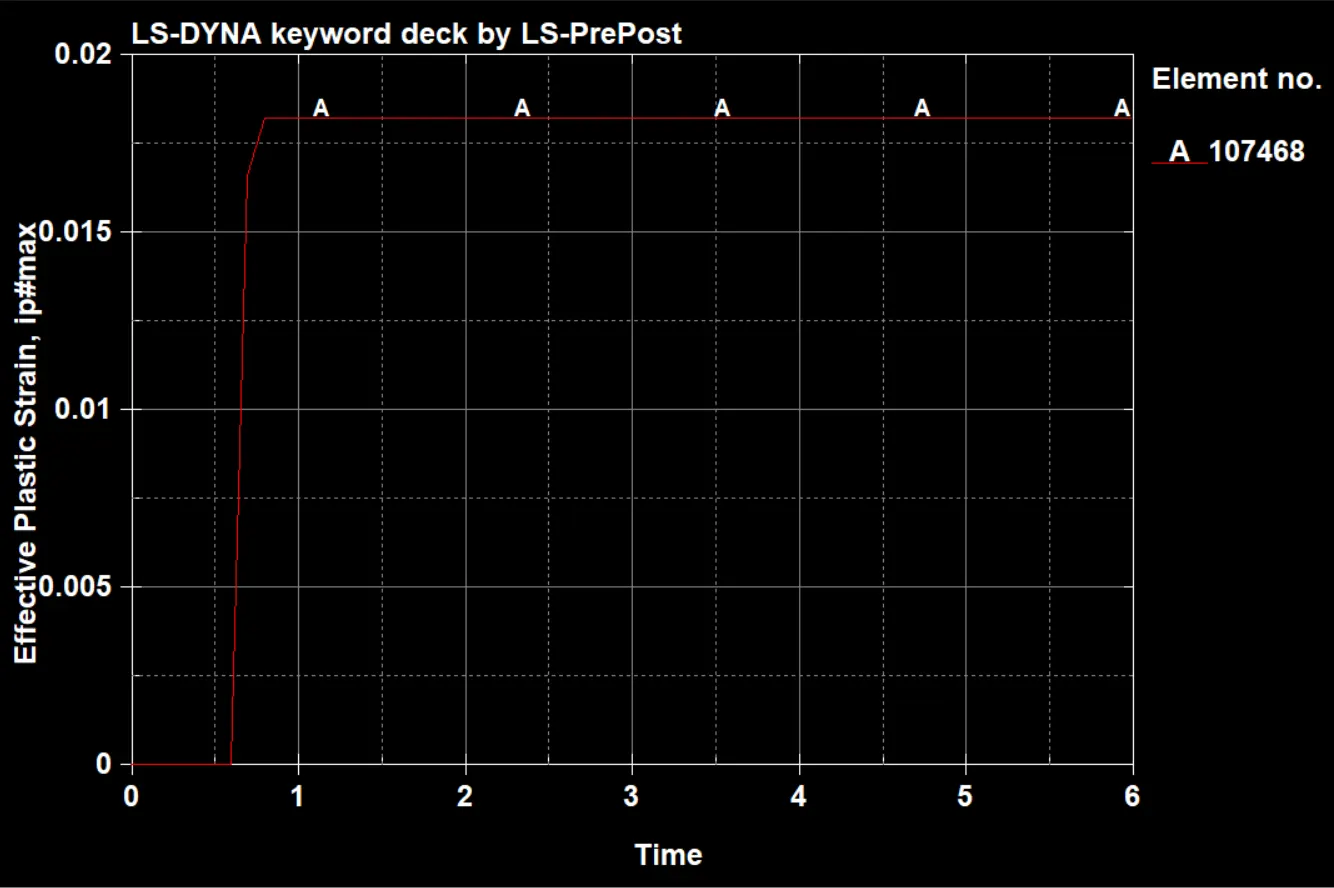
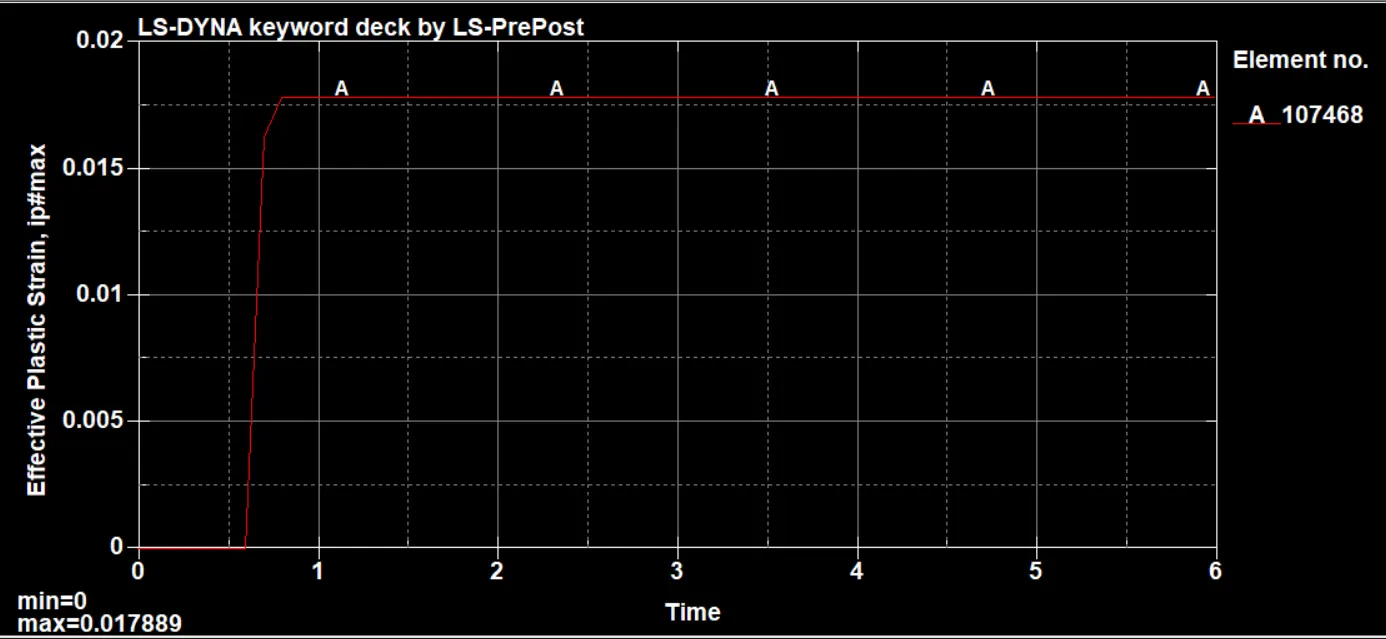
As from above figure we can see that strain is increses from 0 to 0.018 within 0.1 ms i.e, at the time of impact to the rigid wall and it become constant after that.
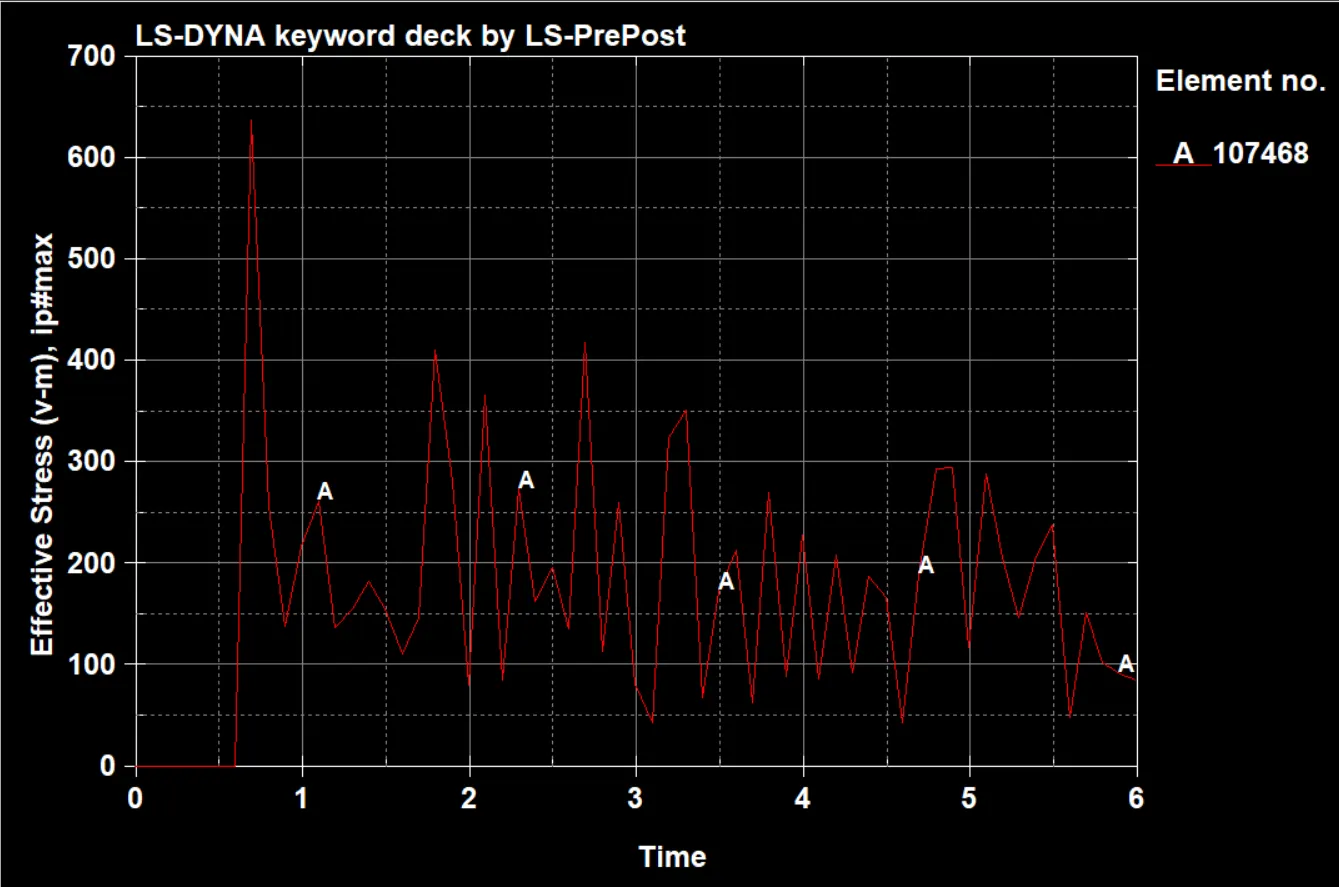
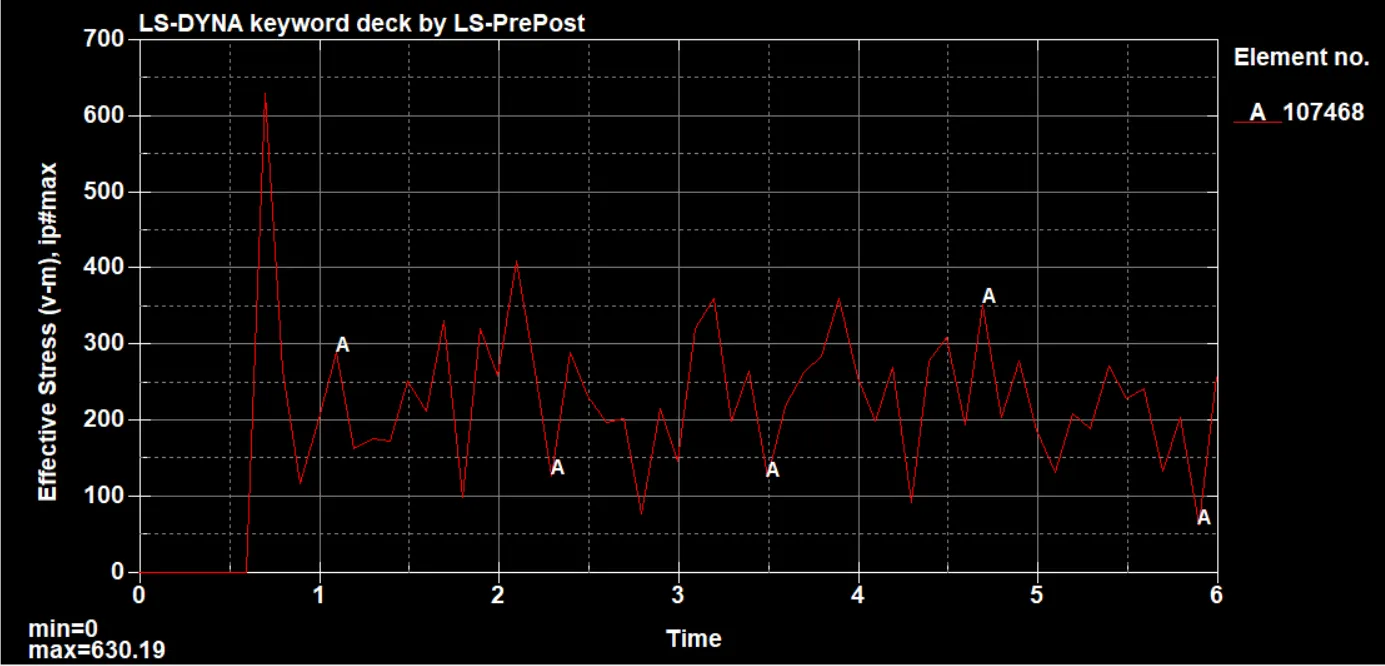
From the above figure we can see the maximum stress of 630 N/mm2 for element 107468
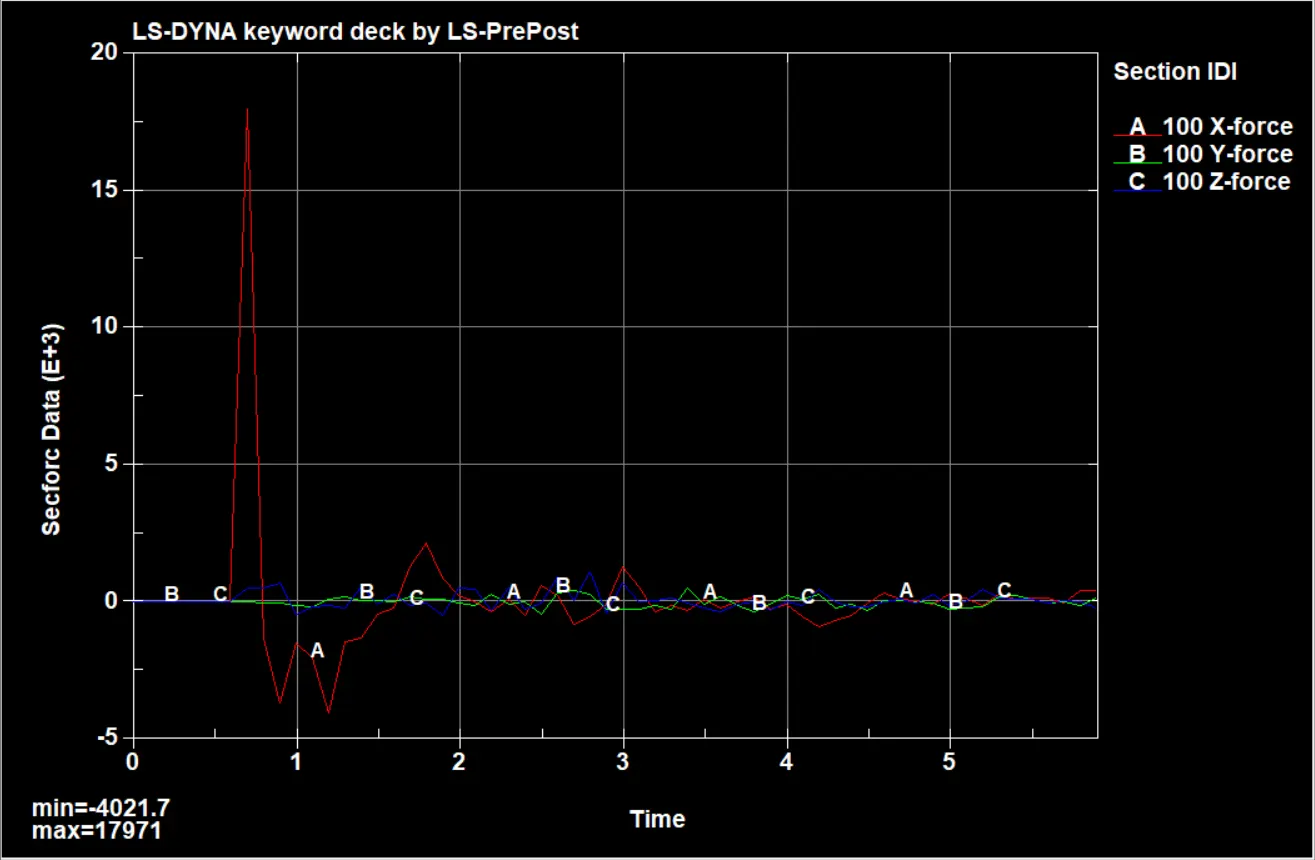
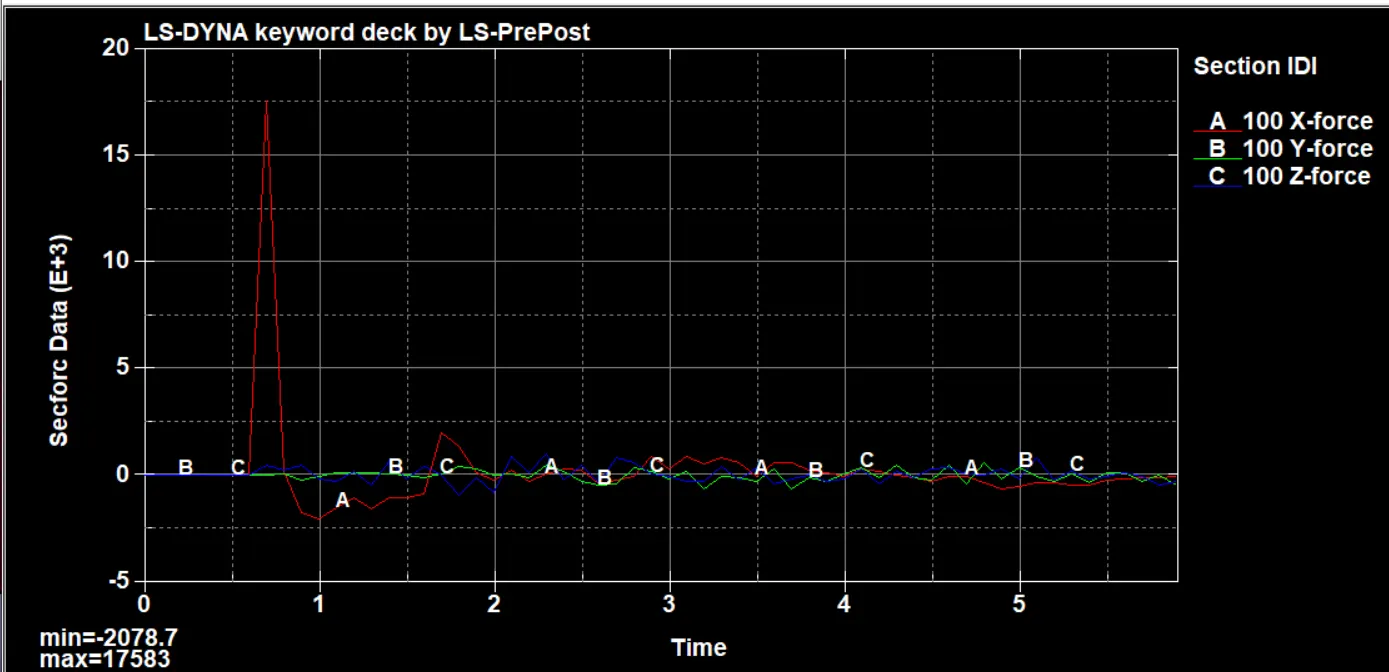
From the above figure we can see the X, Y and Z forces of both the Beam spotwelds and Solid spotwelds
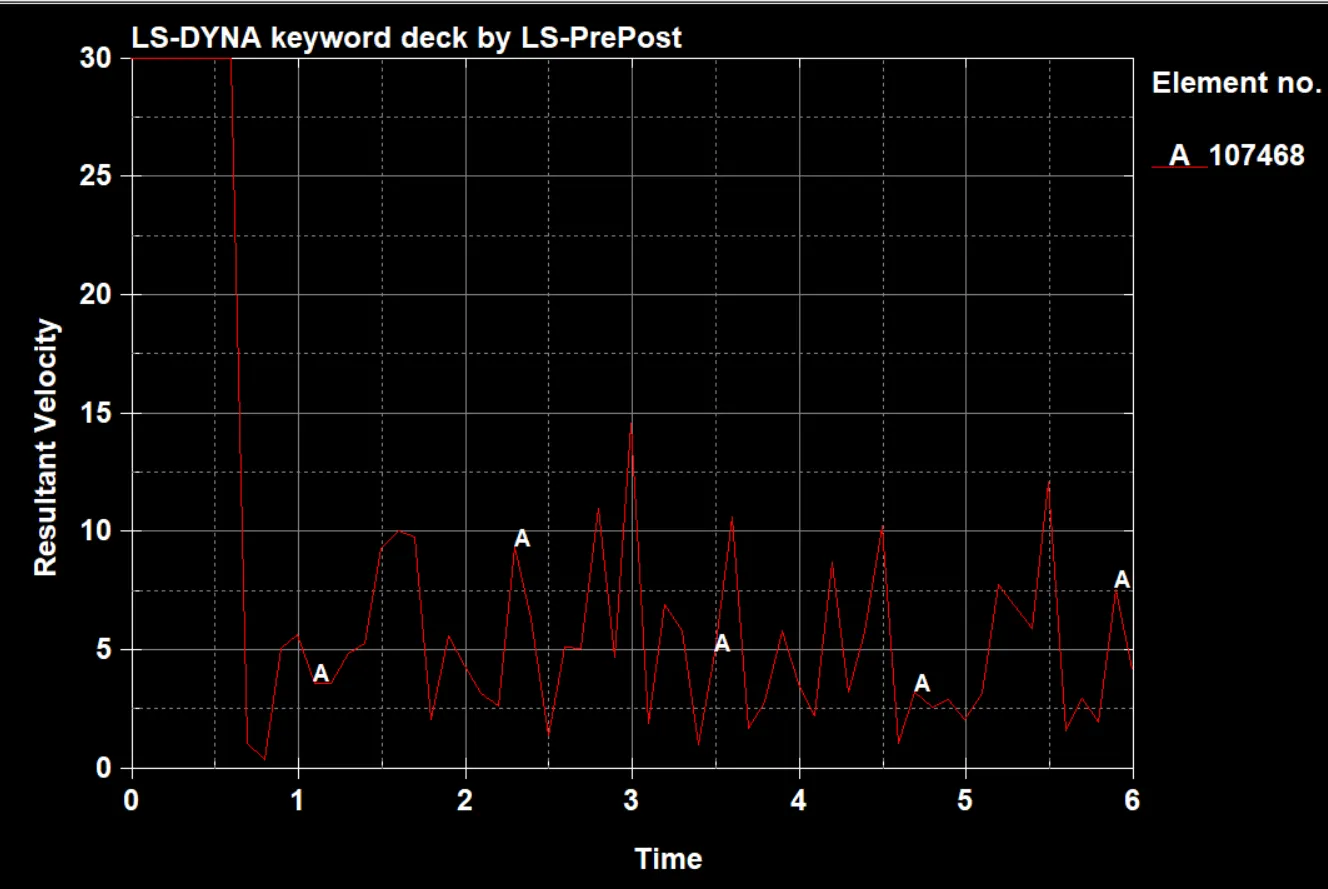
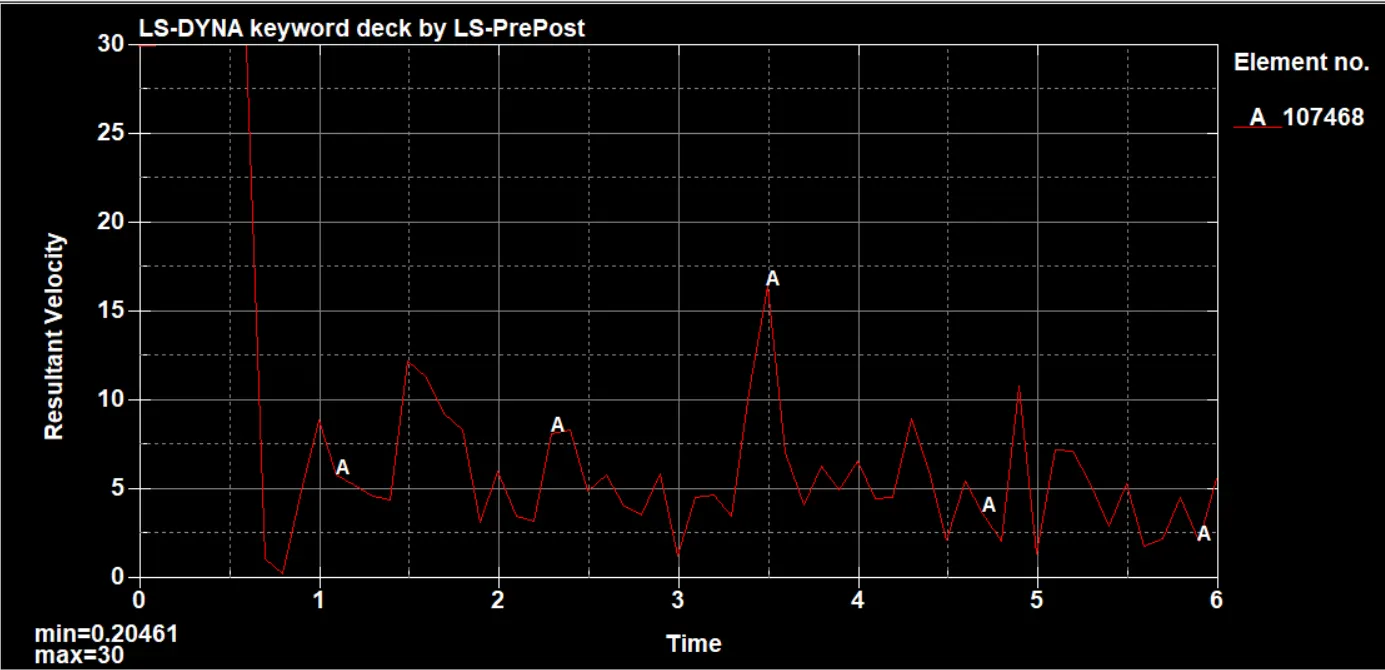
from the above figure we can see the velocity varying where the initial velocity being the 30 mm/ms at the time of impact, velocity is going to decrease
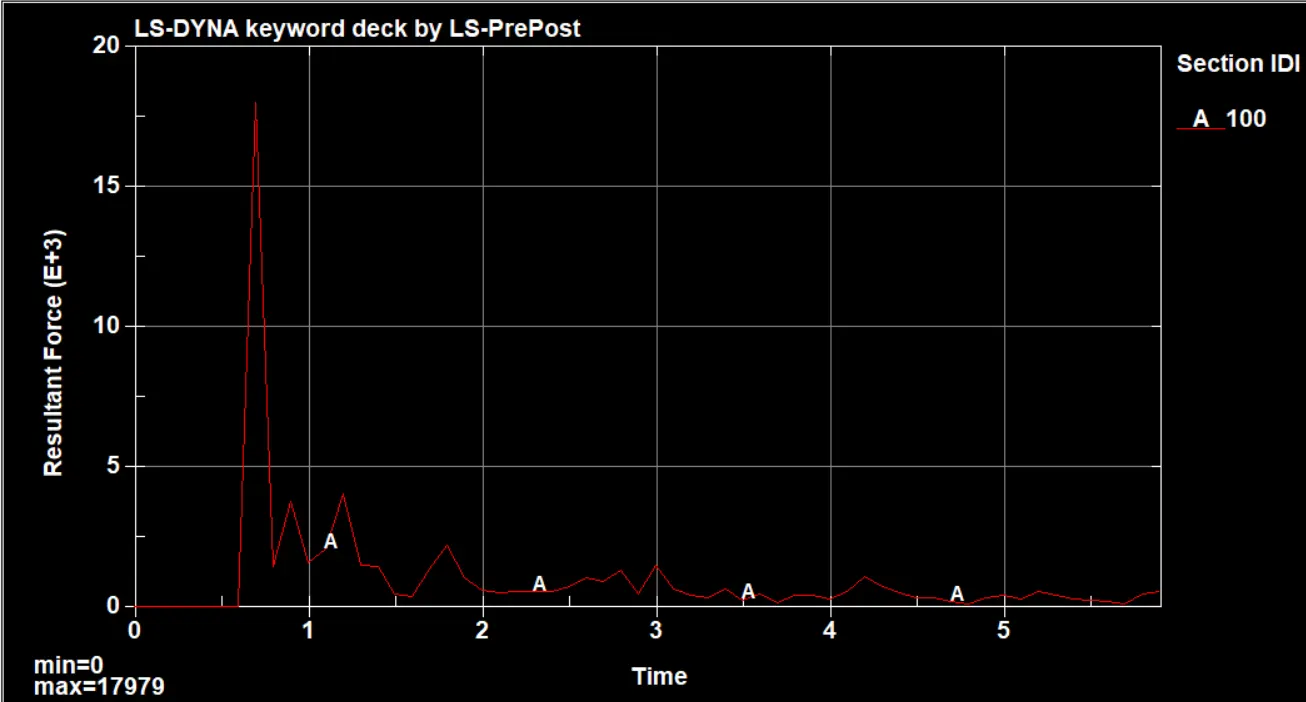
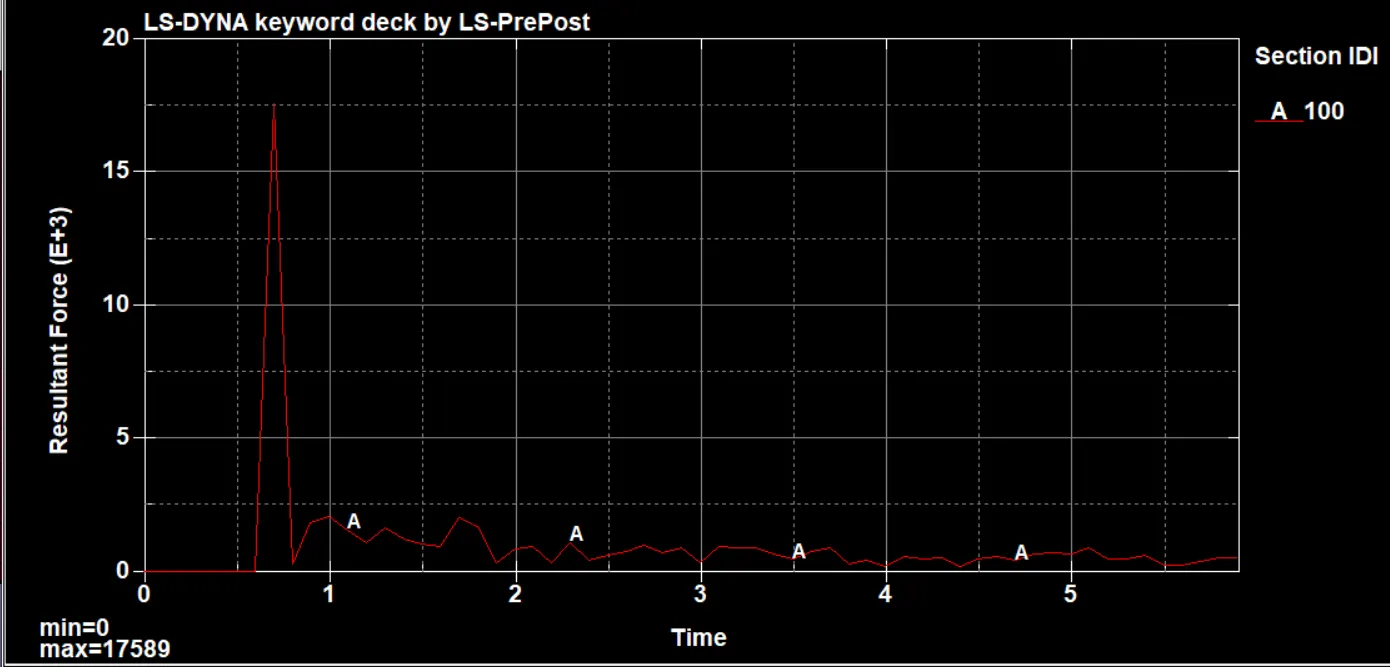
As from the above figure the resultant force will increase at the time of impact to upto 18*e3 N
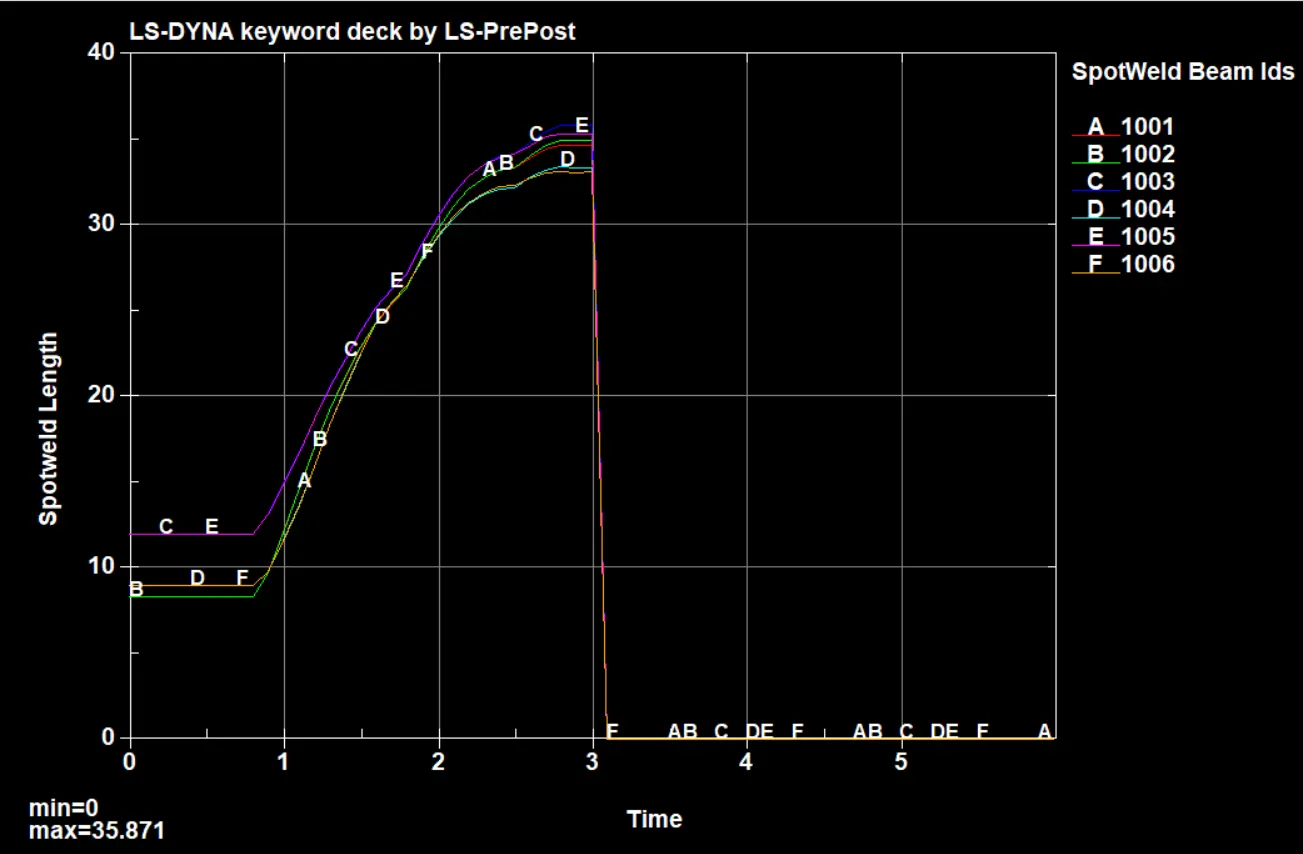
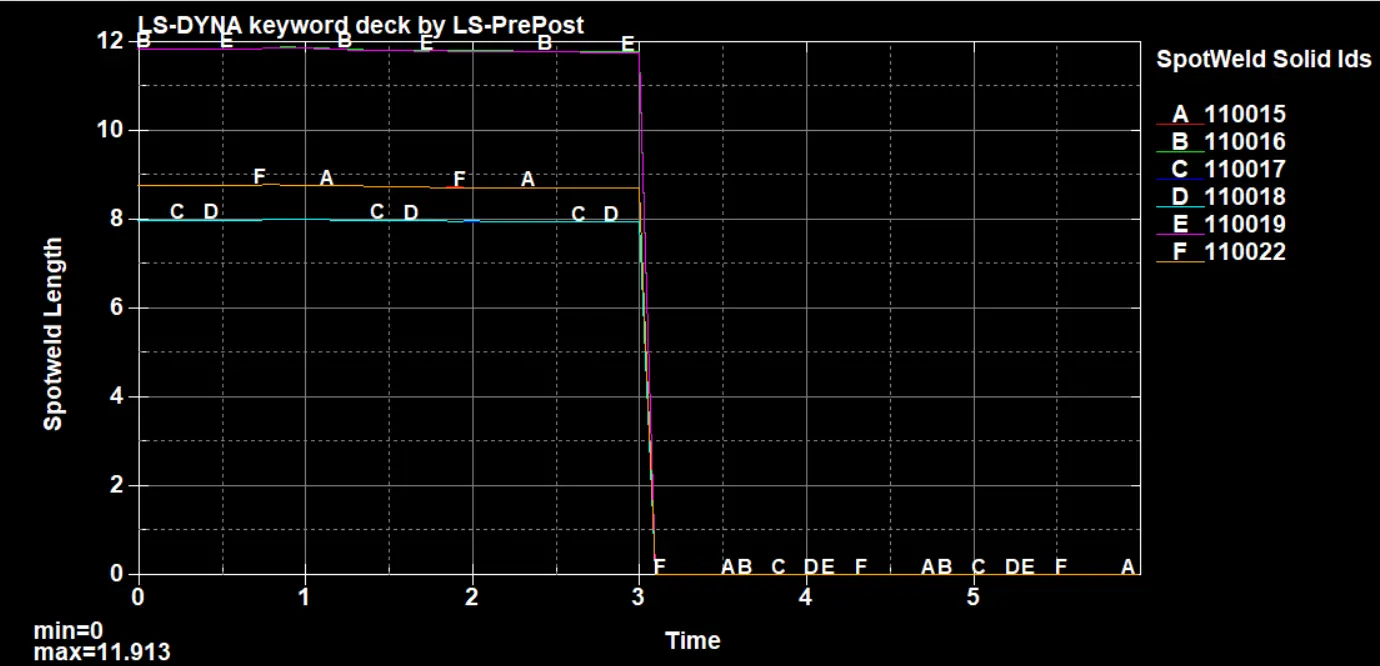
As from the above figure we can see the spotweld length throught the time of simulation where at initial stage the length is around 10 mm but when the simulation progress the length is going to increase for upto 35 mm and at the time 3ms the spotwelds going to fail so at the time of 3ms the spotweld lenth going to reduce from maximunm to zero.
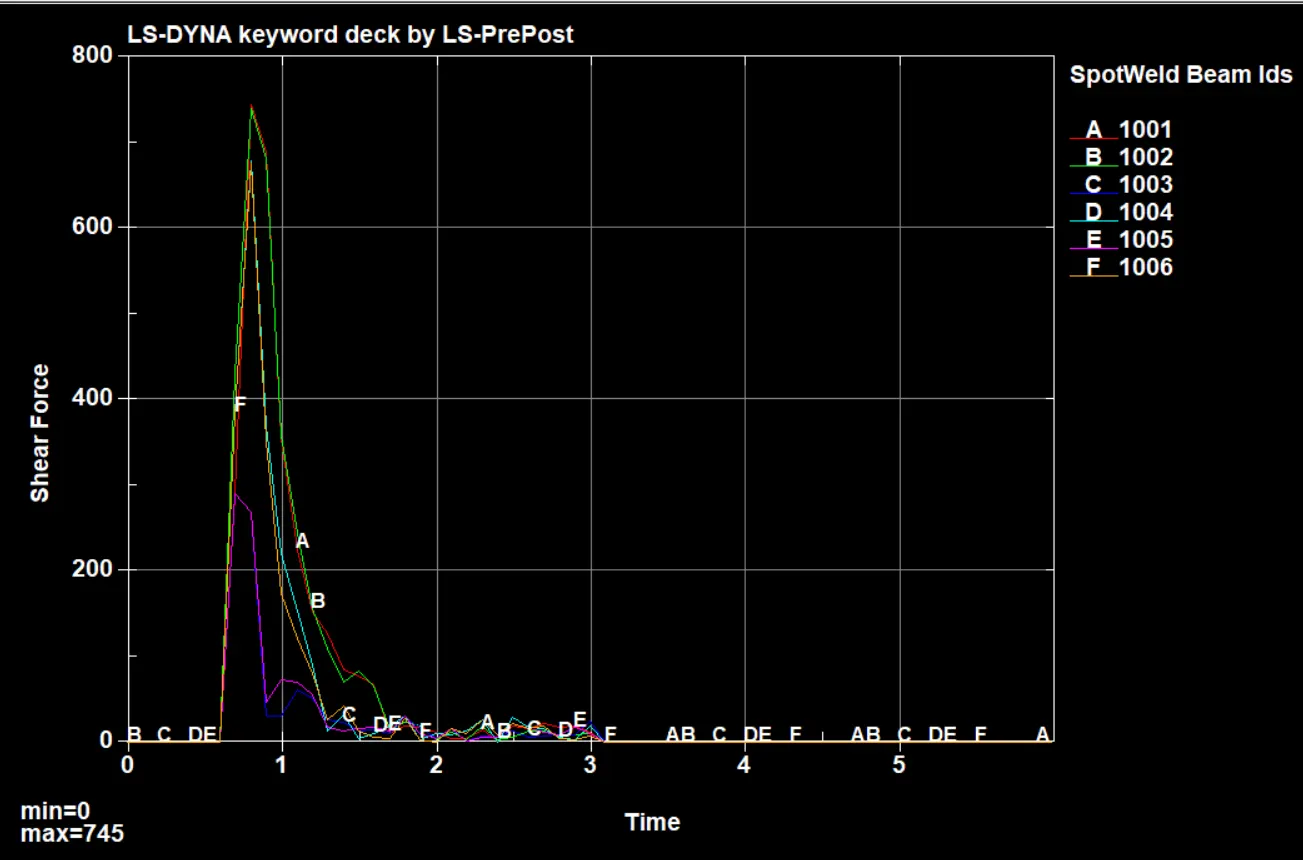
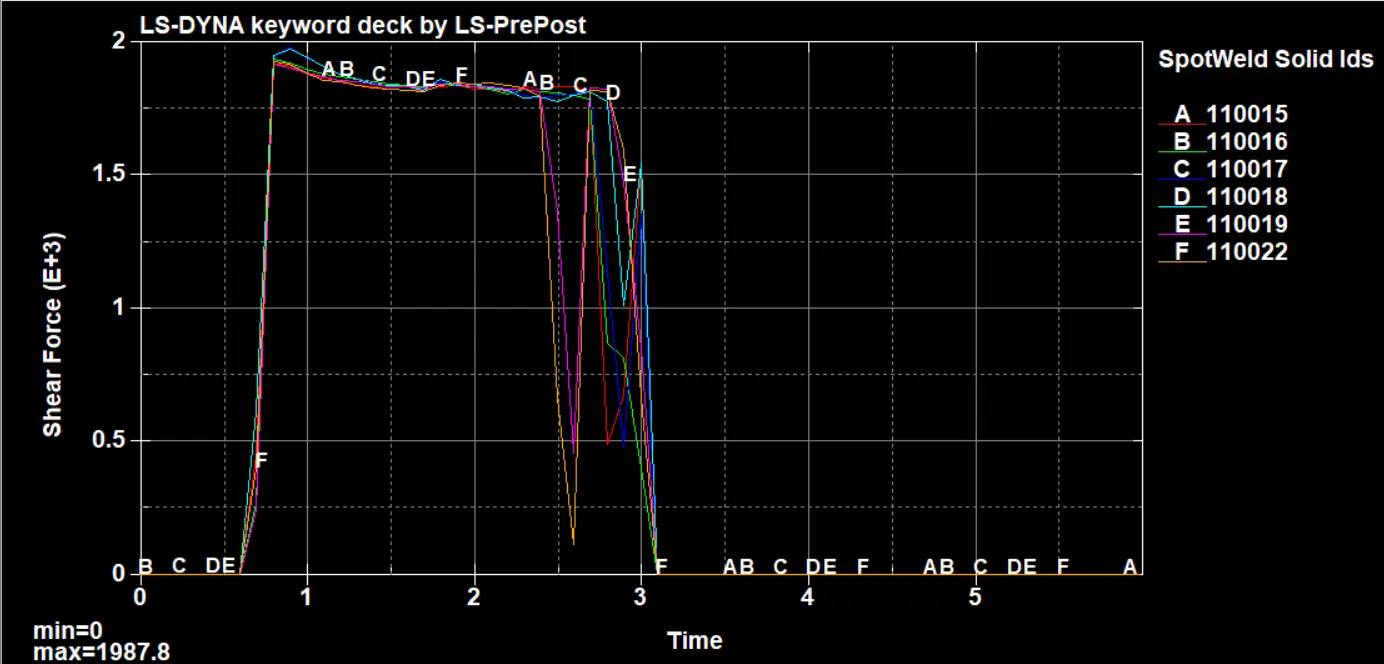
As the above figure shows the shear force of the spotwelds where in the beam type of welds we can see at the time of impact shear force is increases upto 745 N and decreses within a span of 0.5ms and becomes zero at 3ms, where in the solid spotwelds at the time of impact the shear force increses upto 1980 N and become constant until upto the failing of the solid spotwelds.
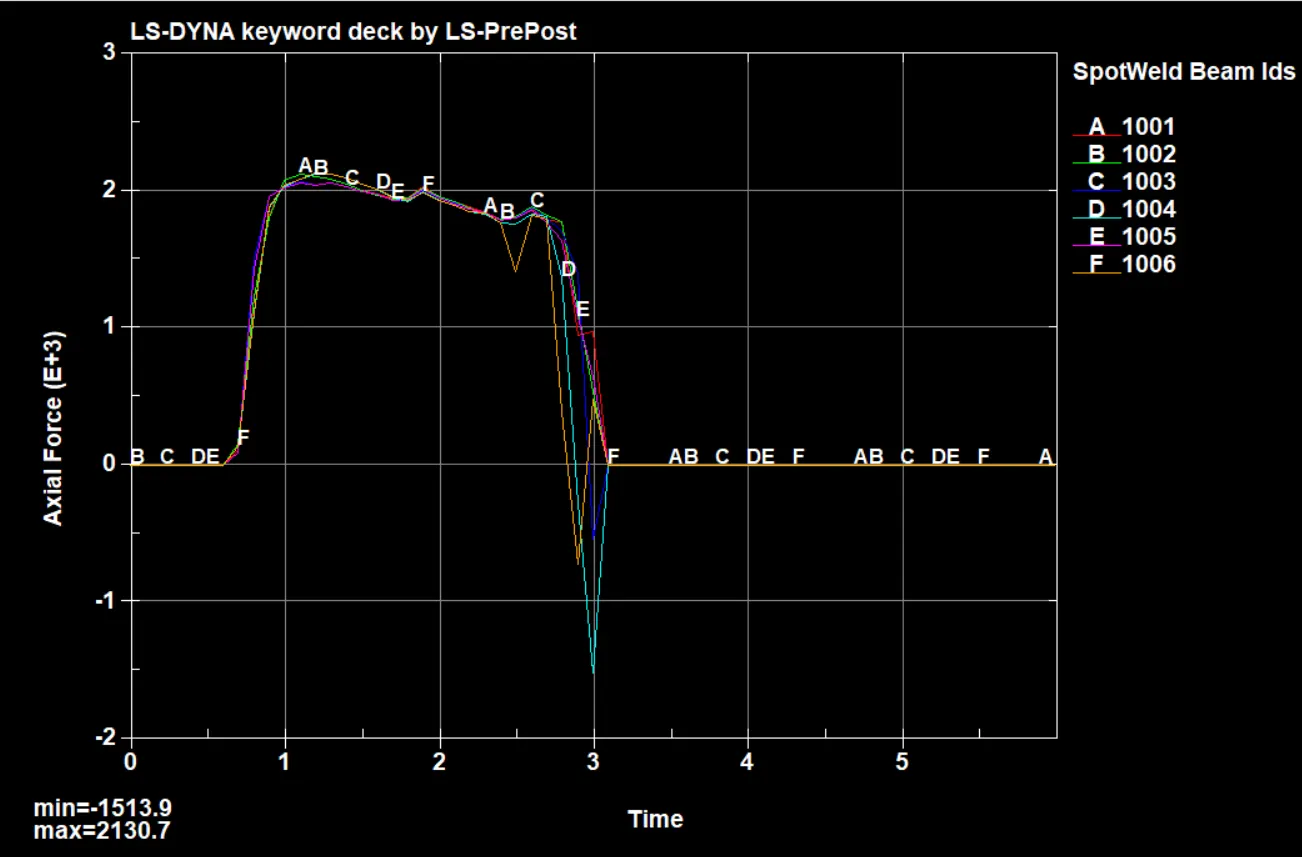
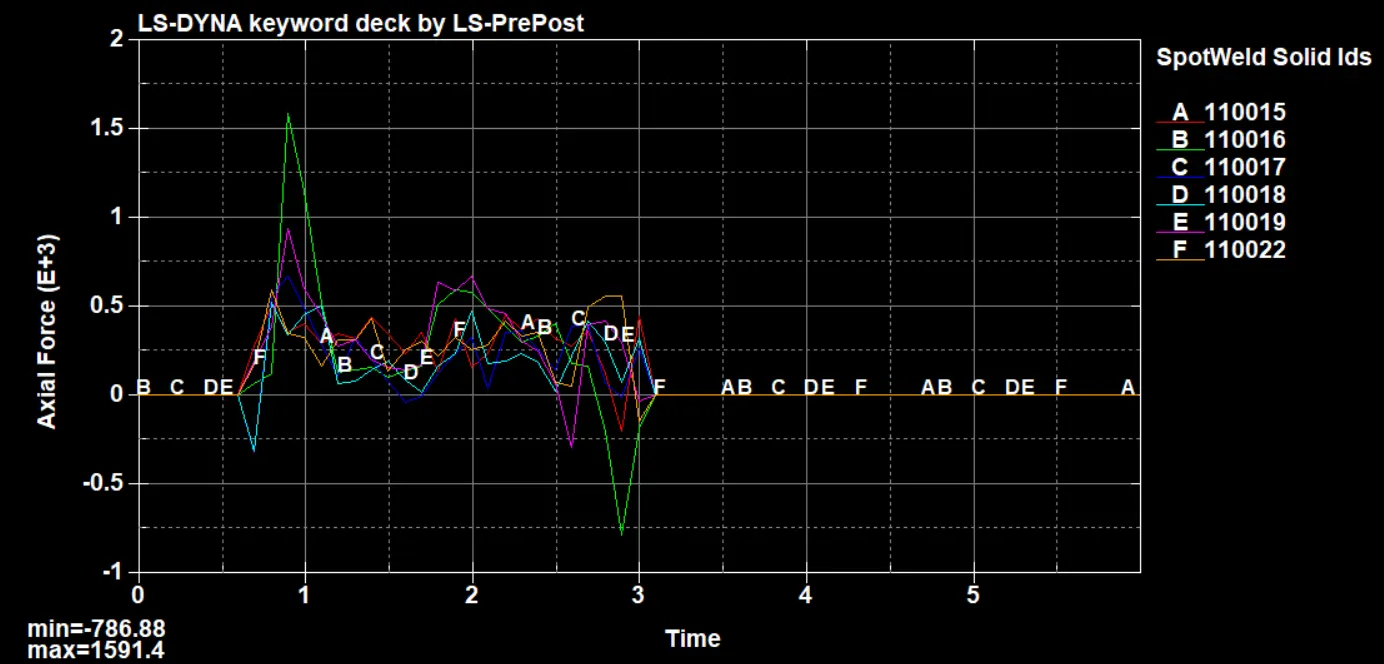
Above figure shows the axial force of the spotwelds.