Week - 5 - Modelling Spotwelds
Modelling of Spot weld in LS-Dyna and study of their failure.
1. Introduction
Spot weld is one of the major joining methods used for making BIW of the vehicles. Spot welding (also known as resistance spot welding) is a resistance welding process. This welding process is used primarily for welding two or more metal sheets together by applying pressure and heat from an electric current to the weld area.
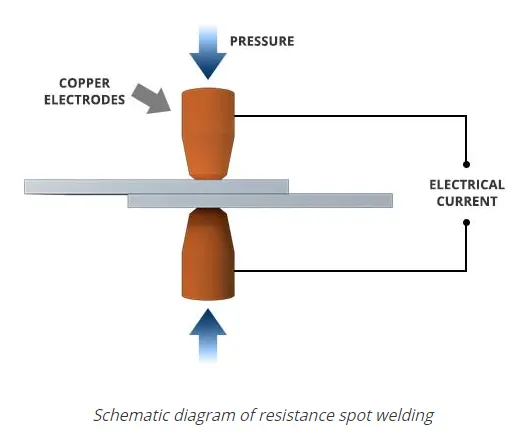
Fig 1.1: The spot welding process
Correct modelling of the weld is important in FE modelling for getting proper results. Spot welds can be represented as 1D rigid elements, beams or solid Hexa elements in FE modelling. In this exercise, a crash test was performed on a pair of channels joined together with the help of spot welds. The details are explained in the following sections.
2. The Geometry
A key file containing meshed models was provided as an input file for the challenge and modelling of materials, rigid wall and spot weld connections were needed to be performed. The modelling of spot weld was performed using 1D beam elements and then using hexa (solid) elements. The axial forces and shear forces developed in the spot weld elements were compared for both; 1D and solid elements.
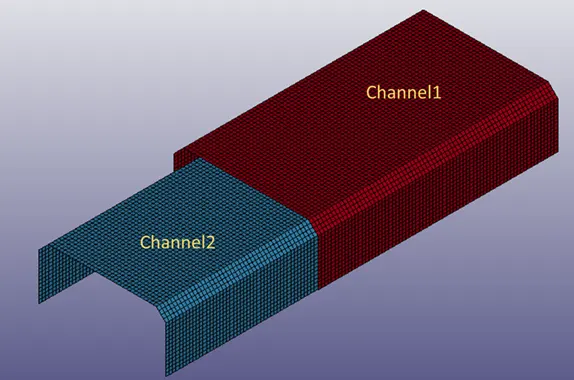
Fig 2.1: the provided meshed file
First of all, materials were modelled using 'elastic' and 'spot weld cards'. The Mat_001_elastic card was used to model steel for both channels. The unit system followed in the modelling was [g-mm-ms] so all the values are put accordingly as shown in the attached figure.
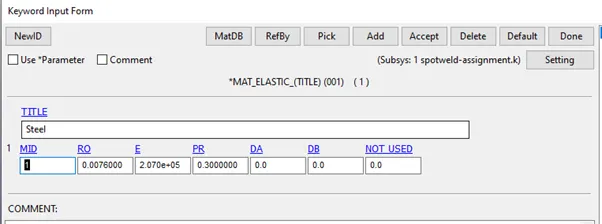
Fig 2.2: The Mat_001 Elastic card used for modelling steel.
Next, another material was modelled using Mat_100 material card and it was used for all the spot weld elements.
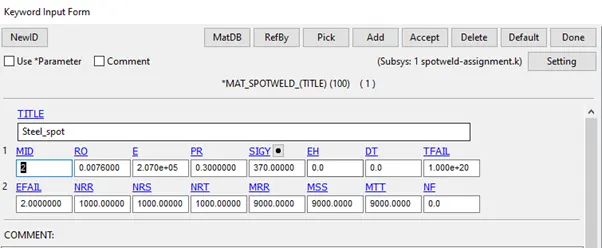
Fig 2.3: The Mat_100 material card used in modelling spot weld material
TFAIL value dictates the time for failure of the spot welds in case, time-based failure of the elements is needed in the model. In this case, we did not want a time-based failure so this value was kept pretty high. The EFAIL value tells about the strain at which we want the weld elements to fail. In our case, it was kept at 2 which translates to 200% elongation of the elements. This particular value was kept high again for the same purpose, i.e. we did not want it to become the failure criteria for the spot weld elements. The values in the NRR, NRS and NRT boxes represent the Axial force, shear force and the Resultant force at the time of failure of the elements. Similarly, MRR, MRS and MTT values represent the bending and torsion moment values at the failure of the elements. The values shown in figure 2.3 were used as initial values to check the failures of the elements in the first run.
After that, the spot weld elements were modelled as beam elements using the ElemGen tool available in the mesh module of the LS Pre-Post. The Blank option available in the element tool menu was used to hide elements for selecting the appropriate nodes.
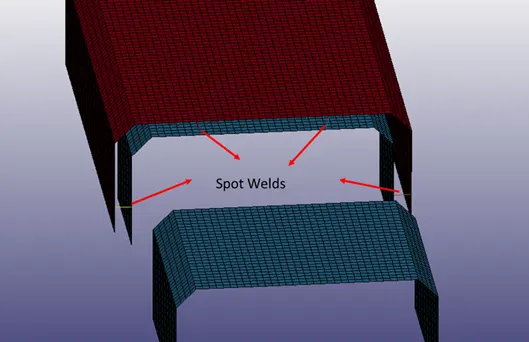
Fig 2.4: the spot welds modelled with 1D beam elements.
As clear from the above picture a total of four spot weld elements were used of connecting the two parts.
Then all the four elements were moved into a single Part ID as we intended to assign similar material and section properties to all of them. After that, section cards were created for the shell and the beam elements present in the model.
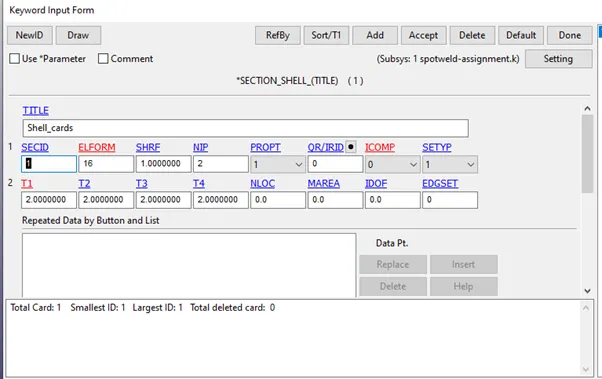
Fig 2.5: the shell section card used to assign properties to the channels.
A shell thickness value of 2 mm was assigned arbitrarily to the channels and Element formulation 16 was used.
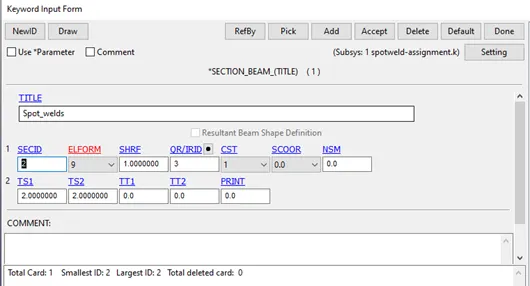
Fig 2.6: the beam section card used for modelling of section properties of the weld elements.
In the section card for beam, one needs to take care of the element formulation, only ELF 9 is allowed with Mat_100 Spot weld card. Cross-section type was set to tubular for the beam elements by setting the value to 1.
Then these section and material properties were assigned to the parts appropriately.
After that, the contact was modelled between the beam elements and the shell elements of the model. The Tied contact shell edge to the surface card was used to model the contact. The channels were made as master and the beam elements were made as slave. This was achieved by putting in the part set containing both channels and a node-set containing all the nodes of the weld elements in master and slave boxes. Apr from this another contact card namely automatic single surface was used for both the plates, this was done to prevent one channel from penetrating into another during deformation.
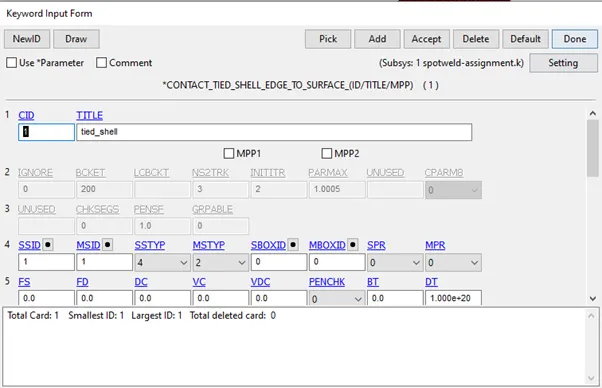
Fig 2.7: the tied shell edge to surface contact card used for modelling the contact between beam elements and the shell elements.
Then we need a rigid wall to which the channels are going to crash. This was done using the create entity option as shown in the attached figure.
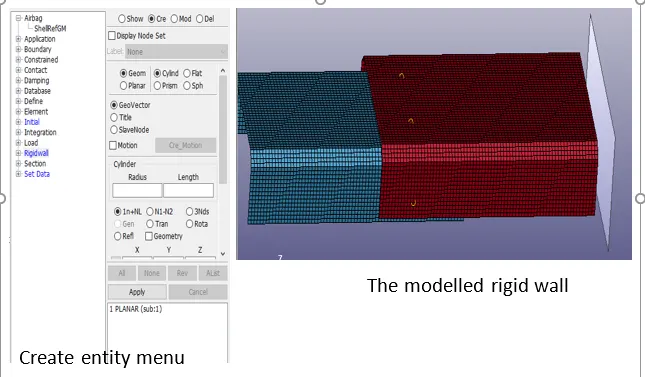
Fig 2.8: modelling of the rigid wall for performing the crash test
After that, we need to provide velocity to the channels so that it would crash into the rigid wall. This was done using the initial velocity option available in the create entity tool. A velocity of 50 [ kmph] which becomes 13.889 [mm/ms] was given to all the parts in the model as shown in the attached figure.
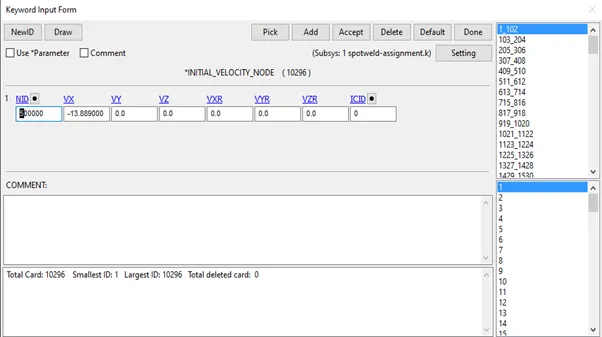
Fig 2.9: The initial velocity card used in the model.
Then a control card was used to define the total simulation time of 10 [ms]. The control >>Termination card was used for this purpose.
- Output requests
In LS-Dyna one needs to put in the output requests in the LS Pre-Post which are needed as an outcome. Binary D3 Plot was requested at an interval of 0.1 [ms]. The ASCII option was selected from the database keyword and the following outputs were requested at an interval of 0.1 [ms].
- GLSTAT
- MATSUM
- ELOUT
- SWFORCE
The SWFORCE keyword records the forces developed in the spot weld elements during the simulation.
- Simulation 1 results and discussion:
Video 5.1: The animation of the crash test
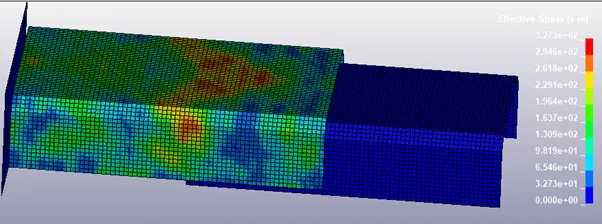
Fig 5.1: The stress plot on the channels
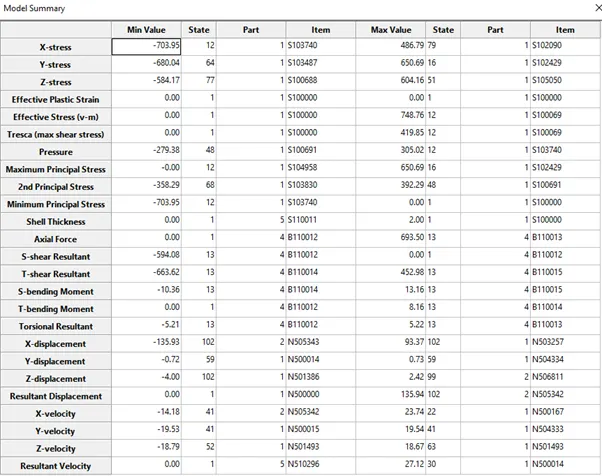
Fig 5.2: The model summary for the simulation
As clear from the above figure, the maximum stress (Von-Mises) was 748.76 MPa which is more than the yield strength of the material and it was developed in some shell elements. But there is no deformation visible, this is because of the material card used for shell elements. An elastic material card was used with steel properties for the shell elements of the model and a better picture could have been obtained by using the MAT024 Piecewise linear plasticity model. Again, the deformation in the channels was not of primary concern for us, we were interested more in the failure of the spot weld beam elements.
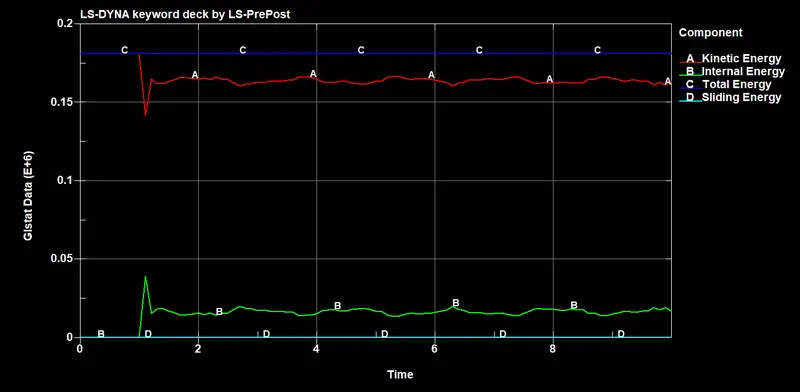
Fig 5.3: Energy plot of the model.
The total energy of the model remains constant and sliding energy is very low, which means the results are good to go with.
Axial force and the shear force in the beam elements:
The axial force and the shear forces developed in the beam elements can be recorded with the help of the SWForce keyword in the ASCII options menu.
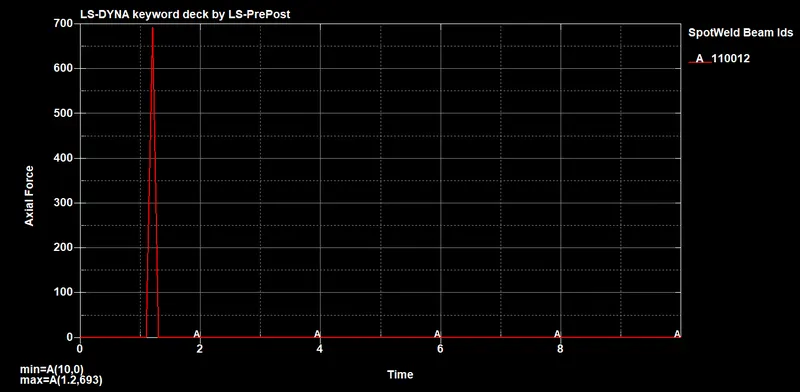
Fig 5.4: The plot of axial force developed in one of the beam elements.
The maximum value of 693 N matches with the max value of the axial force from the summary table. Also, the failure happened at 1.2 [ms] as clear from the plot. So we can say that the failure was not due to axial force and also simulation time of 2.5 [ms] will get us the failure at half of the run time.
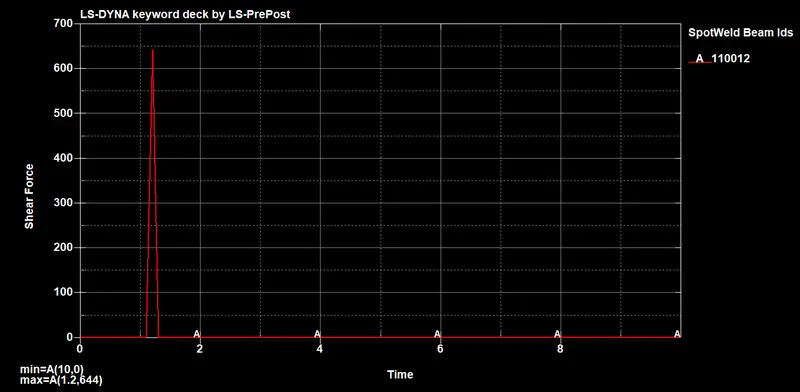
Fig 5.5: The shear force developed in the beam elements
Again a max value of 644 N denotes that the failure was not due to shear force.
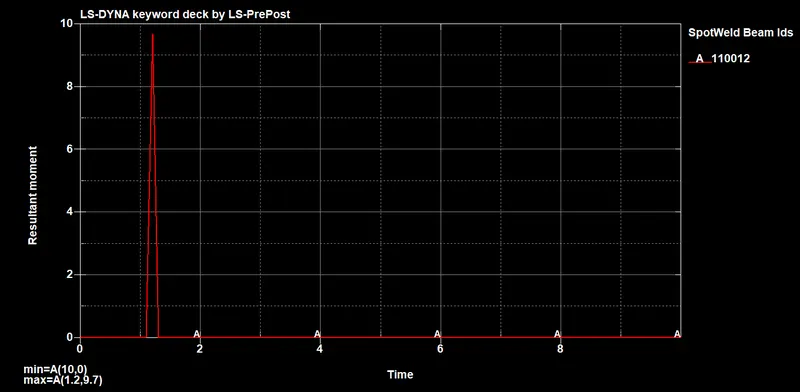
Fig 5.6: the plot of resultant moment developed in the beam elements
This plot again shows a very low maximum value of the moments so it was not a bending failure as well.
All of this indicates that the failure was because of strain. We have put criteria of failure at strain 2 which translates to 200% elongation.
After running this simulation, the runtime was reduced to 2.5 [ms] in the termination card and the failure values were adjusted as shown in the attached figure.
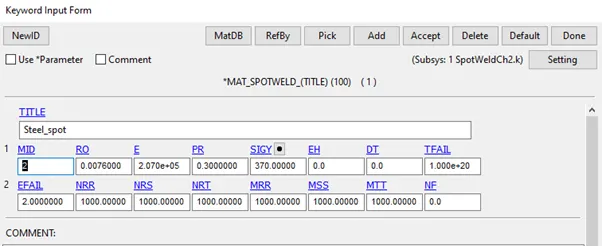
Fig 5.7: the modification to the failure data
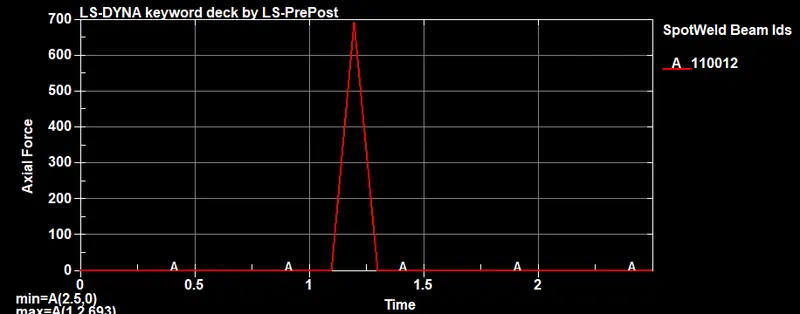
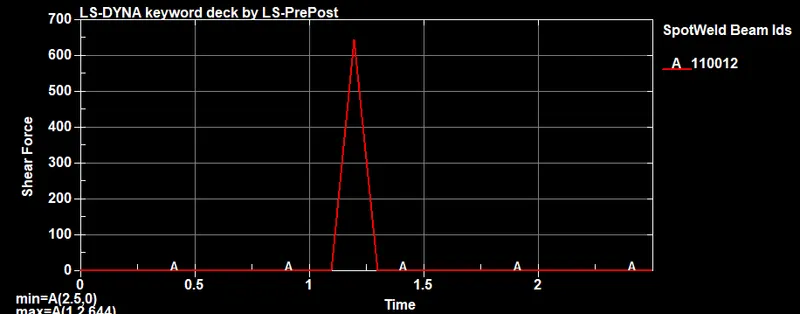
Fig 5.8: the plot of axial and shear forces with modified data
As clear from the above plots, the failure was approximately at the half time of the simulation, our purpose is served and we are good to go for the next part of the exercise.
- Modelling of spot weld elements as solid elements
This time the spot weld elements were modelled as hexa elements instead of 1D beam elements. Solid elements present much more clear picture of events in terms of forces developed inside the elements. This is primary due to the fact that the beam elements can take the load in only one direction.
A group of four hexa elements were used to represent one spot weld, this is in accordance with the usual representation of spot weld with solid elements.
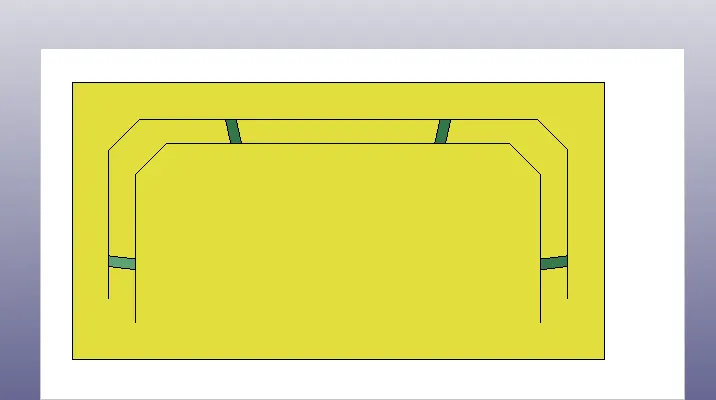
Fig 6.1: The hexa weld elements modelled for spot weld
All the data was the same except the contact card; this time the contact spot weld card was used for modelling the contact. Master was defined using part set containing both the channels and the slave was defined using the part ID of the solid elements.
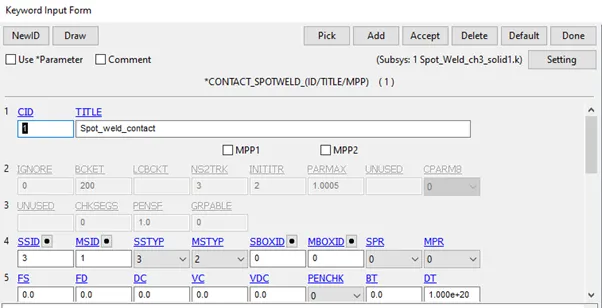
Fig 6.2: the contact spot weld card used for modelling of the contact
Also, a solid section card was used to define section property for the solid elements as shown in the below-attached figure.
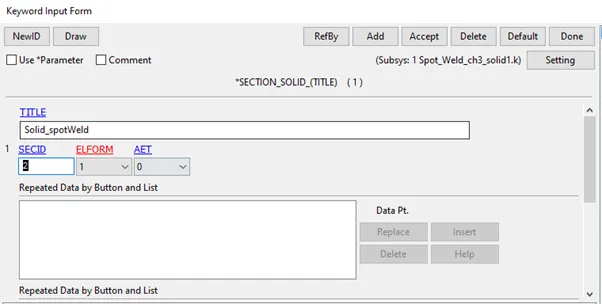
Fig 6.3: the solid section card used for modelling the section property of the solid elements.
Results and discussion
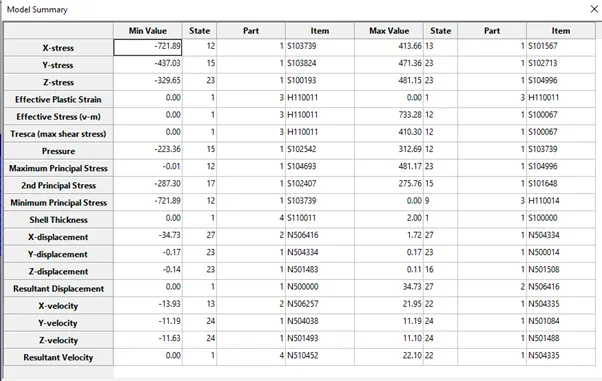
Fig 6.4: The summary of the simulation using solid elements for spot weld
The values obtained in this case are far below the one obtained in the case of beam elements. It can be attributed to the fact that in the beam element the connectivity was between two nodes while in solid hexa elements it is between four nodes. This means the load is better distributed and solid modelling is a better way than beam modelling for spot welds.
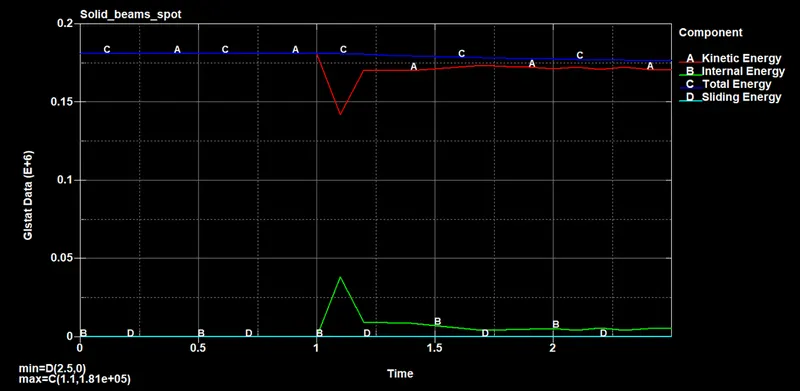
Fig 6.5: The plots of different energies
The plot shows that total energy was almost constant and sliding energy was negligible which indicates that the modelling was ok.
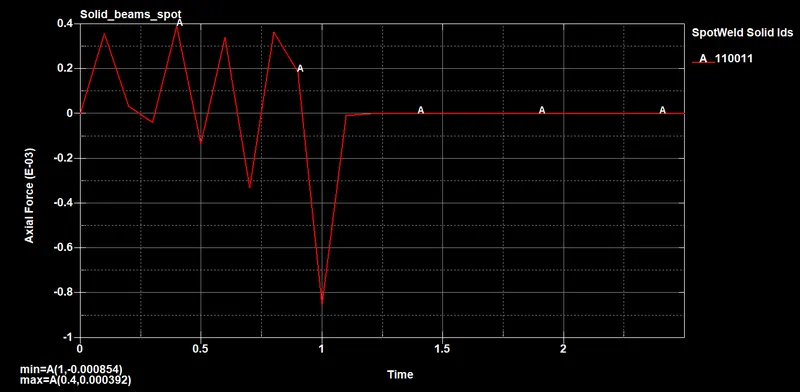
Fig 6.6: The axial force plot for spot weld modelled as hexa element
Very low force values are again indicative of the fact that the section properties have improved as compared to the beam element.
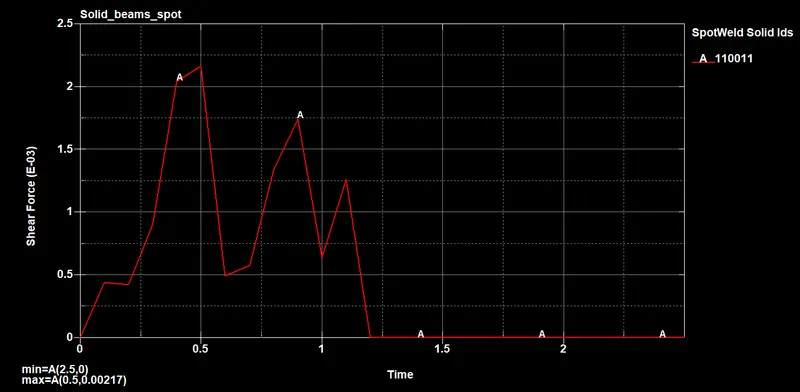
Fig 6.7: the plot of shear force in the solid element used to model spot weld
Again the low values of force is apparent in the plot and it’s in agreement with our conclusions from previous sections.
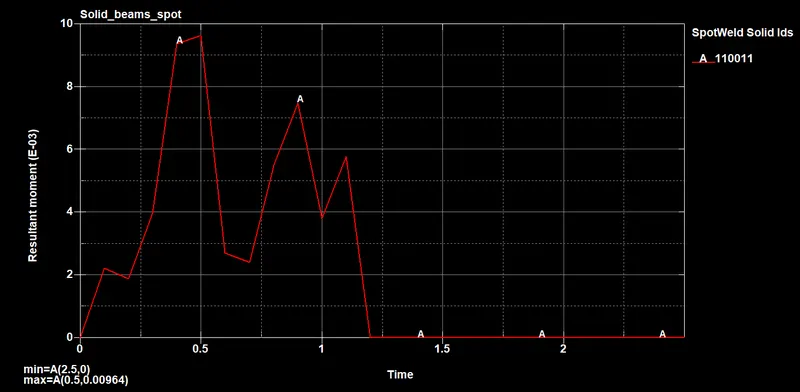
Fig 6.8: the plot of resultant moment on the solid element used for modelling spot weld
The noisy plots do not clearly show the time of the failure so a plot of failure data is presented below to show the estimated time of failure.
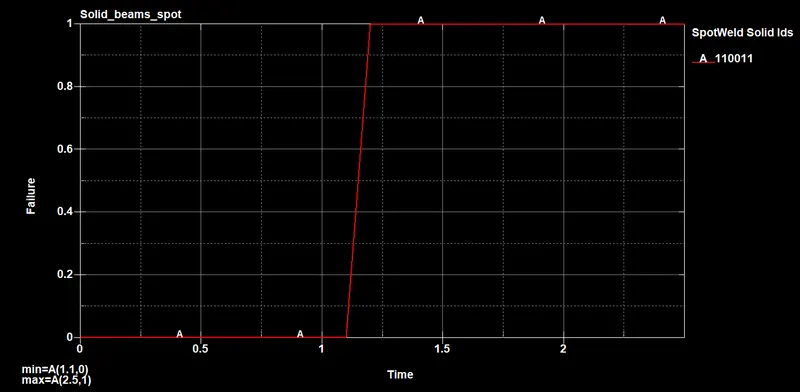
Fig 6.9: the plot of failure data for one of the solid element used for modelling spot weld
The plot clearly shows the failure happened approximately at half of the run time for simulation.
7. Conclusion
The Hexa elements are better than beam elements when it comes to modelling the spot weld connection. As explained earlier in the report, the difference arises as solid elements have far better section properties than 1D.