Week - 5 - Modelling Spotwelds
AIM
To model beam and solid spotweld Element on the part assembly and find the characteristics of the spotweld.
since the problem has two different spotweld elements, the problem is split is into 2 parts.
Case 1: BEAM ELEMENT
First the keyword file is imported into LS-Dyna.
to create the beam element, go to element and mesh>>element generation. in that select type as beam and select by two node set option and select the two nodes. in this way 4 beam elements are created.
Now the material card is added. For the 2 parts MAT_ELASTIC is used. For the spotweld MAT_SPOTWELD is used. all the properties of steel such as youngs modulus, poissions ratio, density are mentioned.
Next the section card is defined. SECTION_SHELL is used for the parts with ELFORM 16 and SECTION_BEAM is used for spotweld element with ELFORM 9.
In part cards the defined sections and materials are added.
Contact cards are defined. First AUTOMATIC_SINGAL_SURFACE CONTACT is defined by keeping the two parts as slave. This is added so that while simulation the parts shouldn't intersect eachother. Now TIED_SHELL_EDGE_TO_SURFACE CONTACT card is used wherein the beams are considered as slaves and the 2 parts are considered as master set.
After this rigid wall is created. Also the initial velocity of 13.88 mm/ms is applied to the body. they are are created by using create entity option.
CONTROL_TERMINATION is defined with time 10ms.
Now DATABASE_CROSS_SECTION_SET is defined for this a node set of all the nodes of beams is created.
DATABASE_HISTORY_NODE is created bt using all the noes of the beams elements.
d3plot, GLSTAT, MATSUM, SECFORCE, SWFORCE, NODEOUT is defined by keeping time interval as 1ms.
now the file is saved and it is runed in the LS-Dyna manager.
as seen in the above image, the beam elements fail at 6.43 and 7.2 ms respectively.
simulation results
acceleration
from the above graph, we can infer that node A i.e. node 501956 has both maximum and minimun acceleration.
maximum accleration 190`(mm)/(ms^2)` at 9 ms
minimum accleration -250 `(mm)/(ms^2)` at 8 ms
Directional stress
From the above image we can see that bottom part experiences more stress in x-direction because it is the first point of contact when the assembly hits with the rigid wall . the maximum stress in x-direction is found to be 4.07e+2 MPa.
From the above image we can see that bottom part experiences more stress in y-direction because it is the first point of contact when the assembly hits with the rigid wall. the maximum stress in y-direction is found to be 3.95e+2 MPa.
From the above image we can see that bottom part experiences more stress in z-direction because it is the first point of contact when the assembly hits with the rigid wall. the maximum stress in z-direction is found to be 3.11e+2 MPa.
Directional strain
From the above image we can see that bottom part experiences more strain in x-direction because it is the first point of contact when the assembly hits with the rigid wall. the maximum strain in x-direction is found to be 1.299e-5.
From the above image we can see that bottom part experiences more strain in y-direction because it is the first point of contact when the assembly hits with the rigid wall. the maximum strain in y-direction is found to be 1.25e-5.
From the above image we can see that bottom part experiences more strain in z-direction because it is the first point of contact when the assembly hits with the rigid wall. the maximum strain in z-direction is found to be 9.77e-6.
Energies
From the above graph we can find the Kinetic energy, Internal energy, Total energy, Sliding energy from GLSTAT data of the problem.
From the above graph we can find the Kinetic energy, Internal energy, Hourglass energy of top part, bottom part and beam element from MATSUM data of the problem.
Spotweld Data
From the above graph we can find the axial force of the 4 beam elements. we can see two beams which fails around 6.4ms and 2 beams which fail at 7.2ms.the maximum axial force is around is 620 N.
From the above graph we can find the shear force of the 4 beam elements. we can see the beams start to experience shear at 3ms.
from the above graph we can find the spotweld lengths. we can see that the length start to increase from 2ms and the length of 2 beams start to decrease at 6ms and other two at 7ms dur to the failure of beams.
Nodal accleration(NODEOUT)
from the above graph we can infer the accleration of the nodes of the beam element.we can see that nodes present at top part experience lesser accleration than the nodes present on bottom node.
Case 2: SOLID ELEMENT
to create solid element, go to element tools>>element edit>>create there select the type as hexa and seect 8 nodes fpr each solid element.
In solid element the main difference instead of SECTION_BEAM, SECTION_SOLID is used.
now save the file and run in LS-Dyna manager.
As seen from the above figure the solid elements fail at 1.83 ms.
Acceleration
The above graph represents a plot of acceleration vs time of solid elements . from this we can infer that solid element D and B have maximum acceleration and solid element A has the minimum acceleration
Directional stress
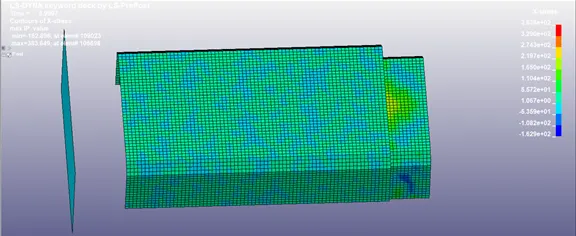
From the above image we can see that bottom part experiences more stress in x-direction because it is the first point of contact when the assembly hits with the rigid wall . the maximum stress in x-direction is found to be 3.83e+2 MPa.
From the above image we can see that bottom part experiences more stress in y-direction because it is the first point of contact when the assembly hits with the rigid wall . the maximum stress in y-direction is found to be 4.13e+2 MPa.
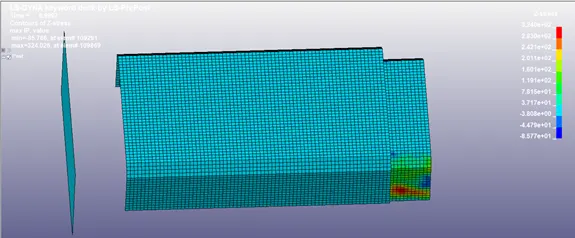
From the above image we can see that bottom part experiences more stress in z-direction because it is the first point of contact when the assembly hits with the rigid wall . the maximum stress in z-direction is found to be 3.24e+2 MPa.
Directional strain
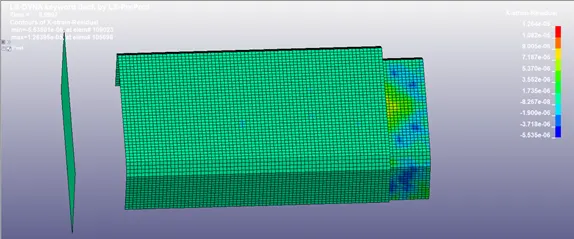
From the above image we can see that bottom part experiences more strain in x-direction because it is the first point of contact when the assembly hits with the rigid wall. the maximum strain in x-direction is found to be 1.26e-5.
From the above image we can see that bottom part experiences more strain in y-direction because it is the first point of contact when the assembly hits with the rigid wall. the maximum strain in y-direction is found to be 1.36e-5.
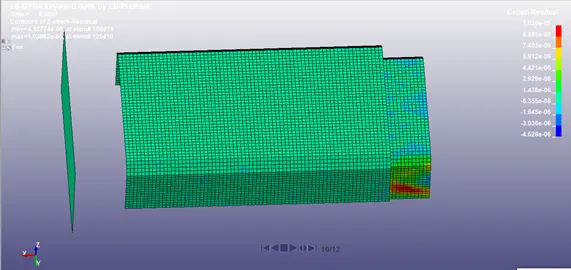
From the above image we can see that bottom part experiences more strain in y-direction because it is the first point of contact when the assembly hits with the rigid wall. the maximum strain in y-direction is found to be 1.03e-5.
Energies
From the above graph we can find the Kinetic energy, Internal energy, Total energy, Sliding energy from GLSTAT data of the problem.
From the above graph we can find the Kinetic energy, Internal energy, Hourglass energy of top part, bottom part and beam element from MATSUM data of the problem.
Spotweld data
from the above graph we can get the information of axial force with respect to time data. From this we can infer that the axial force of solid element c is maximum and the axial force of solid element B is minimum at 1ms.
From the data we can infer that the shear force of element A is maximum and shear force of element D is minimum at 1 ms.
the above gives the information of length of solid elements with respect to time.
Cross-Section force
the above graph gives information of cross-section forces at the solid element.
Nodal acceleration(NODEOUT)
the above image gives the data of nodal velocity at solid elements.
Conclusion
In terms of effective stress, the solid spotweld element has greater effevtive stress compared to beam spotweld element.
In terms of axial force, the solid spotweld element has greater axial force compared to beam spotweld element.
In terms of nodal acceleration, the solid spotweld element has greater acceleration compared to beam spotweld element.
In general the solid spotweld is stronger than a beam spotweld