Challenge

Week 5 - Genetic Algorithm

Aim:

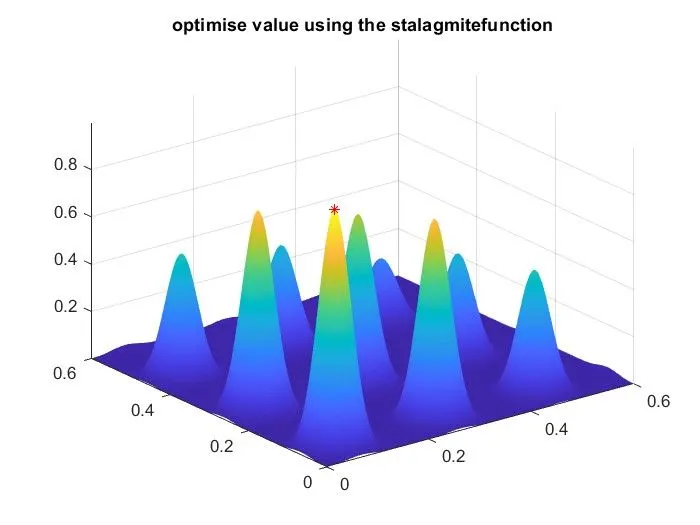
To optimise the stalagmite functionand find the global maxima of the function using MATLAB code.

Objective:

To explain the concept of Genetic algorithmand its syntax and also to find the global maxima of the function.

Theory (GA):

A genetic algorithm (GA) is a method for solving both constrained and unconstrained optimization problems based on a natural selection process that mimics biological evolution. The algorithm repeatedly modifies a population of individual solutions. At each step,the genetic algorithm randomly selects individuals from the current population and uses them as parents to produce the children for the next genertion. Over successive generations ,the population "evolves" toward an optimal solution . You can apply the genetic algorithms, including problems in which the objective function is discontinuous,nondifferentiable, stochastic, or highly nonlinear. The genetic algorithm differs from a classical, derivative-based, optimization algorithm in two main ways.

Optimization:

  • Optimization is the process of selection from the set of values for the imposed targets and the constraints.
  • Process handling, where its integrated with each other and affects one another in all aspect.

Code:
function [f] = stalagmite(input_vector)
x = input_vector(1)
y = input_vector(2)
f1x = (sin(5.1*pi*input_vector(1)+0.5)).^6;
f1y = (sin(5.1*pi*input_vector(2)+0.5)).^6;
f2x = exp((-4*log(2).*(((input_vector(1)-0.0667).^2)/0.64)));
f2y = exp((-4*log(2).*(((input_vector(2)-0.0667).^2)/0.64)));
f = -(f1x*f1y*f2x*f2y);
end
clear all
close all
clc
% Defining our search space
x = linspace(0,0.6,150);
y = linspace(0,0.6,150);
% Creating a 2Dimensional mesh
[xx,yy] = meshgrid(x, y);
num_cases=50; % number of iteration
% evaluating the stalagmite function
for i = 1:length(xx)
for j=1:length(yy)
z(1)=xx(i,j);
z(2)=yy(i,j);
f(i,j)=stalagmite(z);
end
end
% find the global maxima using the stalagmite function
options=optimoptions('ga','plotfcn',@gaplotbestf,'PopulationSize',200); %options 'Syntax'
[z,fval]=ga(@stalagmite,2,[],[],[],[],[0,0],[1,1],[],[],options); % ga 'syntax'
x_opt=z(1);
y_opt=z(2);
figure(1)
surfc(x,y,-f)
shading interp
hold on
plot3(x_opt,y_opt,-fval,'r*','MarkerSize',5)
title('optimise value using the stalagmitefunction')
% surfc(xx,yy,f);
% surfc(xx,yy,-f);
% shading interp
% statistical behaviour (unbounded)
tic %for calculating the study time (tic -toc command)
for i=1:num_cases
[inputs,fopt(i)]= ga (@stalagmite,2);
x_opt2(i)=inputs(1);
y_opt2(i)=inputs(2);
end
study1_time=toc;
%ploting the graph
figure(2)
subplot(2,1,1)
surfc(x,y,-f)
shading interp
hold on
plot3(x_opt2,y_opt2,-fopt,'color','b','marker','o','markersize',5,'markerfacecolor','g');
title('unbound case')
xlabel('x')
ylabel('y')
legend('X values','Y values')
grid on
subplot(2,1,2)
plot(-fopt,'color','b','linewidth',1);
xlabel('No. of iterations')
ylabel('function maximum value')
% statistical behaviour (bounded)
tic
for j=1:num_cases
[z,fopt(j)]=ga(@stalagmite,2,[],[],[],[],[0;0],[1;1]);
x_opt(j)=z(1);
y_opt(j)=z(2);
end
study2_time=toc;
% plotting
figure(3)
subplot(2,1,1);
surfc(xx,yy,-f)
shading interp
hold on
plot3(x_opt,y_opt,-fopt,'marker','o','markersize',5,'markerfacecolor','r')
title('bounded case')
xlabel('x');
ylabel('y');
grid on
subplot(2,1,2);
plot(-fopt);
xlabel('No. of iteration');
ylabel('function maximum value')
% modifying the number of population
options=optimoptions('ga','populationsize',500);
tic
for k=1:num_cases
[z,fopt(k)]=ga(@stalagmite,2,[],[],[],[],[0;0],[1;1],[],[],options);
x_opt(k)=z(1);
y_opt(k)=z(2);
end
study3_time=toc;
%plotting
figure(4)
subplot(2,1,1)
surfc(xx,yy,-f)
shading interp
hold on
plot3(x_opt,y_opt,-fopt,'marker','o','markersize',5,'markerfacecolor','r');
title('Modifying the no.of population')
xlabel('x')
ylabel('y')
grid on
subplot(2,1,2)
plot(-fopt);
xlabel('No.of iterations');
ylabel('function maximum value');
Code explanation:
1-Write a command for clear the workspace, close the previous plot or figure and clear the command window data.
2-The evaluating function is used to code written to check if the function is returning on output.
3-The function creates a 3D plot showing the Algorithm.
4-The stalagmite function is a core part of the code.
5-The shading function controls the color shading of surface and patch graphics objects.
6-The tic-toc command used to measure elapsed time. The 'tic' function records the current time, and the toc function uses the recorded value to calculate the elapsed time.
7-The function follows the formula stated in the Equations Used.
8-The 'Function' input is used to write a function code.
9-Surf function contours the plot under the surface plot .surfc(x,y,z) creates a three dimensional surface plot with a contour plot underneath.
10-For the Unbounded Stalagmites, the code starts with a 'for' loop having the inputs and optimal function with calling the function.
11-plot3 (x,y,z) plots coordinates in 3-D space.
12-To plot3 a set of coordinates connected by line segments, specify x,y, and z as vectors of the same length.
13-Ga is explained clearly in the 'Term Used'
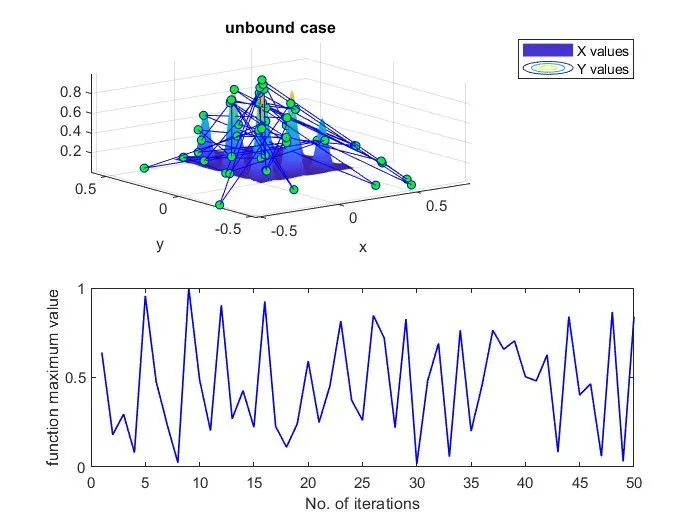
14-The plot is generated with unbounded stalagmites.
15-The code is written for the genetic algorithm function built-in inside the MATLAB. An empty array is created with starting and ending points of the x and y values.
16-The plot is created with the inputs in the proper order.
17-Optimoptions returns a set of default options for the Solver Name solver.
18-The code begins with writing 'optimoptions'. The details are given in the 'Term Used'.
19-The plot is then created as the previous method .
20-The Global Maxima is calculated.
for loop:
A loop in general,refers to anything whose start and end points are connected. That is once you begin from the start point a proceed further,you will reach the finish line just to find that it once again guides you to the same point where you started.Proceeding further means that you are repeating your same action again & again.
Nested for loop:
Nested for loops places one for loop inside another for loop. The inner loop is repeated for each iteration of the outer loop.we are going to finish introduce the concept of nested control structures. Nesting is a concept that places one item inside of another.
function [f] = stalagmite(input_vector)
x = input_vector(1)
y = input_vector(2)
f1x = (sin(5.1*pi*input_vector(1)+0.5)).^6;
f1y = (sin(5.1*pi*input_vector(2)+0.5)).^6;
f2x = exp((-4*log(2).*(((input_vector(1)-0.0667).^2)/0.64)));
f2y = exp((-4*log(2).*(((input_vector(2)-0.0667).^2)/0.64)));
f = -(f1x*f1y*f2x*f2y);
end


clear all
close all
clc
% Defining our search space
x = linspace(0,0.6,150);
y = linspace(0,0.6,150);
% Creating a 2Dimensional mesh
[xx,yy] = meshgrid(x, y);
num_cases=50; % number of iteration
% evaluating the stalagmite function
for i = 1:length(xx)
for j=1:length(yy)
z(1)=xx(i,j);
z(2)=yy(i,j);
f(i,j)=stalagmite(z);
end
end
% find the global maxima using the stalagmite function
options=optimoptions('ga','plotfcn',@gaplotbestf,'PopulationSize',200); %options 'Syntax'
[z,fval]=ga(@stalagmite,2,[],[],[],[],[0,0],[1,1],[],[],options); % ga 'syntax'
x_opt=z(1);
y_opt=z(2);
figure(1)
surfc(x,y,-f)
shading interp
hold on
plot3(x_opt,y_opt,-fval,'r*','MarkerSize',5)
title('optimise value using the stalagmitefunction')
% surfc(xx,yy,f);
% surfc(xx,yy,-f);
% shading interp
% statistical behaviour (unbounded)
tic %for calculating the study time (tic -toc command)
for i=1:num_cases
[inputs,fopt(i)]= ga (@stalagmite,2);
x_opt2(i)=inputs(1);
y_opt2(i)=inputs(2);
end
study1_time=toc;
%ploting the graph
figure(2)
subplot(2,1,1)
surfc(x,y,-f)
shading interp
hold on
plot3(x_opt2,y_opt2,-fopt,'color','b','marker','o','markersize',5,'markerfacecolor','g');
title('unbound case')
xlabel('x')
ylabel('y')
legend('X values','Y values')
grid on
subplot(2,1,2)
plot(-fopt,'color','b','linewidth',1);
xlabel('No. of iterations')
ylabel('function maximum value')
% statistical behaviour (bounded)
tic
for j=1:num_cases
[z,fopt(j)]=ga(@stalagmite,2,[],[],[],[],[0;0],[1;1]);
x_opt(j)=z(1);
y_opt(j)=z(2);
end
study2_time=toc;
% plotting
figure(3)
subplot(2,1,1);
surfc(xx,yy,-f)
shading interp
hold on
plot3(x_opt,y_opt,-fopt,'marker','o','markersize',5,'markerfacecolor','r')
title('bounded case')
xlabel('x');
ylabel('y');
grid on
subplot(2,1,2);
plot(-fopt);
xlabel('No. of iteration');
ylabel('function maximum value')
% modifying the number of population
options=optimoptions('ga','populationsize',500);
tic
for k=1:num_cases
[z,fopt(k)]=ga(@stalagmite,2,[],[],[],[],[0;0],[1;1],[],[],options);
x_opt(k)=z(1);
y_opt(k)=z(2);
end
study3_time=toc;
%plotting
figure(4)
subplot(2,1,1)
surfc(xx,yy,-f)
shading interp
hold on
plot3(x_opt,y_opt,-fopt,'marker','o','markersize',5,'markerfacecolor','r');
title('Modifying the no.of population')
xlabel('x')
ylabel('y')
grid on
subplot(2,1,2)
plot(-fopt);
xlabel('No.of iterations');
ylabel('function maximum value');
​
Results:
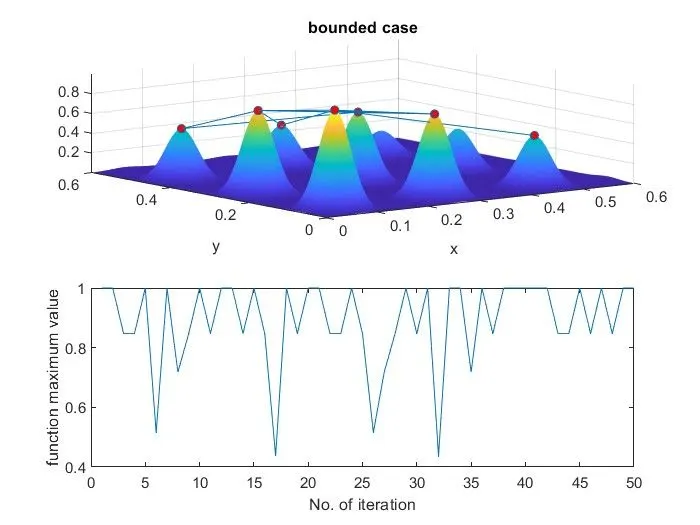
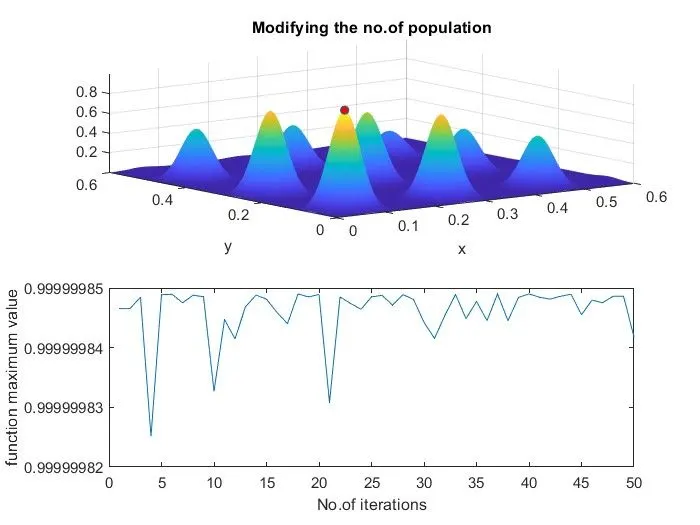
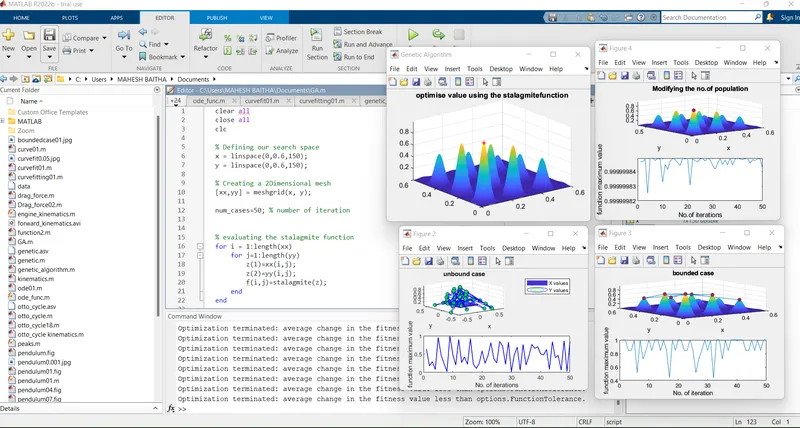
1- We can observe from the above figures how the solver converges to an optimal solution.
2-The results show the generation of the stalagmites. The start and end boundries are takenas inputs.
3-Thus we have optimised stalagmite function and found the global maxima for the function.
Your portfolio, next

Ship work like this
in your own course.

Talk to a career counsellor

Free 20-minute call. We'll map the right course to where you want to work.

By submitting you agree to our Terms and Privacy Policy.