Week 5 - Genetic Algorithm
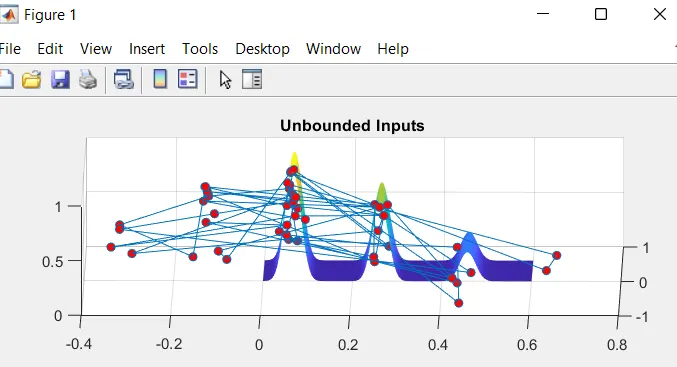
Error occured in the graph as only xx axis was shown.
it is resolved by checking the code line by line.
another minor error occured while plotting the graph
FUNCTION CODE
%Stalagmite Function
function [f] = stalagmite(input_vector)

 fx = (sin(5.1*pi*input_vector(1)+0.5))^6;
 fy = (sin(5.1*pi*input_vector(2)+0.5))^6;
 fxx = exp((-4*log(2)*(((input_vector(1)-0.0667)^2)/0.64)));
 fyy = exp((-4*log(2)*(((input_vector(2)-0.0667)^2)/0.64)));
 f = -(fx*fy*fxx*fyy);

end
clear
close
clc
%Write a code in MATLAB to optimise the stalagmite function and find the global maxima of the function.
%Input
x = linspace(0,0.6,150);
y = linspace(0,0.6,150);
num_cases = 50;
%2-D Mesh
[xx,yy] = meshgrid(x,y);
%Using for loop to evaluate the stalagmite function
for i = 1:length(x)
for j = 1:length(y)
input_vector(1) = xx(i,j);
input_vector(2) =yy(i,j);
input_vector = [input_vector(1),input_vector(2)];
f(i,j) = stalagmite(input_vector);
end
end
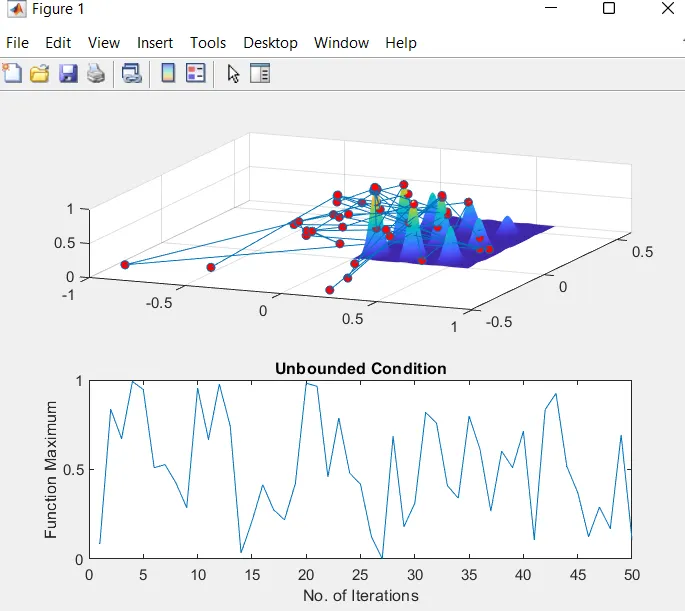
%Case-1: Study of statistical behaviour in unbounded condition
%Using tic-toc command to calculate the iteration time.
tic
for i = 1:num_cases
[input,fopt(i)] = ga(@stalagmite,2);
xopt(i) = input(1);
yopt(i) = input(2);
end
studytime1 = toc;
%Plotting-Case1
figure(1)
subplot(2,1,1)
surf(x,y,-f)
shading interp
hold on
plot3(xopt,yopt,-fopt,'Marker','o','MarkerSize',5,'MarkerFaceColor','r')
subplot(2,1,2)
plot(-fopt)
xlabel('No. of Iterations')
ylabel('Function Maximum')
title('Unbounded Condition')
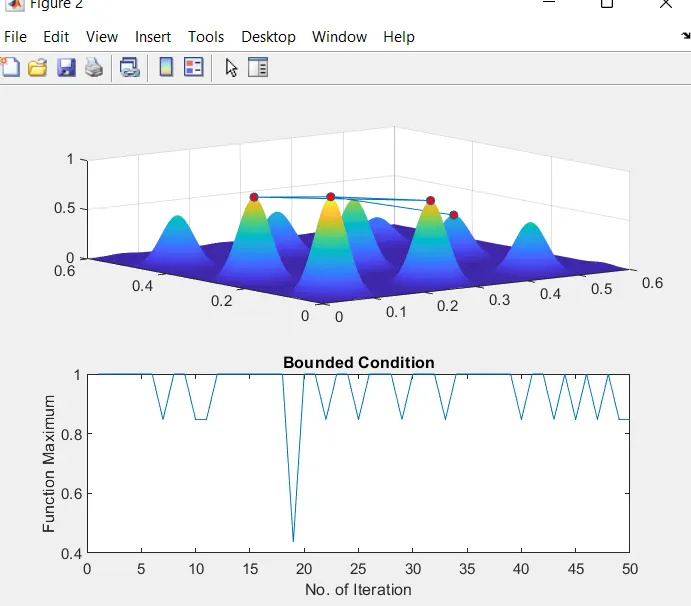
%Case-2: Study of statistical behaviour in bounded condition
%Using tic-toc command for calculating the itration time
tic
for i = 1:num_cases
[input, fopt(i)] = ga(@stalagmite,2,[],[],[],[],[0;0],[0.6;0.6]);
xopt(i) = input(1);
yopt(i) = input(2);
end
studytime2 = toc;
%Plotting-Case2
figure(2)
subplot(2,1,1)
surf(x,y,-f)
shading interp
hold on
plot3(xopt,yopt,-fopt,'marker','o','markersize',5,'markerfacecolor','r')
subplot(2,1,2)
plot(-fopt)
xlabel('No. of Iteration')
ylabel('Function Maximum')
title('Bounded Condition')
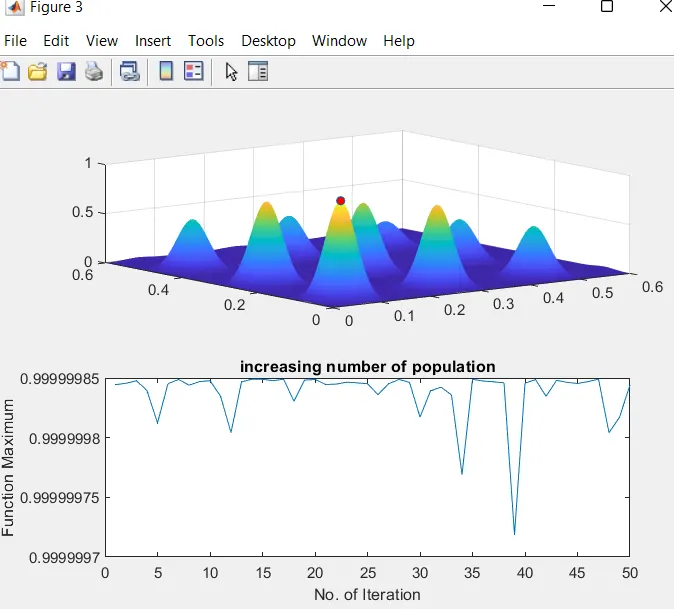
%Case-3: Study of statistical behaviour in increasing number of population
%Calculating the optimum solution for 'ga'
options = optimoptions('ga');
%increasing the size of population
options = optimoptions(options,'PopulationSize',240);
%Using tic-toc command for calculating the itration time
tic
for i = 1:num_cases
[input, fopt(i)] = ga(@stalagmite,2,[],[],[],[],[0;0],[0.6;0.6],[],[],options);
xopt(i) = input(1);
yopt(i) = input(2);
end
studytime3 = toc;
%Plotting-Case3
figure(3)
subplot(2,1,1)
surf(x,y,-f)
shading interp
hold on
plot3(xopt,yopt,-fopt,'marker','o','markersize',5,'markerfacecolor','r')
subplot(2,1,2)
plot(-fopt)
xlabel('No. of Iteration')
ylabel('Function Maximum')
title('increasing number of population')Step-wise explanation of code
BEGIN
INITIALIZE Initialise the input terms by using array creation method and no. of terms
Creating two dimensional mesh by using meshgrid command.
CASE1 Study of statistical behaviour in unbounded condition
Use for loop to evaluate the stalagmite function
Function Call
Use tic-toc command to calculate the iteration time.
PLOT Plotting the graphs to No. of Iterations vs Function Maximum for unbounded condition
ENDCASE1
CASE2 Study of statistical behaviour in bounded condition
Use for loop to evaluate the stalagmite function
Function Call
Use tic-toc command to calculate the iteration time
PLOT Plotting the graphs to No. of Iterations vs Function Maximum for bounded condition
ENDCASE2
CASE3 Study of statistical behaviour in increasing number of population
Use for loop to evaluate the stalagmite function
Function Call
Use tic-toc command to calculate the iteration time
PLOT Plotting the graphs to No. of Iterations vs Function Maximum
ENDCASE3
ENDBEGIN
FUNCTION create a function to reduce the complication and length of the code
Give the name of the function and save it by using the same name
Stalagmite Function
function [f] = stalagmite(input_vector)
fx = (sin(5.1*pi*input_vector(1)+0.5))^6;
fy = (sin(5.1*pi*input_vector(2)+0.5))^6;
fxx = exp((-4*log(2)*(((input_vector(1)-0.0667)^2)/0.64)));
fyy = exp((-4*log(2)*(((input_vector(2)-0.0667)^2)/0.64)));
f = -(fx*fy*fxx*fyy);
ENDFUNCTION
END