Project 1 - Parsing NASA thermodynamic data
FUNCTION CODE

function [M] = molecular_weight(species)
%Symbol of elements used
elements= ['H','C','O','N','A','S'];
%Atomic weight of respective
atomic_weight = [1.00 12.01 15.99 14.00 39.95 32.06];
M = 0;
for i = 1:length(species)
    for j = 1:length(elements)
        if strcmp(species(i),elements(j))
            M = M+atomic_weight(j);
            a=j;
        end
    end
    n = str2num(species(i));
    if n>1
        M = M+atomic_weight(a)*(n-1);
    end
end
end
CODE OF THE PROGRAM
clear
close
clc
%Reading the file
f = fopen('THERMO.dat','r');
fgetl(f); %It reads the first line of data.
A=fgetl(f); %Reads and assign to 'A' second line of the data
temp = strsplit(A,' '); %It splits the line by space
%Assign values for low,mid,high temperature
low_temp = str2num(temp{2});
mid_temp = str2num(temp{3});
high_temp = str2num(temp{4});
%Universal gas constant
R = 8.314;
%Command is used to read and skip the instruction line
info1=fgetl(f);
info2=fgetl(f);
info3=fgetl(f);
%FPRINTF- It write formatted data to text file.
fprintf('The molecular weight of species are\n');
%Using for loop to extract the coefficients of all the 53 species
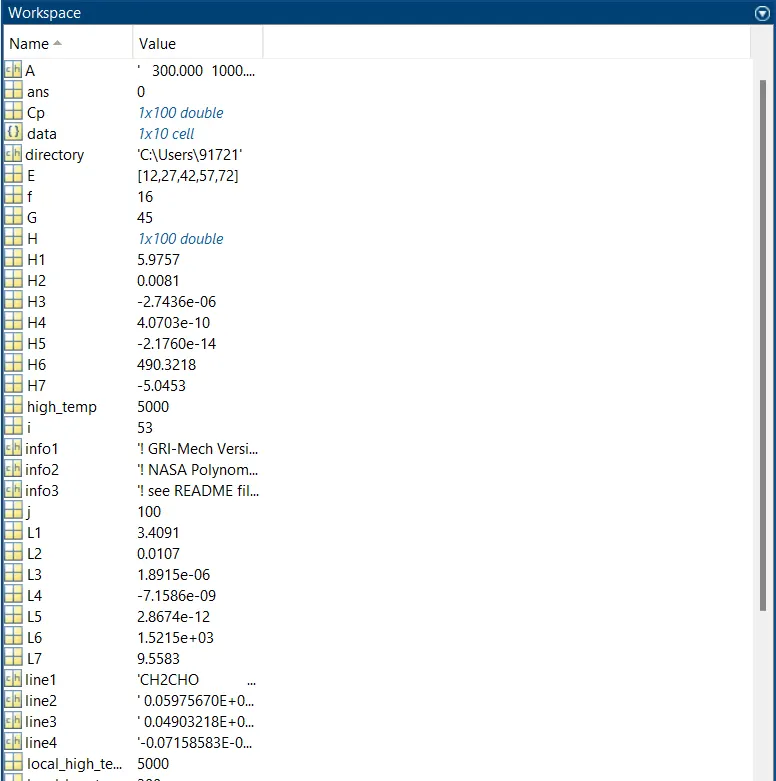
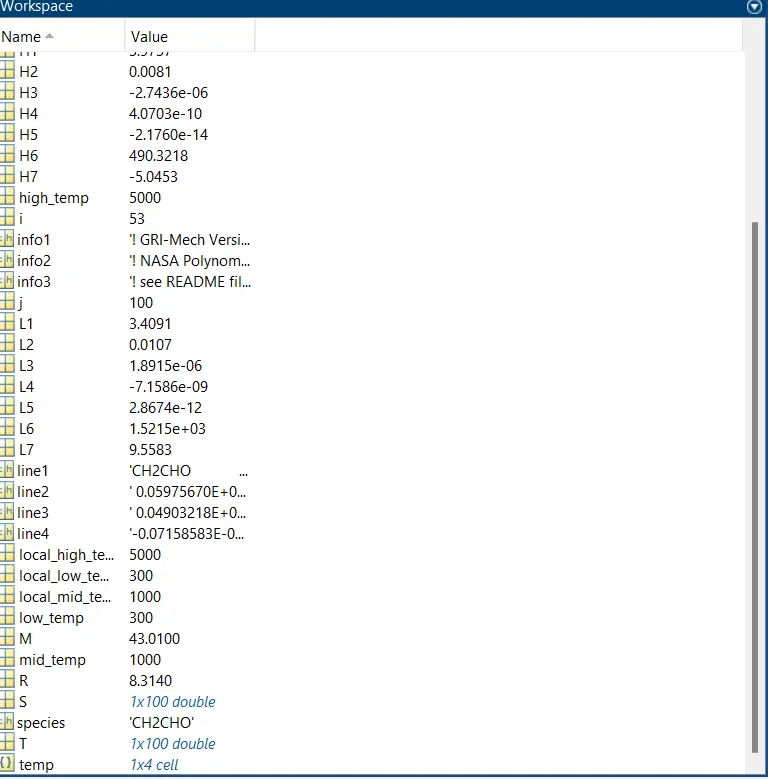
for i = 1:53
line1 = fgetl(f);
line2 = fgetl(f);
line3 = fgetl(f);
line4 = fgetl(f);
data = strsplit(line1,' '); %It splits the line1 by space
species= data{1:8}; %Extracting the species name
G= strfind(line1,'G'); %Finding the place number of G
local_low_temp = str2num(line1(45+3:45+9));
local_mid_temp = str2num(line1(45+22:45+29));
local_high_temp = str2num(line1(45+12:45+19));
%Finding the place number of E
E = strfind(line2,'E');
%Extracting High Temperature Co-efficients
H1 = str2num(line2(E(1)-11:E(1)+3));
H2 = str2num(line2(E(2)-11:E(2)+3));
H3 = str2num(line2(E(3)-11:E(3)+3));
H4 = str2num(line2(E(4)-11:E(4)+3));
H5 = str2num(line2(E(5)-11:E(5)+3));
H6 = str2num(line3(E(1)-11:E(1)+3));
H7 = str2num(line3(E(2)-11:E(2)+3));
%Extracting Low Temperature Co-efficients
L1 = str2num(line3(E(3)-11:E(3)+3));
L2 = str2num(line3(E(4)-11:E(4)+3));
L3 = str2num(line3(E(5)-11:E(5)+3));
L4 = str2num(line4(E(1)-11:E(1)+3));
L5 = str2num(line4(E(2)-11:E(2)+3));
L6 = str2num(line4(E(3)-11:E(3)+3));
L7 = str2num(line4(E(4)-11:E(4)+3));
%Range of local temperatures
T=linspace(local_low_temp,local_high_temp,100);
for j = 1:length(T)
if T(j)>local_mid_temp
%Specific Heat
Cp = (H1+H2.*T+H3.*(T.^2)+H4.*(T.^3)+H5.*(T.^4)).*R;
%Enthalpy
H = (H1+(H2.*T)./2+(H3.*(T.^2))./3+(H4.*(T.^3))./4)+(H5.*(T.^4))./5+(H6./T).*(R.*T);
%Entropy
S = (H1.*log(T)+H2.*T+(H3.*T.^2)./2+(H4.*T.^3)./3+(H5.*T.^4)./4+(H7).*R);
else
%Specific Heat
Cp = (L1+L2.*T+L3.*(T.^2)+L4.*(T.^3)+L5.*(T.^4)).*R;
%Enthalpy
H = (L1+(L2.*T)./2+(L3.*(T.^2))./3+(L4.*(T.^3))./4)+(L5.*(T.^4))./5+(L6./T).*(R.*T);
%Entropy
S = (L1.*log(T)+L2.*T+(L3.*T.^2)./2+(L4.*T.^3)./3+(L5.*T.^4)./4+(L7).*R);
end
end
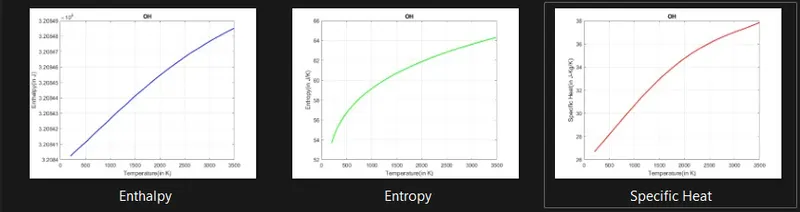
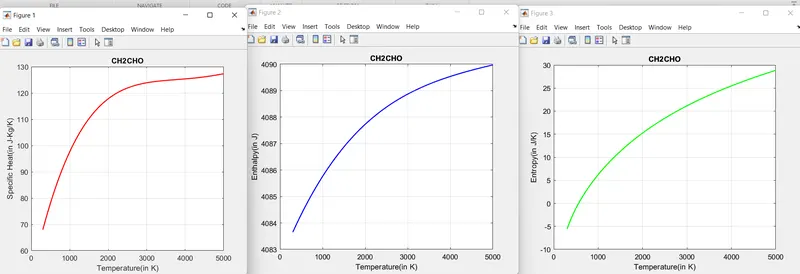
%Plotting the graph between Temperature and Specific Heat
figure(1)
plot(T,Cp,'LineWidth',1.5,'Color','r')
grid on
title(species)
xlabel('Temperature(in K)')
ylabel('Specific Heat(in J-Kg/K)')
%Plotting the graph between Temperature and Enthalpy
figure(2)
plot(T,H,'LineWidth',1.5,'Color','b')
grid on
title(species)
xlabel('Temperature(in K)')
ylabel('Enthalpy(in J)')
%Plotting the graph between Temperature and Entropy
figure(3)
plot(T,S,'LineWidth',1.5,'Color','g')
grid on
title(species)
xlabel('Temperature(in K)')
ylabel('Entropy(in J/K)')
%Creating a folder to save the data of all the species
mkdir(species)
directory = pwd;
cd(species)
%Saving the plots as an image
saveas(1,'Specific Heat.jpg')
saveas(2,'Enthalpy.jpg')
saveas(3,'Entropy.jpg')
cd(directory)
%Calling the function to calculate the molecular weight
M = molecular_weight(species);
%printing the results
fprintf('%2f molecular weight of [%s] = %2.4f\n',i,species,M)
end
%Closing the data file
fclose(f);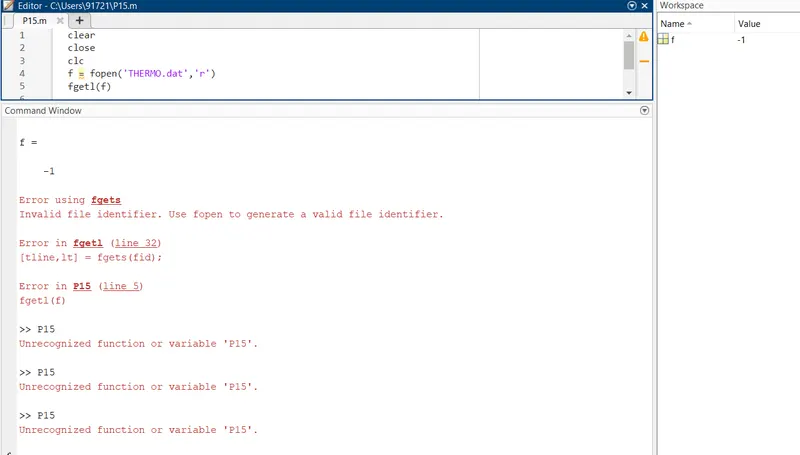
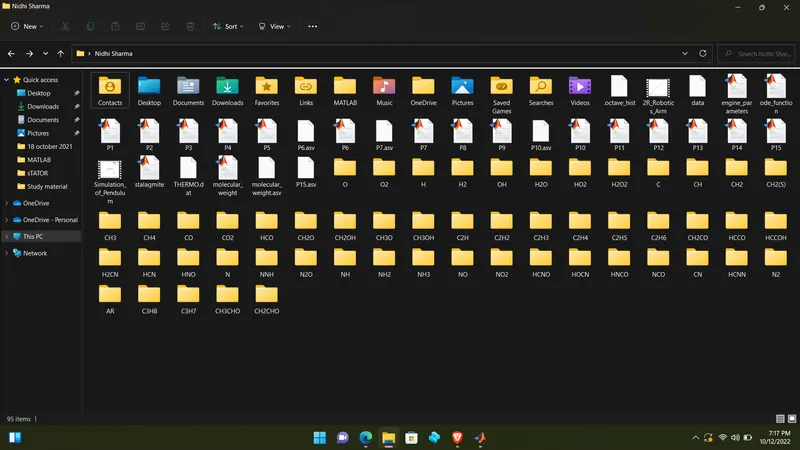
The Program and Data file was not stored in the path from where matlab is reading the data and negative integer is shown when Run the program
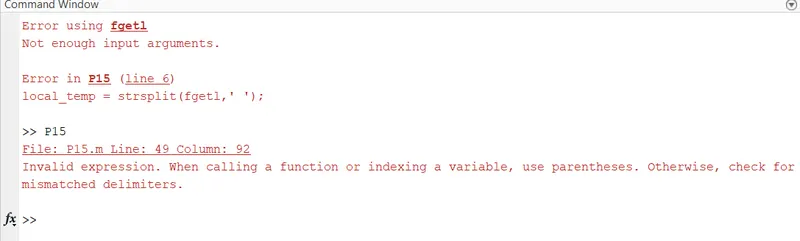
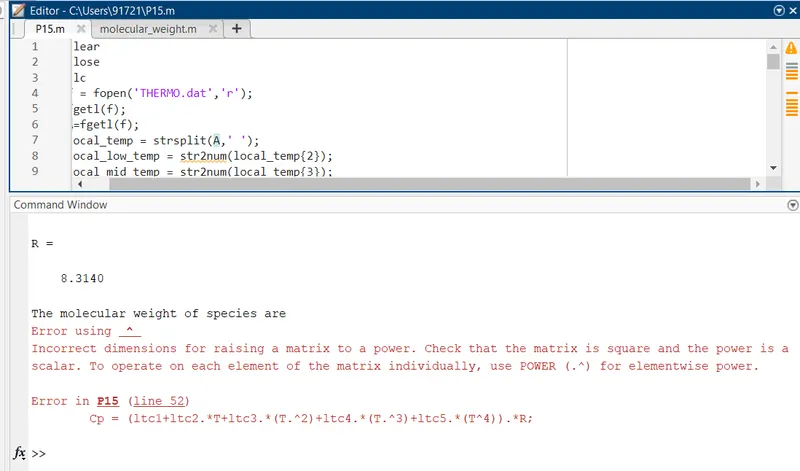
Firstly, I was unable to find the cause of error. Then, I found that matlab wa unable to recognize the file so I add the program and data file at place where matlab can read the data.
PSEUDOCODE of Function Code

BEGIN FUNCTION molecular_weight
      INITIALIZE enter the symbol of the elements used
                 enter the atomic weight of the respective elements
                 Input the initial molecular weight
             FOR initialize the loop to calculate the molecular weight of the elements
                 STRCMP command is used to compare elements present in bi=oth species and element.
         END FOR
BEGIN
INITIALIZE fopen command to read the data file
using fgetl command to read the first line of data
and to assign to 'a variable' the second line of the data
using strsplit command to splits the line by space
Assign values for low,mid and high temperature
input the Universal gas constant
fgetl Command is used to read and skip the instruction line
using printf command to write formatted data to text file.
Using for loop to extract the coefficients
using strsplit command to splits the line by space
Extracting the species name from data file
using strfind command to find the place number of G
using strfind command to find the place number of E
Extracting High Temperature Co-efficients
Extracting Low Temperature Co-efficients
Range the local temperatures by using linspace command
FOR using for loop to calculate the Specific heat,entropy and enthalpy for
low and high temperatures.
END FOR
PLOT Plotting the graph between Temperature and Specific Heat
Plotting the graph between Temperature and Enthalpy
Plotting the graph between Temperature and Entropy
Creating a folder to save the data of all the species by using mkdir
command
PWD command returns the current directory in the string
Saving the plots as an image by using saveas command
Calling the function to calculate the molecular weight
printing the results by using printf command
Closing the data file by using fclose command
END