Week 5 - Genetic Algorithm
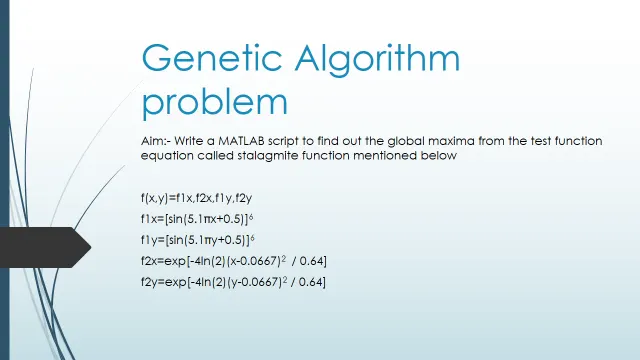
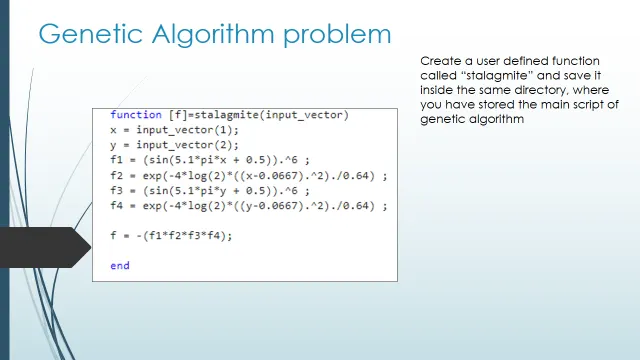
Stalagmite test function equation code

function [f]=stalagmite(input_vector)
x = input_vector(1);
y = input_vector(2);
f1 = (sin(5.1*pi*x + 0.5)).^6 ;
f2 = exp(-4*log(2)*((x-0.0667).^2)./0.64) ;
f3 = (sin(5.1*pi*y + 0.5)).^6 ;
f4 = exp(-4*log(2)*((y-0.0667).^2)./0.64) ;

f = -(f1*f2*f3*f4);

end

Genetic Algorithm main code

%%
clear all
close all
clc

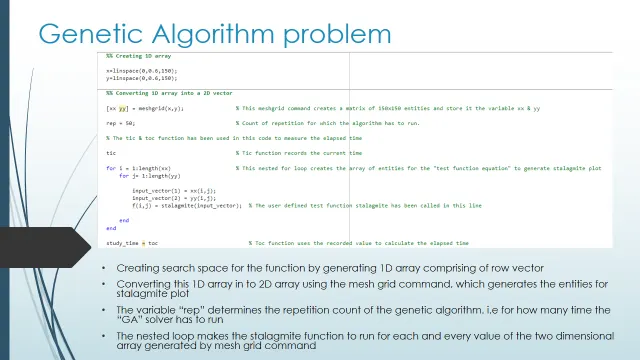
%% Creating 1D array

x=linspace(0,0.6,150);
y=linspace(0,0.6,150);

%% Converting 1D array into a 2D vector

[xx yy] = meshgrid(x,y);       % This meshgrid command creates a matrix of 150x150 entities and store it the variable xx & yy

rep = 50;                      % Count of repetition for which the algorithm has to run.

% The tic & toc function has been used in this code to measure the elapsed time

tic                                     % Tic function records the current time

% This nested for loop creates the array of entities for the "test function equation" to generate stalagmite plot

for i = 1:length(xx)
    for j= 1:length(yy)

        input_vector(1) = xx(i,j);
        input_vector(2) = yy(i,j);
        f(i,j) = stalagmite(input_vector);  % The user defined test function stalagmite has been called in this line

    end
end

study_time = toc                            % Toc function uses the recorded value to calculate the elapsed time

%% Creating stalagmite plot

surfc(xx,yy,-f)          % This command creates a mountain type of plot in two dimension

shading interp           % This command removes the grid over from the mountain plot created

[inputs,fval]=ga(@stalagmite,2)    % This command runs the "test function equation" mentioned inside the function header"stalagmite" with no.of variables as 2 (x & y)

xlabel('x value');
ylabel('y value');
title('Stalagmite function');

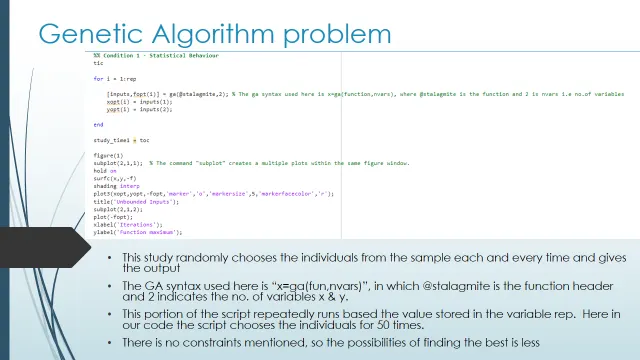
%% Condition 1 - Statistical Behaviour
tic

for i = 1:rep

[inputs,fopt(i)] = ga(@stalagmite,2); % The ga syntax used here is x=ga(function,nvars), where @stalagmite is the function header and 2 is nvars i.e no.of variables

    xopt(i) = inputs(1);
    yopt(i) = inputs(2);

end

study_time1 = toc

figure(1)
subplot(2,1,1);  % The command "subplot" creates a multiple plots within the same figure window.
hold on
surfc(x,y,-f)
shading interp
plot3(xopt,yopt,-fopt,'marker','o','markersize',5,'markerfacecolor','r');
title('Unbounded Inputs');
subplot(2,1,2);
plot(-fopt);
xlabel('Iterations');
ylabel('Function maximum');

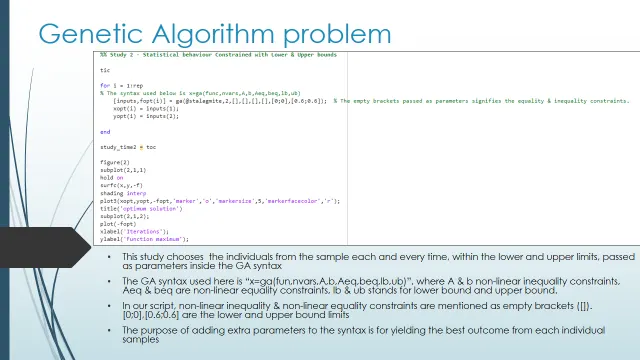
%% Study 2 - Statistical behaviour Constrained with Lower & Upper bounds

tic

for i = 1:rep
% The syntax used below is x=ga(func,nvars,A,b,Aeq,beq,lb,ub)
    [inputs,fopt(i)] = ga(@stalagmite,2,[],[],[],[],[0;0],[0.6;0.6]);  % The empty brackets passed as parameters signifies the equality & inequality constraints.
    xopt(i) = inputs(1);
    yopt(i) = inputs(2);

end

study_time2 = toc

figure(2)
subplot(2,1,1)
hold on
surfc(x,y,-f)
shading interp
plot3(xopt,yopt,-fopt,'marker','o','markersize',5,'markerfacecolor','r');
title('optimum solution')
subplot(2,1,2);
plot(-fopt)
xlabel('Iterations');
ylabel('Function maximum');

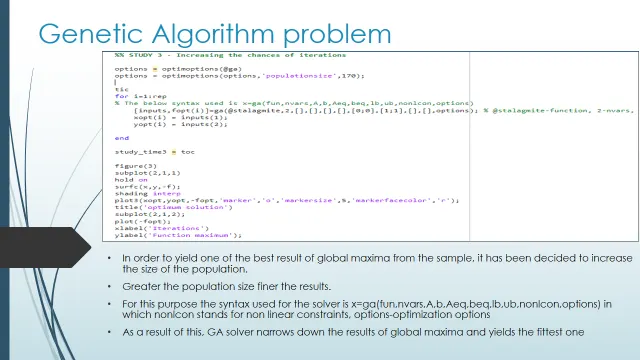
%% STUDY 3 - Increasing the chances of iterations

options = optimoptions(@ga)
options = optimoptions(options,'populationsize',170);


tic
for i=1:rep

% The below syntax used is x=ga(fun,nvars,A,b,Aeq,beq,lb,ub,nonlcon,options)

    [inputs,fopt(i)]=ga(@stalagmite,2,[],[],[],[],[0;0],[1;1],[],[],options);

% @stalagmite-function, 2-nvars, empty brackets [] - equality & non equality constraints, [0;0]-lower bounds, [1;1]-upper bounds, [],[] - non linear constraints, options-optimization options

    xopt(i) = inputs(1);
    yopt(i) = inputs(2);

end


study_time3 = toc


figure(3)
subplot(2,1,1)
hold on
surfc(x,y,-f);
shading interp
plot3(xopt,yopt,-fopt,'marker','o','markersize',5,'markerfacecolor','r');
title('optimum solution')
subplot(2,1,2);
plot(-fopt);
xlabel('Iterations')
ylabel('Function maximum');

global_maxima = -fopt
COMMAND WINDOW OUTPUTS
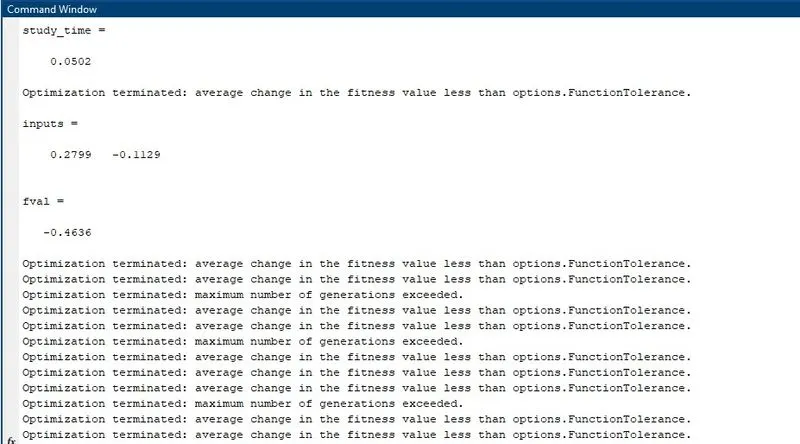
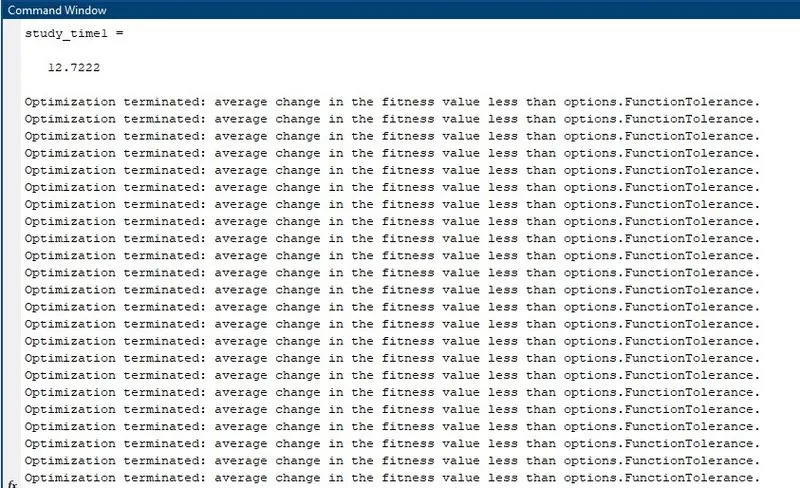
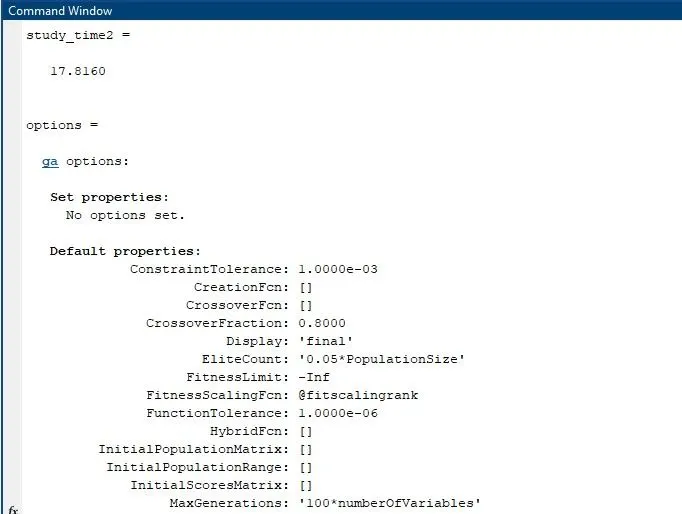
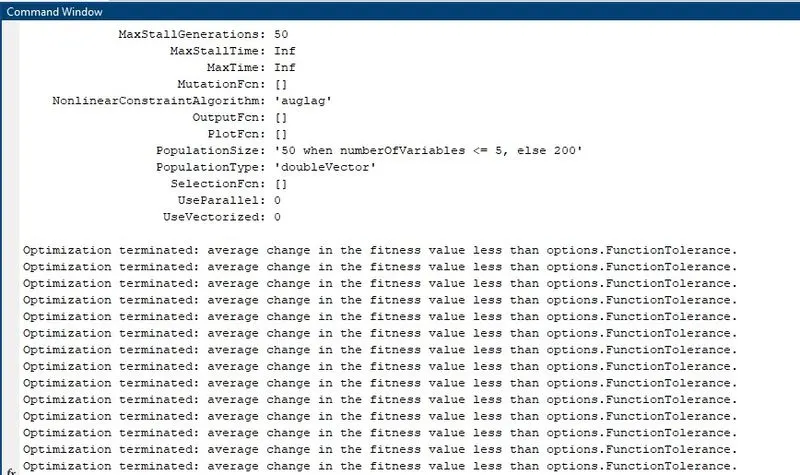
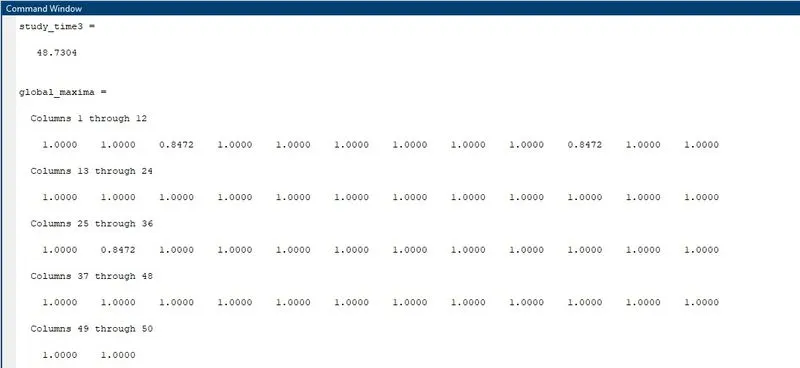
ERROR MESSAGES

Meaning for error:- The error aroused because the user defined function file stalagmite was not found inside the directory where the main code of the program was stored.
Error rectification:- The run button was clicked after writing the script and by default MATLAB asked for the location to store this user defined function code. Then this function file was saved in the same directory where the main code was saved
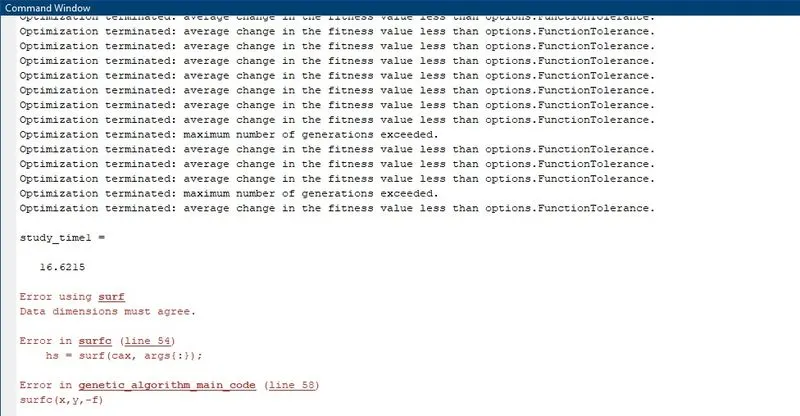
Meaning for error:- This error indicates that some of the variable in the code has been declared wrongly
Error rectification:-The actual error was the variable of the user defined function was wrongly declared
The error was rectified after the command from [x,fval]=ga(@stalagmite,2) to [inputs,fval]=ga(@stalagmite,2)
PLOTS
Stalagmite test function plot
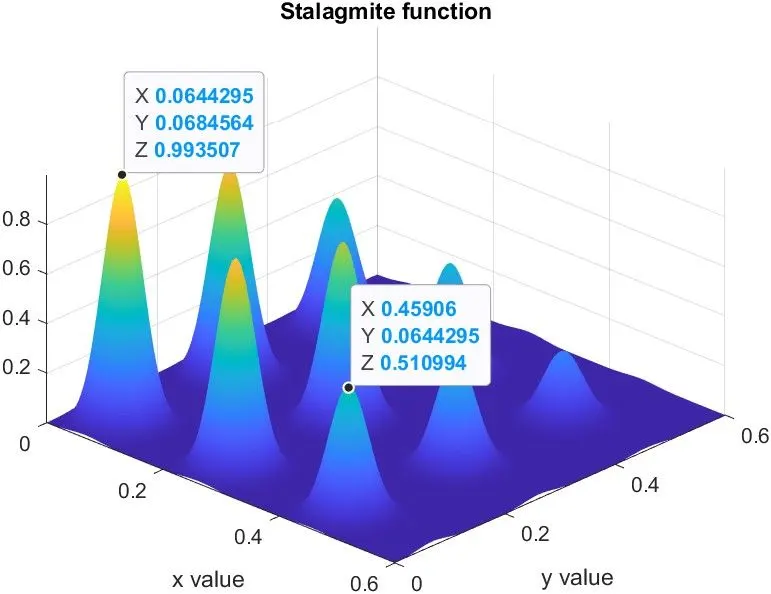
Graph of study 1 - Statistical Behaviour
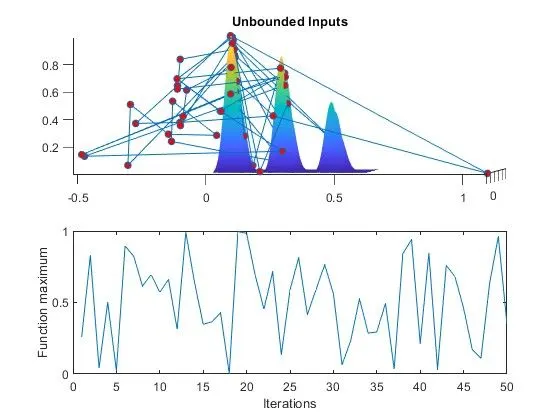
Graph 2 - Statistical behaviour constrained with lower and upper bounds
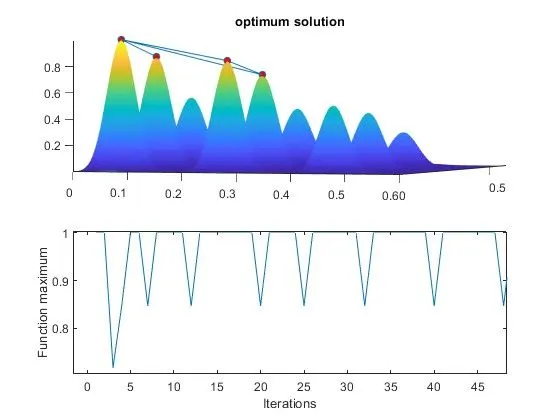
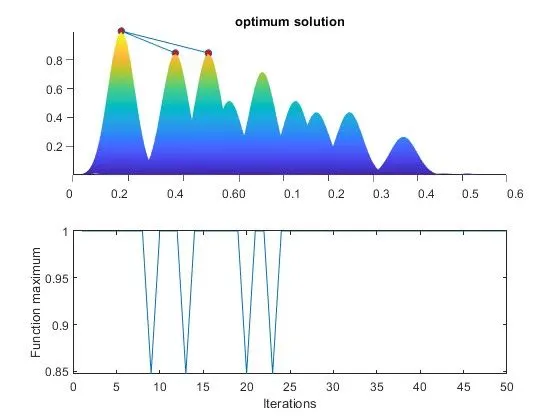
Graph 3 - After increasing the chances of iterations


WEBSITE REFERENCES
https://in.mathworks.com/help/gads/ga.html#d124e49856
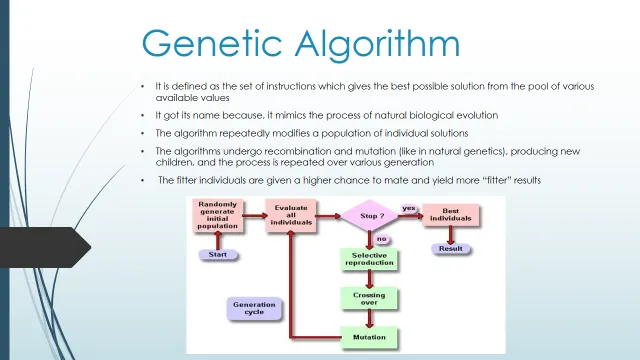
https://www.tutorialspoint.com/genetic_algorithms/genetic_algorithms_introduction