Week 5 - Curve fitting
import numpy as np
from scipy.optimize import curve_fit
import matplotlib.pyplot as plt
# Define your data points
x_data = np.array([300, 301, 302, 303, 304, 305, 306, 307, 308, 309, 310, 311, 312, 313, 314, 315, 316, 317, 318, 319, 320, 321, 322, 323, 324, 325, 326, 327, 328, 329, 330, 331, 332, 333, 334, 335, 336, 337, 338, 339, 340, 341, 342, 343, 344])
y_data = np.array([940.3659512022349, 940.53912184539, 940.7138187558996, 940.8900327242061, 941.0677545614627, 941.2469750995348, 941.4276851909997, 941.609875709146, 941.7935375479744, 941.9786616221968, 942.1652388672373, 942.353260239231, 942.5427167150259, 942.7335992921804, 942.9258989889652, 943.1196068443631, 943.3147139180678, 943.5112112904851, 943.7090900627325, 943.9083413566392, 944.1089563147457, 944.3109261003051, 944.5142418972814, 944.7188949103505, 944.9248763649])
# Define a linear function for curve fitting
def linear_func(x, a, b):
return a * x + b
# Perform curve fitting
params, covariance = curve_fit(linear_func, x_data[:25], y_data)
a, b = params
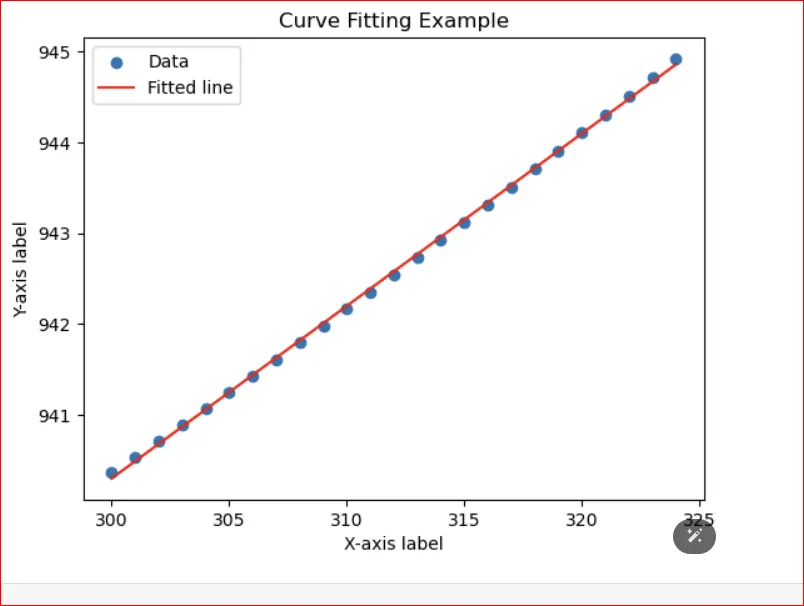
# Plot the data and the fitted curve
plt.scatter(x_data[:25], y_data, label='Data')
plt.plot(x_data[:25], linear_func(x_data[:25], a, b), color='red', label='Fitted line')
plt.xlabel('X-axis label')
plt.ylabel('Y-axis label')
plt.title('Curve Fitting Example')
plt.legend()
plt.show()