Week 5 - Curve fitting
1. What does popt and pcov mean?
popt contains the arbitary values of constants passed through the function of the predicted curve fit. it will find the optimal parameters for the function.
pcov is a 2D array which is the estimated covariance of popt
2. What does np.array(temperature) do?
np.array is used to conver the list of temperature from data into an array to store the values to perform calculations
3. What does the * in *popt mean?
popt is used to store different values to the constants , depending on the order of the function polynomial we use * which allows us to pass arbitary number of arguments.
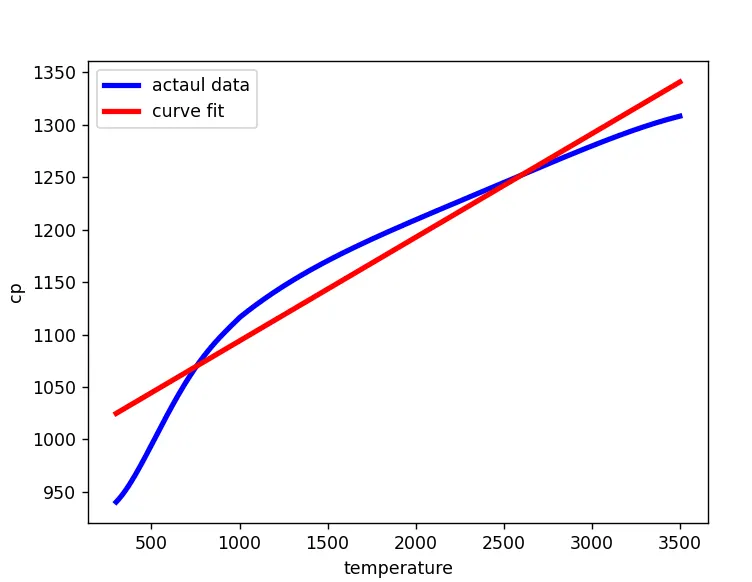
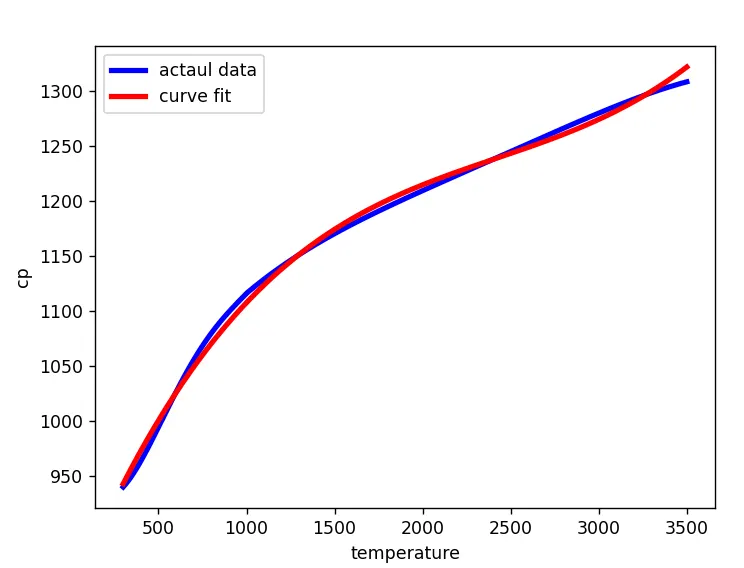
4. Write code to fit a linear and cubic polynomial for the Cp data. Explain if your results are good or bad.
Linear Function
-The module curve_fit is called from scipy.optimize library which is a python library for performing various optimisation functions on data.
-The Linear function y=a⋅t+b is used to perform curve fit and defined as a function func.
-Another function read_file is defined containing the arrays for temperature and Cp which is derived from the provided data file
- *popt is used to pass arbitary values for the constants defined in the function
CODE:
import matplotlib.pyplot as plt
from scipy.optimize import curve_fit
import numpy as np

#curve fit function
def fun(t,a,b):
    return (a*t)+b
def read_file():
    cp = []
    temperature = []
    for line in open('data1','r'):
        values =line.split(',')
        temperature.append(float(values[0]))
        cp.append(float(values[1]))

    return [temperature, cp]

temperature,cp = read_file()
popt,pcov = curve_fit(fun,temperature,cp)
fit_cp = fun(np.array(temperature),*popt)

plt.figure()
plt.plot(temperature,cp,color = 'b',linewidth = 3)
plt.plot(temperature,fit_cp,color = 'red', linewidth = 3)
plt.legend(['actaul data', 'curve fit'])
plt.xlabel('temperature')
plt.ylabel('cp')
plt.show()
Cubic Polynomial:
-Then cubic polynomial is used to perform curve fit and defined as a function func.
-Another function read_file is defined containing the arrays for temperature and Cp which is derived from the provided data file
- *popt is used to pass arbitary values for the constants defined in the function
CODE:
import matplotlib.pyplot as plt
from scipy.optimize import curve_fit
import numpy as np

#curve fit function
def fun(t,a,b,c,d):
    return (a*(t**3))+(b*(t**2))+c*t+d
def read_file():
    cp = []
    temperature = []
    for line in open('data','r'):
        values =line.split(',')
        temperature.append(float(values[0]))
        cp.append(float(values[1]))

    return [temperature, cp]

temperature,cp = read_file()
popt,pcov = curve_fit(fun,temperature,cp)
fit_cp = fun(np.array(temperature),*popt)

plt.figure()
plt.plot(temperature,cp,color = 'b',linewidth = 3)
plt.plot(temperature,fit_cp,color = 'red', linewidth = 3)
plt.legend(['actaul data', 'curve fit'])
plt.xlabel('temperature')
plt.ylabel('cp')
plt.show()
5. What needs to be done in order to make the curve fit perfect?
- Linear fit is bad
- Cubic fit is better
- Quadratic fit is good
6. Show empirically as to how well your curve has been fit.
- The order of the polynomial should be increased.
- The given data needs to divided into parts and then the fit needs to be found.