1. What do popt and pcov mean?
The curve fit function in python returns two values they are popt and pcov
•Popt variable contains all the values of the coefficients of the equation described for the curve fit
•Pcov variable is a covariance matrix that indicates how the values co vary with each other.
2. What does np.array(temperature) do?
It is calling the temperature array which we already defined before
3. What does the * in *popt mean?
It is a syntax that provides and opens an array of coefficient variables. It is similar to np.array but with a different syntax.
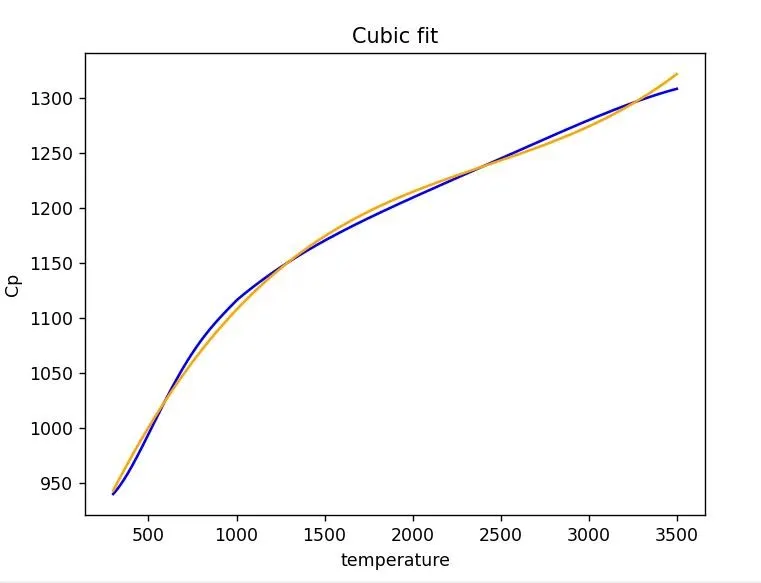
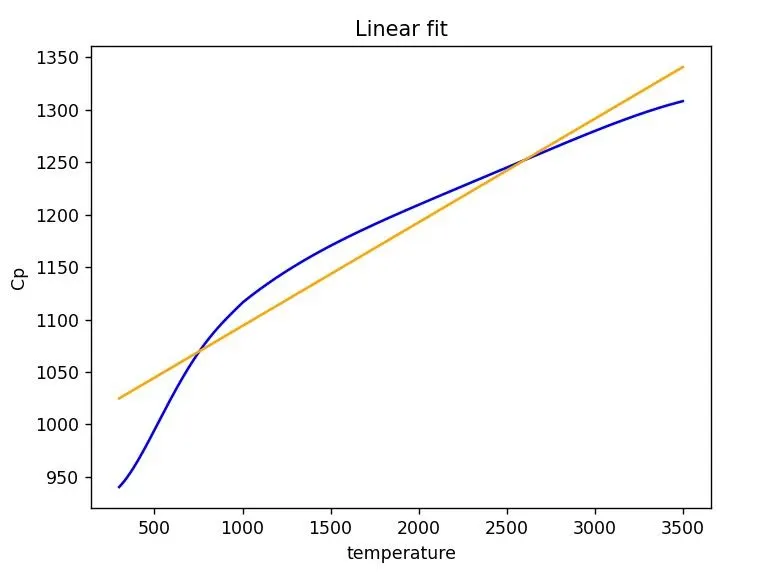
4. Write code to fit a linear and cubic polynomial for the Cp data. Explain if your results are good or bad.

import numpy as np
import matplotlib.pyplot as plt
from scipy.optimize import curve_fit

#linear fit
def func(t,a,b):
return a*t+b

#cubical fit
def func(t,a,b,c,d):
return a*pow(t,3)+b*pow(t,2)+c*t+d
#parsing the file to get cp and temperature values
def read_file():
	temperature = []
	cp = []
	for line in open('data','r'):
		values = line.split(',')
		temperature.append(float(values[0]))
		cp.append(float(values[1]))

	return[temperature,cp]
temperature,cp = read_file()
popt,pcov = curve_fit(func,temperature,cp)
fit_cp = func(np.array(temperature), *popt)
#R^2 Method
Mean = sum(cp)/len(cp)
#Total variation of cp
SSE = sum(pow(np.subtract(cp,fit_cp),2))
#Total variation of cp
SSR = sum(pow(np.subtract(cp,Mean),2))
R_squ = SSR/(SSR+SSE)
print('R^2 value:',R_squ)
plt.plot(temperature,cp,color = 'blue')
plt.plot(temperature,fit_cp, color = 'orange')
plt.xlabel('temperature')
plt.ylabel('Cp')
plt.title('Linear fit')
plt.show()


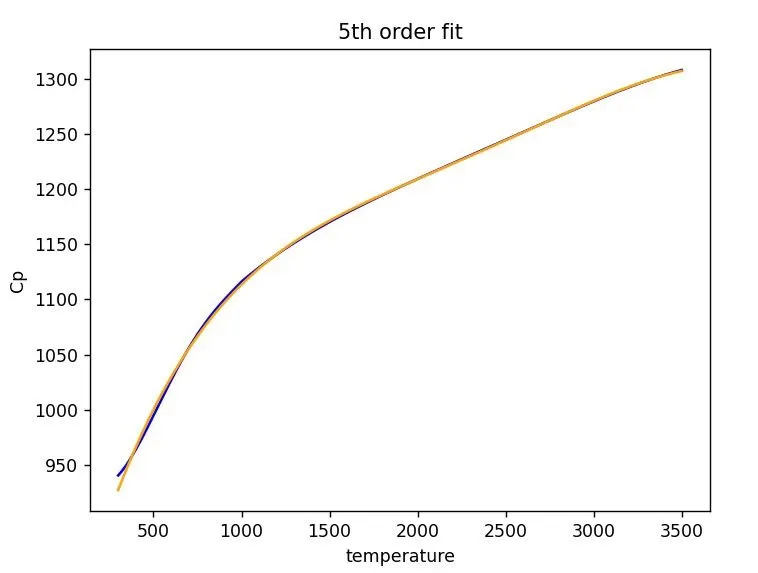
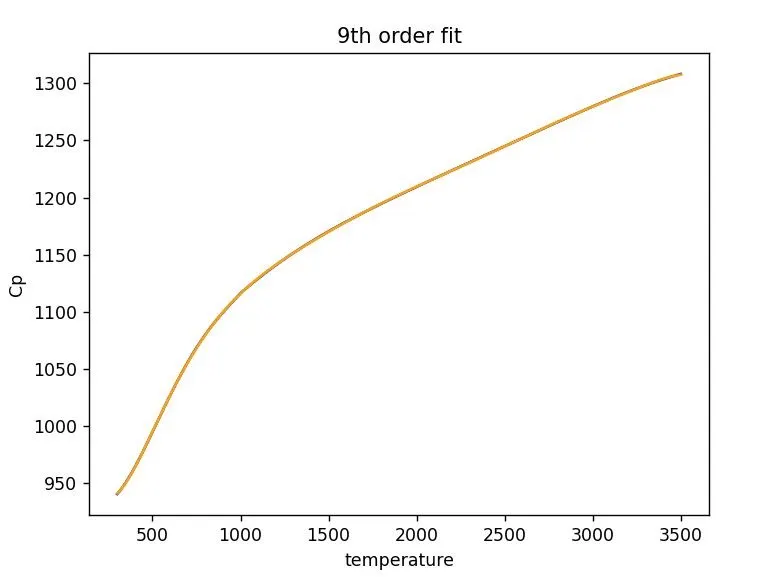
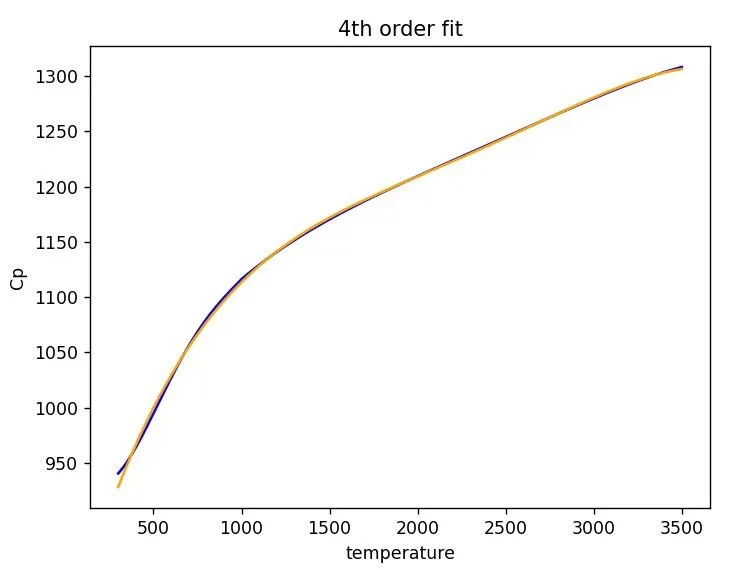
From the above results, it is clear that as the order of the polynomial increases the curve fit also becomes perfect. Compared to the linear fit the cubic fit is more accurate.

5. What needs to be done in order to make the curve fit perfect?
•To make the curve fit perfect we need to increase the order of the polynomial
•we can split the data into different sets and perform the curve fit to each data set and join them
6. Show empirically how well your curve has been fit.

R^2 value for 4th order curve: 0.9996156787578744


R^2 value of 5th order curve: 0.9996248060185965


R^2 value of 9th order curve: 0.999996671759416
In order to evaluate how well my curve is fit, I used the R^2 method to determine the quality of my curve. The best curve fit is when the value of the R^2 is close to 1. from the results we can see the value of the 9th order polynomial is almost equal to 1. So in this case the 9th order polynomial is the best fit for the given data.