Week 5 - Curve fitting
AIM: To write codes in Python to perform curve fitting.
OBJECTIVE:
1. To wite codes to fit a linear and cubic polynomial for the Cp data.
2. To plot the linear and cubic fit curves along with the raw data points.
3. To measure the fitness characteristics for both the curves.
PROCUDURE:
1. At first necessary modules such as math,matplotlib,numpy,scipy are imported to perform their respective functions.
2. Two functions are defined which return linear and cubic equations.
3. The following data is loaded into Python by placing it in right directory and a function read_file is created. For loop is used to run each line
by using 'open' command with 'r' to read it.
4. From the data obtained, two individual column matrices of temperature and specific heat are derived.
5. For curve fitting, *popt' and pcov' are used as output for storing parameters obtained by 'curve_fit' command which takes input as the
required function(linear or cubic), temperature and Cp. Now, another variable named fit_cp' stores the new values of Cp calculated by
using temperature array.
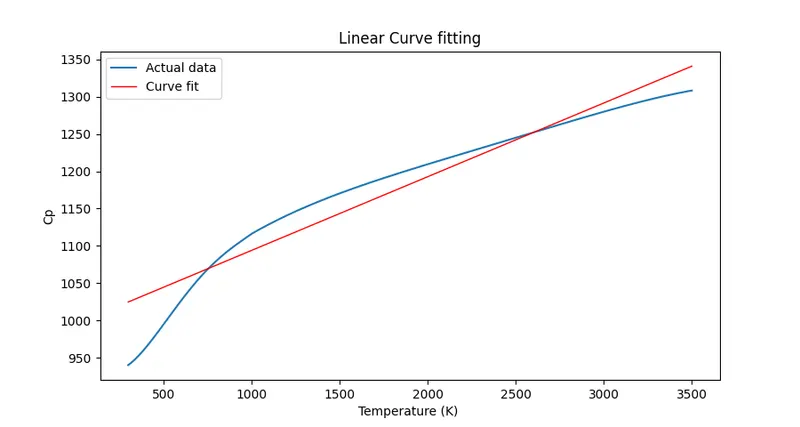
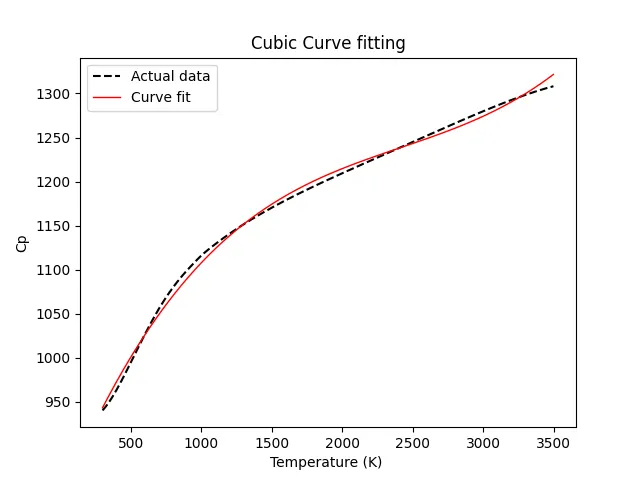
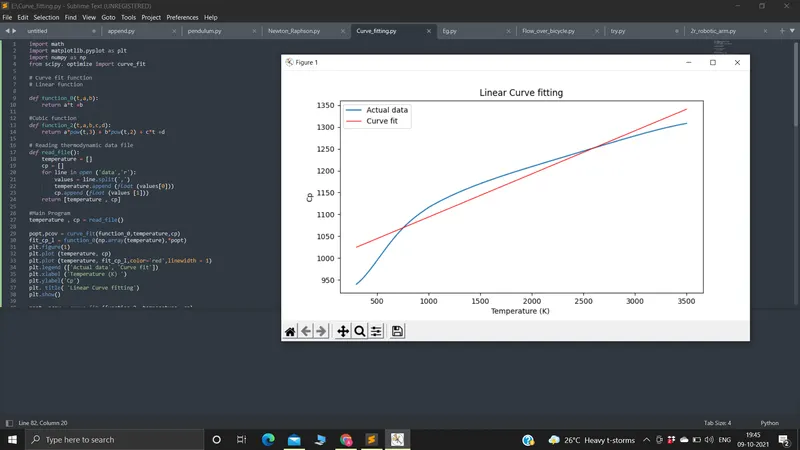
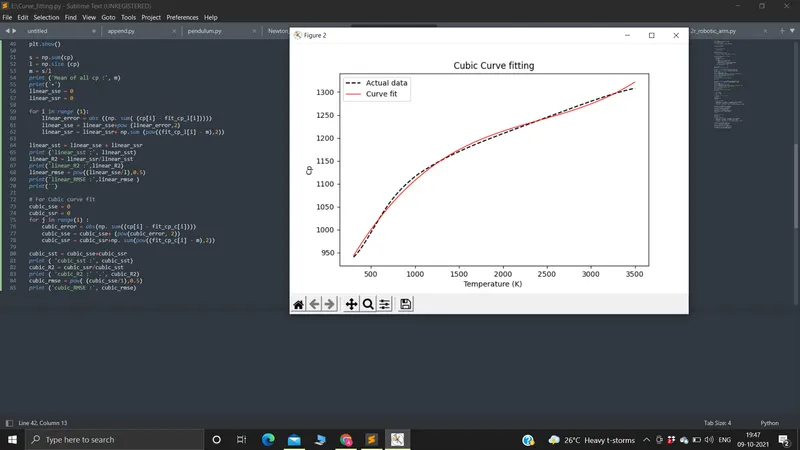
6. Plots of both raw dataset and predicted dataset are made and compared to find fitness characteristics for both the curves for both linear
and cubic polynomial.
7. To measure the fitness characteristics for both the curves, various parameters such as SSE.SSR,SST.R.RMSEarecalculated.The plotwhich has highest R' or closest to 1 is considered to be good fit.
1. What does popt and pcov mean?
Ans. 'popt' represents the matrix which stores and extracts the coefficients for the fitting functions according to the general equations defined.
'pcov' represents the square matrix which stores the estimated values of covariance of the coefficients of the above. The diagonal element of this square matrix also represents variance of that coefficients.
2. What does np.array (temperature) do?
Ans This command converts each value of temperature in the data file into an array using numpy module.
3. What does the * in *popt mean?
Ans*,*'popt' indicates and returns each coefficients stored in popt array.
4. What needs to be done in order to make the curve fit perfett?Ans If we increase the order of the polynomial, the error produced will be less and curve fit perfectly. On increas
of R? will be close to 1 and is assumed to perfect fit.
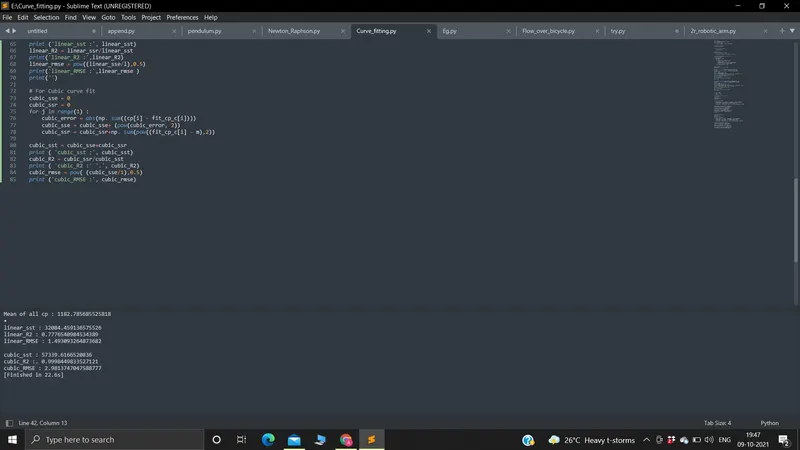
CODE
import math
import matplotlib.pyplot as plt
import numpy as np
from scipy. optimize import curve_fit

# Curve fit function
# Linear function

def function_0(t,a,b):
	return a*t +b

#Cubic function
def function_2(t,a,b,c,d):
	return a*pow(t,3) + b*pow(t,2) + c*t +d

# Reading thermodynamic data file
def read_file():
	temperature = []
	cp = []
	for line in open ('data','r'):
		values = line.split(',')
		temperature.append (float (values[0]))
		cp.append (float (values [1]))
	return [temperature , cp]

#Main Program
temperature , cp = read_file()

popt,pcov = curve_fit(function_0,temperature,cp)
fit_cp_l = function_0(np.array(temperature),*popt)
plt.figure(1)
plt.plot (temperature, cp)
plt.plot (temperature, fit_cp_l,color='red',linewidth = 1)
plt.legend (['Actual data', 'Curve fit'])
plt.xlabel ('Temperature (K) ')
plt.ylabel('Cp')
plt. title( 'Linear Curve fitting')
plt.show()

popt, pcov = curve_fit (function_2, temperature, cp)
fit_cp_c = function_2(np.array (temperature), *popt)
plt.figure(2)
plt.plot(temperature, cp,'k--')
plt.plot (temperature, fit_cp_c,color='red', linewidth = 1)
plt.legend (['Actual data', 'Curve fit'])
plt.xlabel ('Temperature (K) ')
plt.ylabel('Cp')
plt.title( 'Cubic Curve fitting')
plt.show()

#SSE (sum of error squared)
#SSR (sum of squares of the regression)
#SST = SSE + SSR
#R^2 = SSR/SST
#RMSE = (SSE/1) ^0.5

s = np.sum(cp)
l = np.size (cp)
m = s/l
print ('Mean of all cp :', m)
print('•')
linear_sse = 0
linear_ssr = 0

for i in range (1):
	linear_error = abs ((np. sum( (cp[i] - fit_cp_l[i]))))
	linear_sse = linear_sse+pow (linear_error,2)
	linear_ssr = linear_ssr+ np.sum (pow((fit_cp_l[i] - m),2))

linear_sst = linear_sse + linear_ssr
print ('linear_sst :', linear_sst)
linear_R2 = linear_ssr/linear_sst
print('linear_R2 :',linear_R2)
linear_rmse = pow((linear_sse/l),0.5)
print('linear_RMSE :',linear_rmse )
print('')

# For Cubic curve fit
cubic_sse = 0
cubic_ssr = 0
for j in range(1) :
	cubic_error = abs(np. sum((cp[i] - fit_cp_c[i])))
	cubic_sse = cubic_sse+ (pow(cubic_error, 2))
	cubic_ssr = cubic_ssr+np. sum(pow((fit_cp_c[i] - m),2))

cubic_sst = cubic_sse+cubic_ssr
print ( 'cubic_sst :', cubic_sst)
cubic_R2 = cubic_ssr/cubic_sst
print ( 'cubic_R2 :' '.', cubic_R2)
cubic_rmse = pow( (cubic_sse/1),0.5)
print ('cubic_RMSE :', cubic_rmse)


OUT PUT
Mean of all cp : 1182.785685525818
•
linear_sst : 32084.459136575526
linear_R2 : 0.7776540984534389
linear_RMSE : 1.493093264873682

cubic_sst : 57339.6166520836
cubic_R2 :. 0.9998449833527121
cubic_RMSE : 2.9813747047588777
[Finished in 22.6s]